

Abstract
Speech is a critical form of human communication and is central to our daily lives. Yet, despite decades of study, an understanding of the fundamental neural control of speech production remains incomplete. Current theories model speech production as a hierarchy from sentences and phrases down to words, syllables, speech sounds (phonemes), and the actions of vocal tract articulators used to produce speech sounds (articulatory gestures). Here, we investigate the cortical representation of articulatory gestures and phonemes in ventral precentral and inferior frontal gyri in men and women. Our results indicate that ventral precentral cortex represents gestures to a greater extent than phonemes, while inferior frontal cortex represents both gestures and phonemes. These findings suggest that speech production shares a common cortical representation with that of other types of movement, such as arm and hand movements. This has important implications both for our understanding of speech production and for the design of brain–machine interfaces to restore communication to people who cannot speak.
SIGNIFICANCE STATEMENT Despite being studied for decades, the production of speech by the brain is not fully understood. In particular, the most elemental parts of speech, speech sounds (phonemes) and the movements of vocal tract articulators used to produce these sounds (articulatory gestures), have both been hypothesized to be encoded in motor cortex. Using direct cortical recordings, we found evidence that primary motor and premotor cortices represent gestures to a greater extent than phonemes. Inferior frontal cortex (part of Broca's area) appears to represent both gestures and phonemes. These findings suggest that speech production shares a similar cortical organizational structure with the movement of other body parts.
Keywords: articulatory gestures, brain–computer interface, encoding, phonemes, segments, speech production
Introduction
Speech is composed of individual sounds, called segments or (hereafter) phonemes (Bakovic, 2014), that are produced by coordinated movements of the vocal tract (e.g., lips, tongue, velum, and larynx). However, it is not certain exactly how these movements are planned. For example, during speech planning, phonemes are coarticulated—the vocal tract actions (constrictions or releases), or articulatory gestures, that comprise a given phoneme change based on neighboring phonemes in the uttered word or phrase (Whalen, 1990). While the dynamic properties of these gestures, which are similar to articulator kinematics, have been extensively studied (Westbury et al., 1990; Nam et al., 2012; Bocquelet et al., 2016; Bouchard et al., 2016; Carey and McGettigan, 2017), there is no direct evidence of gestural representations in the brain.
Recent models of speech production propose that articulatory gestures combine to create acoustic outputs (phonemes and phoneme groupings such as syllables; Browman and Goldstein, 1992; Guenther et al., 2006). Guenther et al. (2006) hypothesized that ventral premotor cortex (PMv) and inferior frontal gyrus (IFG; part of Broca's area) preferentially represent (groupings of) phonemes and that ventral motor cortex (M1v) preferentially represents gestures. This hypothesis is analogous to limb motor control, in which premotor cortices preferentially encode reach targets and M1 encodes reaching details (Hocherman and Wise, 1991; Shen and Alexander, 1997; Hatsopoulos et al., 2004; Pesaran et al., 2006). However, the hypothesized localizations of speech motor control of the model were based on indirect evidence from behavioral studies (Ballard et al., 2000), nonspeech articulator movements (Penfield and Roberts, 1959; Fesl et al., 2003), and fMRI studies of syllables (Riecker et al., 2000; Guenther et al., 2006; Ghosh et al., 2008; Tourville et al., 2008). None of the modalities used in these studies had a sufficient combination of temporal and spatial resolution to provide definitive information about where and how gestures and phonemes are encoded.
Electrocorticography (ECoG) has enabled the identification of neural activity with high spatial and temporal resolution during speech production (Kellis et al., 2010; Pei et al., 2011b; Bouchard et al., 2013; Mugler et al., 2014b; Slutzky, 2018). High gamma activity (70–200 Hz) in ECoG from ventral precentral gyrus (PCG; encompassing M1v and PMv) corroborated Penfield's original somatotopic mappings of the articulators (Penfield and Boldrey, 1937) and approximately correlated with phoneme production (Bouchard et al., 2013; Lotte et al., 2015; Ramsey et al., 2018), as well as the manner and place of articulation (Bouchard et al., 2013; Lotte et al., 2015). Mugler et al. (2014b) demonstrated that single instances of phonemes can be identified during word production using ECoG from PCG. However, the ability to decode phonemes from these areas was rather limited, which suggests that phonemes may not optimally characterize the representation of these cortical areas. Some evidence exists that cortical activations producing phonemes differ depending on the context of neighboring phonemes (Bouchard and Chang, 2014; Mugler et al., 2014a). Moreover, incorporating probabilistic information of neighboring phonemes improves the ability to decode phonemes from PCG (Herff et al., 2015). Therefore, these areas might demonstrate predominant representation for gestures, not phonemes. However, no direct evidence of gestural representation in the brain has yet been demonstrated.
Here, we used ECoG from PCG and IFG to classify phonemes and gestures during spoken word production. We hypothesized that posterior PCG (approximate M1v) represents the movements, and hence the gestures, of speech articulators. We first examined the ability to determine the positions of phonemes and gestures within words using ECoG. We next compared the relative performances of gesture and phoneme classification in each cortical area. Finally, we used a special case of contextual variance—allophones, in which the same phoneme is produced with different combinations of gestures—to highlight more distinctly the gestural versus phonemic predominance in each area. The results indicate that gestures are the predominant elemental unit of speech production represented in PCG, while both phonemes and gestures appear to be more weakly represented in IFG, with gestures still slightly more predominant.
Materials and Methods
Subject pool.
Nine adults (mean age, 42 years; five females) who required intraoperative ECoG monitoring during awake craniotomies for glioma removal volunteered to participate in a research protocol during surgery. We excluded subjects with tumor-related symptoms affecting speech production (as determined by neuropsychological assessment) and non-native English speakers from the study. All tumors were located at least two gyri (∼2–3 cm) away from the recording electrodes. As per the standard of care, subjects were first anesthetized with low doses of propofol and remifentanil, then awakened for direct cortical stimulation mapping. All experiments were performed after cortical stimulation, hence, during experiments, no general anesthesia had been administered for at least 45 min; no effects on speech articulation were detected. Subjects provided informed consent for research, and the Institutional Review Board at Northwestern University approved the experimental protocols.
Electrode grid placement was determined using both anatomical landmarks and functional responses to direct cortical stimulation. Electrode grids were placed to ensure the coverage of areas that produced movements of the articulators when stimulated. ECoG grid placement varied slightly with anatomy but consistently covered targeted areas of ventral posterior PCG (pPCG; the posterior half of the gyrus, approximately equivalent to M1v), ventral anterior PCG (aPCG; the anterior half of the gyrus, approximately equivalent to PMv), and IFG pars opercularis, usually aligning along the Sylvian fissure ventrally. We defined our locations purely by anatomy to be conservative, since it was impossible to define them functionally in vivo, but with the intention of estimating M1v and PMv. We confirmed grid location with stereotactic procedure planning, anatomical mapping software (Brainlab), and intraoperative photography (Hermes et al., 2010).
Data acquisition.
A 64-electrode, 8 × 8 ECoG grid (4 mm spacing; Integra) was placed over the cortex and connected to a Neuroport data acquisition system (Blackrock Microsystems). Both stimulus presentation and data acquisition were facilitated through a quad-core computer running a customized version of BCI2000 software (Schalk et al., 2004). Acoustic energy from speech was measured with a unidirectional lapel microphone (Sennheiser) placed near the patient's mouth. The microphone signal was wirelessly transmitted directly to the recording computer (Califone), sampled at 48 kHz, and synchronized to the neural signal recording.
All ECoG signals were bandpass filtered from 0.5 to 300 Hz and sampled at 2 kHz. Differential cortical recordings compared with a reference ECoG electrode were exported for analysis with an applied bandpass filter (0.53–300 Hz) with 75 μV sensitivity. Based on intraoperative photographs and Brainlab reconstructions of array coordinates, electrodes in the posterior and anterior halves of the precentral gyrus were assigned to pPCG and aPCG, respectively, while those anterior to the precentral sulcus and ventral to the middle frontal sulcus were assigned to IFG. Data will be made available upon request to the senior author.
Experimental protocol.
We presented words in randomized order on a screen at a rate of 1 every 2 s, in blocks of 4.5 min. Subjects were instructed to read each word aloud as soon as it appeared. Subjects were surveyed regarding accent and language history, and all subjects included here were native English speakers. All subjects completed at least two blocks, and up to three blocks.
All word sets consisted of monosyllabic words and varied depending on subject and anatomical grid coverage. Stimulus words were chosen for their simple phonological structure, phoneme frequency, and phoneme variety. Many words in the set were selected from the modified rhyme test (MRT), consisting of monosyllabic words with primarily consonant–vowel–consonant (CVC) structure (House et al., 1963). The frequency of phonemes within the MRT set roughly approximates the phonemic frequency in American English (Mines et al., 1978). The MRT was then supplemented with additional CVC words to incorporate all general American English phonemes to the word set with a more uniform phoneme incidence. The mean word duration was 520 ms. Consonant cluster allophone words contained initial stop consonants; each allophone example included a voiced, a voiceless, and a consonant cluster allophone word (e.g., “bat,” “pat,” and “spat”; Buchwald and Miozzo, 2011).
Signal processing.
We examined normalized activity in the high gamma band (70–290 Hz), since this band is highly informative about limb motor (Crone et al., 2001; Mehring et al., 2004; Chao et al., 2010; Flint et al., 2012a,b, 2017), speech (Crone et al., 2001; Pei et al., 2011a; Bouchard et al., 2013; Ramsey et al., 2018), and somatosensory activity (Ray et al., 2008), and correlates with ensemble spiking activity (Ray and Maunsell, 2011) and blood oxygenation level-dependent activity (Logothetis et al., 2001; Hermes et al., 2012). ECoG signals were first rereferenced to a common average of all electrodes in the time domain. We used the Hilbert transform to isolate band power in eight linearly distributed 20-Hz-wide sub-bands within the high gamma band that avoided the 60 Hz noise harmonics and averaged them to obtain the high gamma power. We then normalized the high gamma band power changes of each electrode, by subtracting the median and dividing by the interquartile range, to create frequency features for each electrode.
To create features in the time domain, we segmented normalized high gamma values for each electrode in 50 ms time bins from 300 ms before and 300 ms after the onset of each event (phoneme or gesture). This was far enough in advance of event onset to capture most relevant information in IFG, which starts ∼300 ms before word onset (Flinker et al., 2015). This created discrete, event-based trials that summarized the time-varying neural signal directly preceding and throughout the production of each phoneme or gesture. Time windows for allophone feature creation were shorter (−300 to 100 ms) to further reduce the effect of coarticulation on the allophone classification results. The phonemes that were classified in allophone analysis (/p/, /b/, /t/, /d/, /k/, and /g/) were all plosives (stop consonants) and had durations of <100 ms, so we were able to use this shorter window without losing information about the phonemes. This is in contrast to the direct classification of phonemes and gestures, which included phonemes such as /m/ and /n/ that were longer in duration; hence, we used activity up to 300 ms after onset to capture this information.
Phoneme and gesture labeling.
Following standard practices, we used visual and auditory inspection of auditory spectral changes to manually label the onset of each phoneme in the speech signal (Mugler et al., 2014b). For plosives, phoneme onset was marked by acoustic release. For fricatives, phoneme onset was marked by the onset of aperiodic noise. For sonorants and vowels, onset was marked by changes to spectral properties. To label gesture onset times, acoustic–articulatory inversion was used on the audio recordings of subjects. This technique maps articulator trajectories from acoustic data, using a model that accounts for subject- and utterance-specific differences in production. We used an acoustic–articulatory inversion (AAI) model, described in (Wang et al., 2015), based on a deep neural network trained on data from the University of Wisconsin x-ray Microbeam corpus (Westbury et al., 1990), with missing articulatory data filled in using the data imputation model of (Wang et al., 2014). This model performed highly in predicting articulators in data from the corpus that were not used in training (i.e., in cross-validation), with a root-mean square error of only 1.96 mm averaged over all articulators. This error was smaller than that reported in similar studies, including a study that used AAI to then drive a speech synthesizer, in which an error of 2.5 mm still produced synthesized speech that was recognizable a high percentage of the time (Bocquelet et al., 2016). Moreover, we simulated this error by adding Gaussian noise with mean of 0 and an SD of 1.96 to the position and velocity estimates from AAI, and computed the error in gestural time estimates in two subjects. We found that this amount of noise translated to a mean ± SD error of 5.2 ± 9.8 ms in time, which was far smaller than our time bins used for decoding. While there could be some discrepancies in applying this model to patients in an operating room, possibly with dry mouths, lying on their side, even an error of 5 mm per articulator translated in simulation to errors of only 5.3 ± 13 ms in timing. Even if there were errors that were larger than this, the resulting errors in timing would bias the decoding performance results to be poorer for gestures, rather than better. Thus, any discrepancies in gestural timing due to the limits of AAI would not affect our results.
We used AAI to generate articulator positions of the lips, tongue tip, and tongue body at a time resolution of 10 ms (Fig. 1). The lip aperture was defined as the Euclidean combination of vertical and horizontal positions in the sagittal plane, and tongue apertures were defined using vertical position. Position trajectories were smoothed with a Gaussian kernel of 50 ms. The onsets of each gesture (closure, critical closure, and release) were defined from the position and velocity traces, as in the study by Marianne and Goldstein (2010). In brief, gesture onset time was defined as the moment the articulator had surpassed 20% of the difference between minimum velocity preceding movement and maximum velocity during gesture formation. For plosives, the onset of gesture release (e.g., tongue tip release) was set to phoneme onset time. Since AAI does not provide laryngeal or velar information, the Task Dynamic (TADA) model of interarticulator coordination was used to generate expected velar gesture onset times (Saltzman and Munhall, 1989; Nam et al., 2012). This model (TADA) is not speaker specific, so the onset times were scaled proportionally by the ratio of the default word duration (from TADA) to the actual duration of each word. We used these onset times for each event in the speech signal to segment ECoG features.
Figure 1.
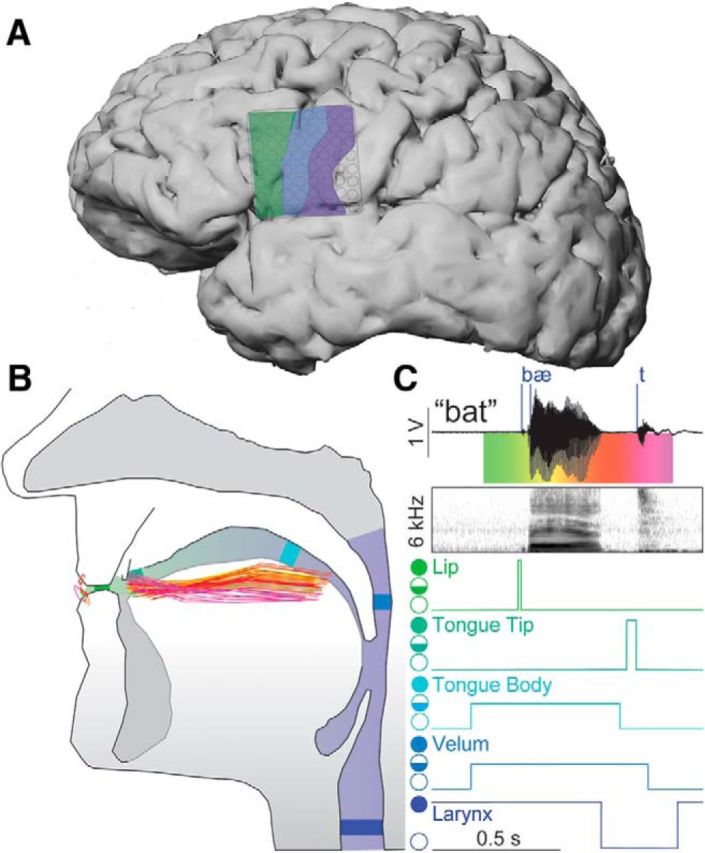
Defining phoneme and articulatory gesture onsets. A, Cerebral cortex of Subject 5 (S5) with recorded regions of speech motor cortex highlighted: IFG (green), aPCG (blue), and pPCG (purple). B, Vocal tract with positions of the lips, tongue body, and tongue tip during production of a single word. Each trace represents the position, at 10-ms intervals, generated by the AAI model, from word onset (green) to word offset (magenta; see corresponding colors in C). C, Example audio signal, and corresponding audio spectrogram, from S5 with labeled phonemic event onsets (blue vertical lines) mapped to vocal tract articulatory gesture positions. Target apertures for each articulatory gesture action are marked from open (open circle), to critical (half-filled circle), to closed (filled circle). Note that larynx has opposite open/close orientation as its default configuration is assumed to be near closure (vibrating; Browman and Goldstein, 1992). Also note that while the initial and final consonants are associated with a specific velum-closing action, the vowel does not specify such a gesture (thus, the state of the velum during the vowel depends on the surrounding gestures).
Intraword position classification.
We analyzed how cortical high gamma activity varies with the context of phonemic and gestural events (i.e., coarticulation) in two subjects producing consonant–vowel–consonant words. We used the high gamma activity on each electrode individually to classify whether each consonant phoneme or gesture was the initial or final consonant in each word. The coarticulation of speech sounds means that phonemes are not consistently associated with one set of gestures across intraword positions. Therefore, we predicted that if gestures characterize the representational structure of a cortical area, the cortical activity associated with a phoneme should vary across word positions. In contrast, because gestures characterize speech movements that do not vary with context, the cortical activity associated with a gesture should also be context invariant. Therefore, we did not expect to be able to classify the position of a gesture with better than chance accuracy. For this analysis, we included three types of gestures (closures of tongue tip, tongue body, or lips) and their associated phonemes. To reduce the likelihood of including cortical activity related to production of neighboring events (e.g., vowel-related phonemes or gestures) in our classification, we only used the high gamma activity immediately surrounding event onset (from 100 ms before to 50 ms after, in 25 ms time bins) to classify intraword position from individual electrodes. We classified initial versus final position using linear discriminant analysis (LDA; with 10 × 10 cross-validation repeats), since there were only six features for each classifier.
To quantify the significance (and effect size) of our results, we examined the discriminability index d′ between accuracy (percentage correct) of phonemic or gestural position and chance accuracy. The d′ between two groups is defined as the difference of their means divided by their pooled SD. For example, , where μg is the mean of gestural position accuracy, ng is the number of gesture instances minus one, and σg is the SD of gesture instances, and the same symbols with subscript p stand for phonemes. Mean values of d′ were computed from electrodes that were related to the corresponding gesture type. This was determined by classifying all gestures (except larynx) using the high gamma activity from each individual electrode, in 25 ms time bins, from 100 ms before to 50 ms after gesture or phoneme onset as features; and classifying using classwise principal component analysis (PCA; see below). Each electrode was designated as being related to the gesture that was classified most accurately.
Event classification and statistical analysis.
To obtain more detailed information about the encoding of each cortical area, we also used ECoG high gamma activity to classify which phoneme or gesture was being uttered at each event onset. We classified consonant phonemes and all gestures except for larynx. We limited our phoneme/gesture classification analysis to consonant phonemes for two reasons. First, the TADA model assumes that the larynx (or glottis) is closed by default (Browman and Goldstein, 1992), which makes it very difficult, if not impossible, to assign meaningful onset (closure) times to this gesture that is present in all vowels. In addition, we wished to avoid the influence of coarticulation of neighboring phonemes. Therefore, we removed vowels and /s/ phonemes, as well as the larynx-closing gesture, from the analysis. To ensure sufficient accuracy of our classification models, we included only phonemes with at least 15 instances, resulting in approximately the same number of phoneme classes as gesture classes (average of 15.2 phonemes across subjects). The phonemes most commonly included were {/p/,/b/,/m/,/f/,/d/,/t/,/n/,/l/,/r/,/g/,/k/,/v/,/j/}. We classified 12 gestures—lips (open, close, critical), tongue tip (open, close, critical), tongue body (open, close, critical), and velum (open, close, critical) in all subjects.
Due to the large number of potential features and the relatively low number of trials, we used classwise PCA (CPCA) to reduce the dimensionality of the input feature space and hence to reduce the risk of overfitting. CPCA performs PCA on each class separately, which enables dimensionality reduction while preserving class-specific information (Das and Nenadic, 2009; Das et al., 2009). For each class, the procedure chose a feature subspace consisting of all components with eigenvalues larger than the mean of the nonzero eigenvalues (Das and Nenadic, 2009). LDA was then used to determine the feature subspace with the most information about the classes. The high gamma features were then projected into this subspace, and LDA was used to classify the data (Slutzky et al., 2011; Flint et al., 2012b). We used one-versus-the rest classification, in which one event class was specified and events not in that class were combined into a “rest” group. We reported only the accuracy of classifying a given class (e.g., in /p/ vs the rest, we reported the accuracy of classifying the /p/ class, but not the rest class), to avoid bias in accuracy due to the imbalance in “one” and rest class sizes. We used 10-fold cross-validation with randomly selected test sets (making sure that at least some of the target events were in each test set) to compute classification performance. We repeated the 10-fold cross-validation 10 times (i.e., reselected random test sets 10 times), for a total of 100-fold. Chance classification accuracies were determined by randomly shuffling event labels 200 times and reclassifying. We created an overall performance for each subject as a weighted average of all the events; the performance of each phoneme or gesture was weighted by the probability of that phoneme or gesture in the dataset. The Wilcoxon signed-rank test was used for all statistical comparisons reported.
Allophone classification.
Four participants read aloud a specific set of spoken, monosyllabic words from the speech control literature that included allophones to amplify the distinction between phonemic and gestural representation in specific cortical areas (Buchwald and Miozzo, 2011). Allophones are different pronunciations of the same phoneme in different contexts within words, which reflect the different gestures being used to produce that phoneme (Browman and Goldstein, 1992). For example, consonant phonemes are produced differently when isolated at the beginning of a word (e.g., the /t/ in “tab,” which is voiceless) compared with when they are part of a cluster at the beginning of a word (e.g., the /t/ in “stab,” which is acoustically more similar to a voiced /d/; see Fig. 5A). Using word sets with differing initial consonant allophones (either CVC or consonant–consonant–vowel–consonant in organization) enabled us to dissociate more directly the production of phonemes from the production of gestures. This can be thought of as changing the mapping between groups of gestures and an allophone, somewhat analogous to limb motor control studies that used artificial visual rotations to change the mapping between reach target and kinematics to assess cortical representation (Wise et al., 1998; Paz et al., 2003).
Figure 5.
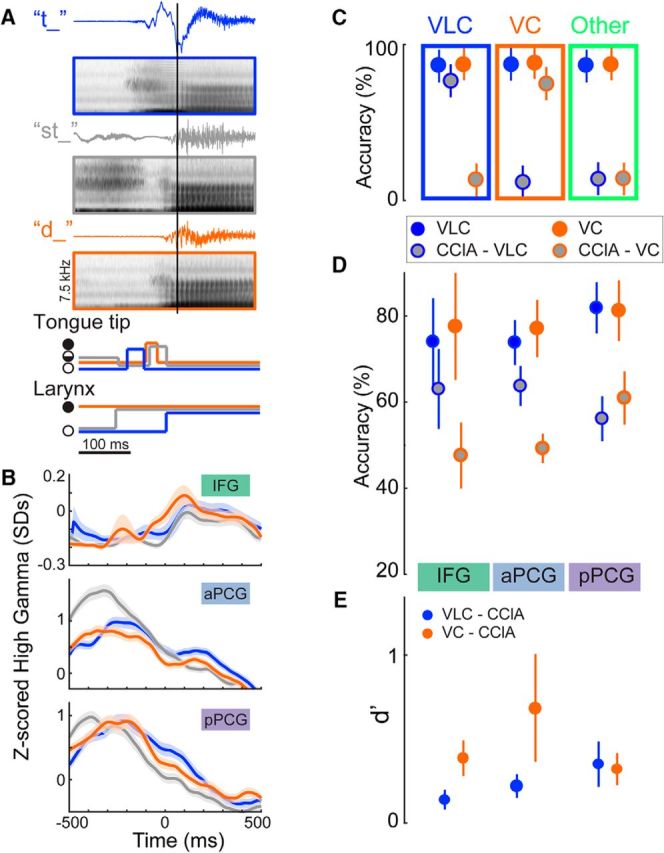
Classification of consonant allophones using ECoG from each cortical area. A, Examples of audio waveforms, averaged spectrograms, and gestures for an allophone set ({/t/,/st/,/d/}) aligned to vowel onset (black vertical line). Only the trajectories for articulators that show differences for these phonemes are depicted (filled circle, close; open circle, open; half-filled, partial closure (critical)). Colors throughout the figure represent VLC (/t/, blue), VC (/d/, orange), and CClA (/st/, gray). B, Examples of normalized high gamma activity (mean ± SE) at three electrodes during /t/, /d/, and /st/ production in S5. Allophone onset is at time 0. One electrode from each cortical area is shown. CClA activity (gray) in these IFG and aPCG electrodes is more similar to the VLC (blue), especially at approximately time 0, while in pPCG it is more similar to VC (orange). C, Schematic depicting three different idealized performance patterns in a single cortical area. Solid circles denote the performance of the classification of VLCs (blue) and VCs (orange) using their respective classifiers. Gray-filled circles denote CClA classification performance using the VLC (blue outline) and VC (orange outline) classifiers. High CClA performance (close to that of the respective solid color) would indicate that the allophone behaved more like the VLC or VC than like other consonants in the dataset. Blue rectangle, CClA performed similarly to the VLC; orange rectangle, CClA performed similarly to the VC; green rectangle, CClA performed differently than both VLCs and VCs. D, Classification performance (mean ± SEM across subjects and allophone sets) in each cortical area of VLCs and CClAs in voiceless classifiers, and VCs and CClAs in voiced classifiers. CClAs show much lower performance on VLC classifiers than VLCs perform in pPCG, while the performance is much closer in IFG and aPCG. The opposite trend occurs with CClA performance on the VC classifiers. E, d'values (mean ± SEM across subjects and sets) between the singlet consonant performance and allophone consonant performance for each area; larger values are more discriminable. Blue circles, VLC vs CClA performance using VLC classifiers; orange circles, VC vs CClA performance using VC classifiers. In summary, CClAs perform more like VLCs and less like VCs moving from posterior to anterior.
We trained separate classifiers (CPCA with LDA, as in the prior section) for voiceless consonants (VLCs) and voiced consonants (VCs), and tested their performance in decoding both the corresponding isolated allophone (VLC or VC) and the corresponding consonant cluster allophone (CClA). For example, we built classifiers of /t/ (vs all other consonants) and /d/ (vs all other consonants) and tested them in classifying the /t/ in words starting with “st.”
Results
We simultaneously recorded ECoG from PCG and IFG (pars opercularis) and speech audio during single-word, monosyllabic utterances by nine human participants (eight with left hemispheric recordings) undergoing functional mapping during awake craniotomies for the resection of brain tumors (Fig. 2).
Figure 2.

Electrode array locations for all nine subjects. Top schematic shows the approximate area of cortex (rectangle) displayed for each subject. Shaded areas represent the different cortical areas: IFG (green), aPCG (blue), and pPCG (purple). Note that Subject 2 was implanted in the right hemisphere and so anterior–posterior direction is reversed. IFG electrodes in Subject 9 were excluded because they were too close to the tumor margin. CS, Central sulcus; SF, Sylvian fissure.
Phoneme-related, but not gesture-related, cortical activity varies with intraword position
We first analyzed how high gamma activity varies with the position of phonemes and gestures within words. We found that the high gamma activity in pPCG and aPCG did not change with the intraword position of the gesture (Fig. 3A, right, examples). In contrast, when aligned to phoneme onset, high gamma activity in pPCG and aPCG did vary with intraword position (Fig. 3A, left). Figure 3B shows an example of the classification of tongue body and tongue tip closure position from all electrodes that predominantly encoded those gestures (based on single-electrode decoding of all gesture types; see Materials and Methods). Gesture classification accuracies were not larger than chance, while accuracies of classifying associated phonemes ({/k/,/g/} for tongue body and {/t/,/d/,/l/,/n/,/s/} for tongue tip) were indeed larger than chance. To quantify the accuracy of classification compared with chance over electrodes, we computed the d′ value on each electrode (Fig. 3C, examples). d′ is the difference of means (in this case, between phoneme or gesture position and chance accuracy) divided by the pooled SD (see Materials and Methods); a d′ value of >1 is considered large. We computed the mean d′ value over all electrodes in pPCG and aPCG that were modulated with lip, tongue tip, or tongue body gestures (see Materials and Methods). We found that, over all of these electrodes in both subjects, d′ was large for the associated phonemes (2.3 ± 0.6; mean ± SEM) and no different from zero for gestures (−0.06 ± 0.6). We also examined all electrodes in pPCG and aPCG, regardless of modulation, and found similar results: d′ was large for phonemes (2.7 ± 0.3) and no different from zero for gestures (0.2 ± 0.3). Thus, cortical activity for gestures did not vary with context, while cortical activity for phonemes varied substantially across contexts.
Figure 3.

Variation of cortical activity with intraword position of phonemes and gestures. Phoneme-related activity changes with context, while gesture-related activity does not. A, Mean (±SD; shaded areas) high gamma activity on two electrodes in subject Subject 5 aligned to onset of the phoneme (left) or gesture (right) event. Activity is separated into instances of all events [/t/ or /k/ for phonemes, tongue tip closure (TTC) or tongue body closure (TBC) for gestures] occurring either at the beginning of a word (light green) or at the end of a word (dark green). Gray dashed lines represent a-100 to 50 ms interval around onset. B, An example of classification accuracy (mean ± 95% CI) of intraword position on one electrode (e56) related to either tongue body (left, same as bottom plots in A) or tongue tip (e46; right, same as top plots in A) in S5 for phonemes (blue) and gestures (red). Gestural position classification does not outperform chance (gray), while phonemic position classification performs significantly higher than chance. C, Spatial distribution of d′ for differences between phonemic and gestural position accuracy and chance. Phonemic position accuracy is much higher than chance while gestural position accuracy is not on tongue tip- and tongue body-related electrodes (outlined electrodes). Shaded areas correspond to cortical areas as in Figure 2A.
pPCG, aPCG, and IFG more accurately represent gestures than phonemes
To further investigate sublexical representation in the cortex, we used high gamma activity from eight participants to classify which phoneme or gesture was being uttered at each event onset. We first classified phonemes and gestures separately using recordings combining all precentral gyrus electrodes (pPCG/aPCG). Combined pPCG/aPCG (PCG for short) activity classified gestures with significantly higher accuracy than phonemes, as follows: 63.7 ± 3.4% vs 41.6 ± 2.2% (mean ± SEM across subjects; p = 0.01) as seen in Figure 4A. Gestural representations remained significantly dominant over phonemes after subtracting the chance decoding accuracy for each type (mean 34.3 ± 3.4% vs 17.5 ± 2.2%; p = 0.008; Fig. 4B).
Figure 4.

Classification of phonemes and gestures. A, Mean (±SEM over subjects) classification accuracy using combined aPCG and pPCG activity of phonemes (blue squares) and gestures (red circles). Shown are both raw accuracy (left; dotted lines showing chance accuracy) and accuracy relative to chance (right). Gestures were classified significantly (*) more accurately than phonemes. B, Classification accuracy for phonemes (blue) and gestures (red) using activity from IFG, aPCG, and pPCG separately, for subject S5 (left; ±SD) and population mean (right; ±SEM). C, Accuracy relative to chance in each area for S5 (left) and population mean (right). Gesture classification was significantly higher than phoneme classification in pPCG and aPCG (*). D, d′ values (mean ± SEM over subjects) between gesture and phoneme accuracies in each area.
M1v, PMv, and IFG have been theorized to contribute differently to speech production, movements, and preparation for speech. We therefore investigated the representation of each individual area by performing gesture and phoneme classification using the ensemble of electrodes from each cortical area, in each subject, separately. Classification performance of both types increased as the area used moved from anterior to posterior location. In each area, gestures were classified with greater accuracy than phonemes (IFG: 48.8 ± 6.8% vs 39.1 ± 5.6%, p = 0.03; aPCG: 58.3 ± 3.6% vs 40.7 ± 2.1%, p = 0.016; pPCG: 62.6 ± 2.2% vs 47.3 ± 2.0%, p = 0.008; Fig. 4C). This predominance remained after subtracting chance accuracy across subjects (IFG: 17.9 ± 6.4%, p = 0.016, aPCG: 25.3 ± 12.0%, p = 0.008, pPCG: 27.7 ± 16.4%, p = 0.016; Fig. 4D). The difference was significant in pPCG and aPCG, but not in IFG, when using Bonferroni's correction for multiple comparisons. The difference in accuracy was not due to gestures having a greater incidence than phonemes (mean ± SEM; 61 ± 13 vs 147 ± 44 instances per phoneme vs per gesture, respectively), as significant differences remained when we performed decoding on a dataset with maximum numbers of gesture and phoneme instances matched (data not shown). To quantify the difference further, we computed the d′ values between accuracies of gestures and phonemes in each area. The d′ values in pPCG and aPCG were both very high (3.6 and 2.9), while that in IFG was slightly less (2.0), suggesting a more decreased gestural predominance in IFG than in pPCG or aPCG.
Allophone classification supports predominance of gestural representations
In four participants, we used word sets emphasizing consonant allophones (voiced, voiceless, and clustered with /s/) to amplify the distinction between phonemic and gestural representations. The /t/ in st words was acoustically more similar to, and produced with high gamma activity more like, a /d/ in aPCG electrodes, and more like a solitary initial /t/ in aPCG and IFG (Fig. 5A,B). We investigated the extent to which CClAs behaved more similarly to VLCs or to VCs in each area. If CClAs were classified with high performance using the voiceless classifier (Fig. 5C, blue rectangle), we would infer that phonemes were the dominant representation. If CClAs were classified with high performance using the voiced classifier, we would infer that gestures were the dominant representation (Fig. 5C, orange rectangle). If CClAs were classified with low performance by both classifiers (Fig. 5C, green rectangle), it would suggest that the CClA were a distinct category, produced differently from the voiced and from the voiceless allophone.
Cluster consonants behaved less like the phoneme and more like the corresponding gesture when moving from anterior to posterior in the cortex (Fig. 5D,E). For example, in IFG and aPCG, the CClAs behaved much more like the VLC phonemes than they did in pPCG (p = 0.6, 0.5, and 0.008 and d′ = 0.1, 0.2, and 0.4 in IFG, PMV, and pPCG, respectively for performance of the VLC classifier on VLCs vs CClAs). The CClAs behaved more like the VC phonemes in pPCG than in aPCG and IFG (d′ = 0.4, 0.7, and 0.3 in IFG, aPCG, and pPCG, respectively), although there was still some difference in pPCG between CClA performance and VC performance. The CClAs were produced substantially more like VC phonemes than like VLC phonemes in pPCG, which implies that pPCG predominantly represents gestures. The difference between CClAs and VC phonemes suggests that the cluster allophones may represent another distinct speech sound category.
Discussion
We investigated the representation of articulatory gestures and phonemes in precentral and inferior frontal cortices during speech production. Activity in these areas revealed the intraword position of phonemes but not the position of gestures. This suggests that gestures provide a more parsimonious, and more accurate, description of what is encoded in these cortices. Gesture classification significantly outperformed phoneme classification in pPCG and aPCG, and in combined PCG, and trended toward better performance in IFG. Consonants in clusters behaved more similarly to the consonant that shared more similar gestures (voiced), rather than the consonant that shared the same phoneme (voiceless) in more posterior areas; this relationship tended to reverse in more anterior areas. Together, these results indicate that cortical activity in PCG (M1v and PMv), but not in IFG, represents gestures to a greater extent than phonemes during production.
This is the most direct evidence of gesture encoding in speech motor cortices. This evidence supports theoretical models incorporating gestures in speech production, such as the TADA model of interarticulator coordination and the Directions-Into-Velocities of Articulators (DIVA) model (Saltzman and Munhall, 1989; Guenther et al., 2006; Hickok et al., 2011). DIVA, in particular, hypothesizes that gestures are encoded in M1v. These results also suggest that models not incorporating gestures, instead proposing that phonemes are the immediate output from motor cortex to brainstem motor nuclei, may be incomplete (Levelt, 1999; Levelt et al., 1999; Hickok, 2012b).
The phenomenon of coarticulation (i.e., phoneme production is affected by planning and production of neighboring phonemes) has long been established using kinematic, physiologic (EMG), and acoustic methods (Ohman, 1966; Kent and Minifie, 1977; Whalen, 1990; Magen, 1997; Denby et al., 2010; Schultz and Wand, 2010). Our results showing the discrimination of intraword phoneme position and differences in allophone encoding confirm the existence of phoneme coarticulation in cortical activity as well. Bouchard and Chang (2014) first demonstrated evidence of PCG representation of coarticulation during vowel production. Our results demonstrate cortical representation of coarticulation during consonant production. Some have suggested that coarticulation can be explained by the different gestures that are used when phonemes are in different contexts (Browman and Goldstein, 1992; Buchwald, 2014). Since gestures can be thought of as a rough estimate of articulator movements, our results demonstrating gesture encoding corroborate the findings of a recent study (Conant et al., 2018) of isolated vowel production showing that PCG encodes the kinematics of articulators to a greater extent than the acoustic outputs.
The use of allophones enabled us to dissociate the correlation between phonemes and gestures, as a single consonant phoneme is produced differently in the different allophones. In pPCG, the CClAs did not behave like either the VLC phonemes or VC phonemes, though they were more similar to the VC phonemes. This suggests that the CClAs are produced differently than either VCs or VLCs. It is also possible that there may have been some features in the CClAs that were related to /s/ production, in the time from 300 to 200 ms before plosive onset, that affected the results. Overall, these results support the following previous findings: before the release of the laryngeal constriction, the CClAs are hypothesized to be associated with a laryngeal gesture that is absent in VC phonemes (Browman and Goldstein, 1992; Cho et al., 2014). Thus, it is not surprising that we observed this difference in classification between CClAs and VCs (Fig. 5D). These results, therefore, still support a gestural representation in M1v as well as in PMv and IFG.
This study provides a deeper look into IFG activity during speech production. The role of IFG in speech production to date has been unclear. Classically, based on lesion studies and electrical stimulation, the neural control of speech production was described as starting in the inferior frontal gyrus, with low-level, nonspeech movements elicited in M1v (Broca, 1861; Penfield and Rasmussen, 1949). The classical view that IFG was involved in word generation (Broca, 1861) has been contradicted by more recent studies. Electrical stimulation sites causing speech arrest were located almost exclusively in the ventral PCG (Tate et al., 2014). Other recent studies have provided conflicting imaging evidence in IFG of phoneme production (Wise et al., 1999), syllables (Indefrey and Levelt, 2004), and syllable-to-phoneme sequencing and timing (Gelfand and Bookheimer, 2003; Papoutsi et al., 2009; Flinker et al., 2015; Flinker and Knight, 2016; Long et al., 2016). Flinker et al. (2015) showed that IFG was involved in articulatory sequencing. The equal classification performance for gestures and phonemes using IFG activity suggests that there is at least some information in IFG related to gesture production. While our results cannot completely address the function of IFG due to somewhat limited electrode coverage (mainly pars opercularis) and experimental design (monosyllabic words likely limited IFG activation and classification performance somewhat), they do provide evidence for gesture representation in IFG.
These results imply that speech production cortices share a similar organization to limb-related motor cortices, despite clear differences between the neuroanatomy of articulator and limb innervation (e.g., cranial nerve compared with spinal cord innervation). In this analogy, gestures represent articulator positions at discrete times (Guenther et al., 2006), while phonemes can be considered speech targets. Premotor and posterior parietal cortices preferentially encode the targets of reaching movements (Hocherman and Wise, 1991; Shen and Alexander, 1997; Pesaran et al., 2002, 2006; Hatsopoulos et al., 2004), while M1 preferentially encodes reach trajectories (Georgopoulos et al., 1986; Moran and Schwartz, 1999), force (Evarts, 1968; Scott and Kalaska, 1997; Flint et al., 2014), or muscle activity (Kakei et al., 1999; Morrow and Miller, 2003; Cherian et al., 2013; Oby et al., 2013). This suggests that M1v predominantly represents articulator kinematics and/or muscle activity; detailed measurements of articulator positions are starting to demonstrate this (Bouchard et al., 2016; Conant et al., 2018). Although we found that gesture representations predominated over phonemic representations in all three areas, there was progressively less predominance in aPCG and IFG, which could suggest a rough hierarchy of movement-related information in the cortex (although phonemic representations can also be distributed throughout the cortex (Cogan et al., 2014). We also found evidence for the encoding of gestures and phonemes in both dominant and nondominant hemispheres, which corroborates prior evidence of bilateral encoding of sublexical speech production (Bouchard et al., 2013; Cogan et al., 2014). The homology with limb motor areas is perhaps not surprising, since Broca's area is thought to be homologous to premotor areas in apes (Mendoza and Merchant, 2014). This analogous organization suggests that observations from studies of limb motor control may be extrapolated to other parts of motor and premotor cortices.
As in limb movements, sensory feedback is important in speech production (Hickok, 2012a). However, it is unlikely that auditory or somatosensory feedback accounts for the relative representations of gestures and phonemes observed here. Motor cortical activity during listening is organized based on acoustics, rather than on articulators (Cheung et al., 2016); thus, any effect of auditory feedback would be to improve phoneme performance. The contribution of somatosensory feedback to activity should be limited by the very short amount of time after events included in location and allophone analyses. Overall, consistent findings across multiple types of analyses strongly favor gestural predominance. Possible sensory contributions to speech production representations is an important area for future research.
Brain–machine interfaces (BMIs) could substantially improve the quality of life of individuals who are paralyzed from neurological disorders. Just as understanding the cortical control of limb movements has led to advances in motor BMIs, a better understanding of the cortical control of speech will likely improve the ability to decode speech directly from the motor cortex. A speech BMI that could directly decode attempted speech would be more efficient than, and could dramatically increase the communication rate over, current slow and often tedious methods for this patient population (e.g., eye trackers, gaze communication boards, and even the most recent spelling-based BMIs; Brumberg et al., 2010; Chen et al., 2015; Pandarinath et al., 2017). Although we can use ECoG to identify words via phonemes (Mugler et al., 2014b), these results suggest that gestural decoding would outperform phoneme decoding in BMIs using M1v/PMv activity. The decoding techniques used here would require modification for closed-loop implementation, although signatures related to phoneme production have been used for real-time control of simple speech sound-based BMIs (Leuthardt et al., 2011; Brumberg et al., 2013). Also, the analysis of preparatory (premotor) neural activity of speech production, which our study was not designed to examine, would be important to investigate for speech BMI control. Overall, improving our understanding of the cortical control of articulatory movements advances us toward viable BMIs that can decode intended speech movements in real time.
Understanding the cortical encoding of sublexical speech production could also improve the identification of functional speech motor areas. More rapid and/or accurate identification of these areas using ECoG could help to make surgeries for epilepsy or brain tumors more efficient, and possibly safer, by reducing operative time and the number of stimuli and better defining areas to avoid resecting (Schalk et al., 2008; Roland et al., 2010; Korostenskaja et al., 2014). These results therefore guide future investigations into the development of neurotechnology for speech communication and functional mapping.
Footnotes
This work was supported in part by the Doris Duke Charitable Foundation (Clinical Scientist Development Award, Grant #2011039), a Northwestern Memorial Foundation Dixon Translational Research Award (including partial funding from National Institutes of Health (NIH)/National Center for Advancing Translational Sciences Grants UL1-TR-000150 and UL1-TR-001422), NIH Grants F32-DC-015708 and R01-NS-094748, and National Science Foundation Grant #1321015. We thank Robert D. Flint, Griffin Milsap, Weiran Wang, our EEG technologists, and our participants.
We declare no competing financial interests.
References
- Bakovic E. (2014) Phonology and phonological theory. In: The Oxford handbook of language production (Goldrick MA, Ferreira V, Miozzo M, eds), pp 199–209. Oxford: Oxford UP. [Google Scholar]
- Ballard KJ, Granier JP, Robin DA (2000) Understanding the nature of apraxia of speech: theory, analysis, and treatment. Aphasiology 14:969–995. 10.1080/02687030050156575 [DOI] [Google Scholar]
- Bocquelet F, Hueber T, Girin L, Savariaux C, Yvert B (2016) Real-time control of an articulatory-based speech synthesizer for brain computer interfaces. PLoS Comput Biol 12:e1005119. 10.1371/journal.pcbi.1005119 [DOI] [PMC free article] [PubMed] [Google Scholar]
- Bouchard KE, Chang EF (2014) Control of spoken vowel acoustics and the influence of phonetic context in human speech sensorimotor cortex. J Neurosci 34:12662–12677. 10.1523/JNEUROSCI.1219-14.2014 [DOI] [PMC free article] [PubMed] [Google Scholar]
- Bouchard KE, Mesgarani N, Johnson K, Chang EF (2013) Functional organization of human sensorimotor cortex for speech articulation. Nature 495:327–332. 10.1038/nature11911 [DOI] [PMC free article] [PubMed] [Google Scholar]
- Bouchard KE, Conant DF, Anumanchipalli GK, Dichter B, Chaisanguanthum KS, Johnson K, Chang EF (2016) High-resolution, non-invasive imaging of upper vocal tract articulators compatible with human brain recordings. PLoS One 11:e0151327. 10.1371/journal.pone.0151327 [DOI] [PMC free article] [PubMed] [Google Scholar]
- Broca P. (1861) Remarques sur le siège de la faculté du langage articule suivies d'une observation d'aphemie. Bull Soc Anat Paris 6:330–357. [Google Scholar]
- Browman CP, Goldstein L (1992) Articulatory phonology: an overview. Phonetica 49:155–180. 10.1159/000261913 [DOI] [PubMed] [Google Scholar]
- Brumberg JS, Nieto-Castanon A, Kennedy PR, Guenther FH (2010) Brain–computer interfaces for speech communication. Speech Commun 52:367–379. 10.1016/j.specom.2010.01.001 [DOI] [PMC free article] [PubMed] [Google Scholar]
- Brumberg JS, Guenther FH, Kennedy PR (2013) An auditory output brain–computer interface for speech communication. In: Brain–computer interface research: SpringerBriefs in electrical and computer engineering (Guger C, Allison BZ, Edlinger G, eds), pp 7–14. New York: Springer. [Google Scholar]
- Buchwald A. (2014) Phonetic processing. In: The Oxford handbook of language production (Goldrick MA, Ferreira V, Miozzo M, eds), pp 245–258. New York: Oxford UP. [Google Scholar]
- Buchwald A, Miozzo M (2011) Finding levels of abstraction in speech production: evidence from sound-production impairment. Psychol Sci 22:1113–1119. 10.1177/0956797611417723 [DOI] [PubMed] [Google Scholar]
- Carey D, McGettigan C (2017) Magnetic resonance imaging of the brain and vocal tract: applications to the study of speech production and language learning. Neuropsychologia 98:201–211. 10.1016/j.neuropsychologia.2016.06.003 [DOI] [PubMed] [Google Scholar]
- Chao ZC, Nagasaka Y, Fujii N (2010) Long-term asynchronous decoding of arm motion using electrocorticographic signals in monkeys. Front Neuroeng 3:3. 10.3389/fneng.2010.00003 [DOI] [PMC free article] [PubMed] [Google Scholar]
- Chen X, Wang Y, Nakanishi M, Gao X, Jung TP, Gao S (2015) High-speed spelling with a noninvasive brain–computer interface. Proc Natl Acad Sci U S A 112:E6058–E6067. 10.1073/pnas.1508080112 [DOI] [PMC free article] [PubMed] [Google Scholar]
- Cherian A, Fernandes HL, Miller LE (2013) Primary motor cortical discharge during force field adaptation reflects muscle-like dynamics. J Neurophysiol 110:768–783. 10.1152/jn.00109.2012 [DOI] [PMC free article] [PubMed] [Google Scholar]
- Cheung C, Hamiton LS, Johnson K, Chang EF (2016) The auditory representation of speech sounds in human motor cortex. Elife 5:e12577. 10.7554/eLife.12577 [DOI] [PMC free article] [PubMed] [Google Scholar]
- Cho T, Lee Y, Kim S (2014) Prosodic strengthening on the/s/-stop cluster and the phonetic implementation of an allophonic rule in English. J Phon 46:128–146. 10.1016/j.wocn.2014.06.003 [DOI] [Google Scholar]
- Cogan GB, Thesen T, Carlson C, Doyle W, Devinsky O, Pesaran B (2014) Sensory-motor transformations for speech occur bilaterally. Nature 507:94–98. 10.1038/nature12935 [DOI] [PMC free article] [PubMed] [Google Scholar]
- Conant DF, Bouchard KE, Leonard MK, Chang EF (2018) Human sensorimotor cortex control of directly measured vocal tract movements during vowel production. J Neurosci 38:2955–2966. 10.1523/JNEUROSCI.2382-17.2018 [DOI] [PMC free article] [PubMed] [Google Scholar]
- Crone NE, Hao L, Hart J Jr, Boatman D, Lesser RP, Irizarry R, Gordon B (2001) Electrocorticographic gamma activity during word production in spoken and sign language. Neurology 57:2045–2053. 10.1212/WNL.57.11.2045 [DOI] [PubMed] [Google Scholar]
- Das K, Nenadic Z (2009) An efficient discriminant-based solution for small sample size problem. Pattern Recognit 42:857–866. 10.1016/j.patcog.2008.08.036 [DOI] [Google Scholar]
- Das K, Rizzuto DS, Nenadic Z (2009) Mental state estimation for brain–computer interfaces. IEEE Trans Biomed Eng 56:2114–2122. 10.1109/TBME.2009.2022948 [DOI] [PubMed] [Google Scholar]
- Denby B, Schultz T, Honda K, Hueber T, Gilbert JM, Brumberg JS (2010) Silent speech interfaces. Speech Commun 52:270–287. 10.1016/j.specom.2009.08.002 [DOI] [Google Scholar]
- Evarts EV. (1968) Relation of pyramidal tract activity to force exerted during voluntary movement. J Neurophysiol 31:14–27. 10.1152/jn.1968.31.1.14 [DOI] [PubMed] [Google Scholar]
- Fesl G, Moriggl B, Schmid UD, Naidich TP, Herholz K, Yousry TA (2003) Inferior central sulcus: variations of anatomy and function on the example of the motor tongue area. Neuroimage 20:601–610. 10.1016/S1053-8119(03)00299-4 [DOI] [PubMed] [Google Scholar]
- Flinker A, Knight RT (2016) A cool approach to probing speech cortex. Neuron 89:1123–1125. 10.1016/j.neuron.2016.02.039 [DOI] [PMC free article] [PubMed] [Google Scholar]
- Flinker A, Korzeniewska A, Shestyuk AY, Franaszczuk PJ, Dronkers NF, Knight RT, Crone NE (2015) Redefining the role of Broca's area in speech. Proc Natl Acad Sci U S A 112:2871–2875. 10.1073/pnas.1414491112 [DOI] [PMC free article] [PubMed] [Google Scholar]
- Flint RD, Ethier C, Oby ER, Miller LE, Slutzky MW (2012a) Local field potentials allow accurate decoding of muscle activity. J Neurophysiol 108:18–24. 10.1152/jn.00832.2011 [DOI] [PMC free article] [PubMed] [Google Scholar]
- Flint RD, Lindberg EW, Jordan LR, Miller LE, Slutzky MW (2012b) Accurate decoding of reaching movements from field potentials in the absence of spikes. J Neural Eng 9:046006. 10.1088/1741-2560/9/4/046006 [DOI] [PMC free article] [PubMed] [Google Scholar]
- Flint RD, Wang PT, Wright ZA, King CE, Krucoff MO, Schuele SU, Rosenow JM, Hsu FP, Liu CY, Lin JJ, Sazgar M, Millett DE, Shaw SJ, Nenadic Z, Do AH, Slutzky MW (2014) Extracting kinetic information from human motor cortical signals. Neuroimage 101:695–703. 10.1016/j.neuroimage.2014.07.049 [DOI] [PMC free article] [PubMed] [Google Scholar]
- Flint RD, Rosenow JM, Tate MC, Slutzky MW (2017) Continuous decoding of human grasp kinematics using epidural and subdural signals. J Neural Eng 14:016005. 10.1088/1741-2560/14/1/016005 [DOI] [PMC free article] [PubMed] [Google Scholar]
- Gelfand JR, Bookheimer SY (2003) Dissociating neural mechanisms of temporal sequencing and processing phonemes. Neuron 38:831–842. 10.1016/S0896-6273(03)00285-X [DOI] [PubMed] [Google Scholar]
- Georgopoulos AP, Schwartz AB, Kettner RE (1986) Neuronal population coding of movement direction. Science 233:1416–1419. 10.1126/science.3749885 [DOI] [PubMed] [Google Scholar]
- Ghosh SS, Tourville JA, Guenther FH (2008) A neuroimaging study of premotor lateralization and cerebellar involvement in the production of phonemes and syllables. J Speech Lang Hear Res 51:1183–1202. 10.1044/1092-4388(2008/07-0119) [DOI] [PMC free article] [PubMed] [Google Scholar]
- Guenther FH, Ghosh SS, Tourville JA (2006) Neural modeling and imaging of the cortical interactions underlying syllable production. Brain Lang 96:280–301. 10.1016/j.bandl.2005.06.001 [DOI] [PMC free article] [PubMed] [Google Scholar]
- Hatsopoulos N, Joshi J, O'Leary JG (2004) Decoding continuous and discrete motor behaviors using motor and premotor cortical ensembles. J Neurophysiol 92:1165–1174. 10.1152/jn.01245.2003 [DOI] [PubMed] [Google Scholar]
- Herff C, Heger D, de Pesters A, Telaar D, Brunner P, Schalk G, Schultz T (2015) Brain-to-text: decoding spoken phrases from phone representations in the brain. Front Neurosci 9:217. 10.3389/fnins.2015.00217 [DOI] [PMC free article] [PubMed] [Google Scholar]
- Hermes D, Miller KJ, Noordmans HJ, Vansteensel MJ, Ramsey NF (2010) Automated electrocorticographic electrode localization on individually rendered brain surfaces. J Neurosci Methods 185:293–298. 10.1016/j.jneumeth.2009.10.005 [DOI] [PubMed] [Google Scholar]
- Hermes D, Miller KJ, Vansteensel MJ, Aarnoutse EJ, Leijten FS, Ramsey NF (2012) Neurophysiologic correlates of fMRI in human motor cortex. Hum Brain Mapp 33:1689–1699. 10.1002/hbm.21314 [DOI] [PMC free article] [PubMed] [Google Scholar]
- Hickok G. (2012a) The cortical organization of speech processing: feedback control and predictive coding the context of a dual-stream model. J Commun Disord 45:393–402. 10.1016/j.jcomdis.2012.06.004 [DOI] [PMC free article] [PubMed] [Google Scholar]
- Hickok G. (2012b) Computational neuroanatomy of speech production. Nat Rev Neurosci 13:135–145. 10.1038/nrn3158 [DOI] [PMC free article] [PubMed] [Google Scholar]
- Hickok G, Houde J, Rong F (2011) Sensorimotor integration in speech processing: computational basis and neural organization. Neuron 69:407–422. 10.1016/j.neuron.2011.01.019 [DOI] [PMC free article] [PubMed] [Google Scholar]
- Hocherman S, Wise SP (1991) Effects of hand movement path on motor cortical activity in awake, behaving rhesus monkeys. Exp Brain Res 83:285–302. [DOI] [PubMed] [Google Scholar]
- House AS, Williams C, Hecker MHL, Kryter KD (1963) Psychoacoustic speech tests: a modified rhyme test. J Acoust Soc Am 35:55 10.1121/1.2142744 [DOI] [PubMed] [Google Scholar]
- Indefrey P, Levelt WJ (2004) The spatial and temporal signatures of word production components. Cognition 92:101–144. 10.1016/j.cognition.2002.06.001 [DOI] [PubMed] [Google Scholar]
- Kakei S, Hoffman DS, Strick PL (1999) Muscle and movement representations in the primary motor cortex. Science 285:2136–2139. 10.1126/science.285.5436.2136 [DOI] [PubMed] [Google Scholar]
- Kellis S, Miller K, Thomson K, Brown R, House P, Greger B (2010) Decoding spoken words using local field potentials recorded from the cortical surface. J Neural Eng 7:056007. 10.1088/1741-2560/7/5/056007 [DOI] [PMC free article] [PubMed] [Google Scholar]
- Kent R, Minifie F (1977) Coarticulation in recent speech production. J Phon 5:115–133. [Google Scholar]
- Korostenskaja M, Wilson AJ, Rose DF, Brunner P, Schalk G, Leach J, Mangano FT, Fujiwara H, Rozhkov L, Harris E, Chen P-C, Seo JH, Lee KH (2014) Real-time functional mapping with electrocorticography in pediatric epilepsy: comparison with FMRI and ESM findings. Clin EEG Neurosci 45:205–211. 10.1177/1550059413492960 [DOI] [PMC free article] [PubMed] [Google Scholar]
- Leuthardt EC, Gaona C, Sharma M, Szrama N, Roland J, Freudenberg Z, Solis J, Breshears J, Schalk G (2011) Using the electrocorticographic speech network to control a brain–computer interface in humans. J Neural Eng 8:036004. 10.1088/1741-2560/8/3/036004 [DOI] [PMC free article] [PubMed] [Google Scholar]
- Levelt WJ. (1999) Models of word production. Trends Cogn Sci 3:223–232. 10.1016/S1364-6613(99)01319-4 [DOI] [PubMed] [Google Scholar]
- Levelt WJ, Roelofs A, Meyer AS (1999) A theory of lexical access in speech production. Behav Brain Sci 22:1–38. [DOI] [PubMed] [Google Scholar]
- Logothetis NK, Pauls J, Augath M, Trinath T, Oeltermann A (2001) Neurophysiological investigation of the basis of the fMRI signal. Nature 412:150–157. 10.1038/35084005 [DOI] [PubMed] [Google Scholar]
- Long MA, Katlowitz KA, Svirsky MA, Clary RC, Byun TM, Majaj N, Oya H, Howard MA 3rd, Greenlee JDW (2016) Functional segregation of cortical regions underlying speech timing and articulation. Neuron 89:1187–1193. 10.1016/j.neuron.2016.01.032 [DOI] [PMC free article] [PubMed] [Google Scholar]
- Lotte F, Brumberg JS, Brunner P, Gunduz A, Ritaccio AL, Guan C, Schalk G (2015) Electrocorticographic representations of segmental features in continuous speech. Front Hum Neurosci 9:97. 10.3389/fnhum.2015.00097 [DOI] [PMC free article] [PubMed] [Google Scholar]
- Magen HS. (1997) The extent of vowel-to-vowel coarticulation in english. J Phon 25:187–205. 10.1006/jpho.1996.0041 [DOI] [Google Scholar]
- Marianne P, Goldstein L (2010) Intention in articulation: articulatory timing in alternating consonant sequences and its implications for models of speech production. Lang Cogn Process 25:616–649. 10.1080/01690960903395380 [DOI] [PMC free article] [PubMed] [Google Scholar]
- Mehring C, Nawrot MP, de Oliveira SC, Vaadia E, Schulze-Bonhage A, Aertsen A, Ball T (2004) Comparing information about arm movement direction in single channels of local and epicortical field potentials from monkey and human motor cortex. J Physiol Paris 98:498–506. 10.1016/j.jphysparis.2005.09.016 [DOI] [PubMed] [Google Scholar]
- Mendoza G, Merchant H (2014) Motor system evolution and the emergence of high cognitive functions. Prog Neurobiol 122:73–93. 10.1016/j.pneurobio.2014.09.001 [DOI] [PubMed] [Google Scholar]
- Mines MA, Hanson BF, Shoup JE (1978) Frequency of occurrence of phonemes in conversational english. Lang Speech 21:221–241. 10.1177/002383097802100302 [DOI] [PubMed] [Google Scholar]
- Moran DW, Schwartz AB (1999) Motor cortical representation of speed and direction during reaching. J Neurophysiol 82:2676–2692. 10.1152/jn.1999.82.5.2676 [DOI] [PubMed] [Google Scholar]
- Morrow MM, Miller LE (2003) Prediction of muscle activity by populations of sequentially recorded primary motor cortex neurons. J Neurophysiol 89:2279–2288. 10.1152/jn.00632.2002 [DOI] [PMC free article] [PubMed] [Google Scholar]
- Mugler EM, Goldrick M, Slutzky MW (2014a) Cortical encoding of phonemic context during word production. Paper presented at the 2014 36th Annual International Conference of the IEEE Engineering in Medicine and Biology Society, Chicago, IL, August. [DOI] [PubMed] [Google Scholar]
- Mugler EM, Patton JL, Flint RD, Wright ZA, Schuele SU, Rosenow J, Shih JJ, Krusienski DJ, Slutzky MW (2014b) Direct classification of all american english phonemes using signals from functional speech motor cortex. J Neural Eng 11:035015. 10.1088/1741-2560/11/3/035015 [DOI] [PMC free article] [PubMed] [Google Scholar]
- Nam H, Mitra V, Tiede MK, Saltzman E, Goldstein L, Espy-Wilson C, Hasegawa-Johnson M (2012) A procedure for estimating gestural scores from articulatory data. J Acoust Soc Am 132:3980–3989. 10.1121/1.4763545 [DOI] [PMC free article] [PubMed] [Google Scholar]
- Oby ER, Ethier C, Miller LE (2013) Movement representation in the primary motor cortex and its contribution to generalizable EMG predictions. J Neurophysiol 109:666–678. 10.1152/jn.00331.2012 [DOI] [PMC free article] [PubMed] [Google Scholar]
- Ohman SE. (1966) Coarticulation in VCV utterances: spectrographic measurements. J Acoust Soc Am 39:151–168. 10.1121/1.1909864 [DOI] [PubMed] [Google Scholar]
- Pandarinath C, Nuyujukian P, Blabe CH, Sorice BL, Saab J, Willett FR, Hochberg LR, Shenoy KV, Henderson JM (2017) High performance communication by people with paralysis using an intracortical brain–computer interface. eLife 6:e18554. 10.7554/eLife.18554 [DOI] [PMC free article] [PubMed] [Google Scholar]
- Papoutsi M, de Zwart JA, Jansma JM, Pickering MJ, Bednar JA, Horwitz B (2009) From phonemes to articulatory codes: an fMRI study of the role of broca's area in speech production. Cereb Cortex 19:2156–2165. 10.1093/cercor/bhn239 [DOI] [PMC free article] [PubMed] [Google Scholar]
- Paz R, Boraud T, Natan C, Bergman H, Vaadia E (2003) Preparatory activity in motor cortex reflects learning of local visuomotor skills. Nat Neurosci 6:882–890. 10.1038/nn1097 [DOI] [PubMed] [Google Scholar]
- Pei X, Barbour DL, Leuthardt EC, Schalk G (2011a) Decoding vowels and consonants in spoken and imagined words using electrocorticographic signals in humans. J Neural Eng 8:046028. 10.1088/1741-2560/8/4/046028 [DOI] [PMC free article] [PubMed] [Google Scholar]
- Pei X, Leuthardt EC, Gaona CM, Brunner P, Wolpaw JR, Schalk G (2011b) Spatiotemporal dynamics of electrocorticographic high gamma activity during overt and covert word repetition. Neuroimage 54:2960–2972. 10.1016/j.neuroimage.2010.10.029 [DOI] [PMC free article] [PubMed] [Google Scholar]
- Penfield W, Boldrey E (1937) Somatic motor and sensory representation in the cerebral cortex of man as studied by electrical stimulation. Brain 60:389–443. 10.1093/brain/60.4.389 [DOI] [Google Scholar]
- Penfield W, Rasmussen T (1949) Vocalization and arrest of speech. Arch Neurol Psychiatry 61:21–27. 10.1001/archneurpsyc.1949.02310070027002 [DOI] [PubMed] [Google Scholar]
- Penfield W, Roberts L (1959) Speech and brain mechanisms. Princeton: Princeton UP. [Google Scholar]
- Pesaran B, Pezaris JS, Sahani M, Mitra PP, Andersen RA (2002) Temporal structure in neuronal activity during working memory in macaque parietal cortex. Nat Neurosci 5:805–811. 10.1038/nn890 [DOI] [PubMed] [Google Scholar]
- Pesaran B, Nelson MJ, Andersen RA (2006) Dorsal premotor neurons encode the relative position of the hand, eye, and goal during reach planning. Neuron 51:125–134. 10.1016/j.neuron.2006.05.025 [DOI] [PMC free article] [PubMed] [Google Scholar]
- Ramsey NF, Salari E, Aarnoutse EJ, Vansteensel MJ, Bleichner MG, Freudenburg ZV (2018) Decoding spoken phonemes from sensorimotor cortex with high-density ECoG grids. Neuroimage 180:301–311. 10.1016/j.neuroimage.2017.10.011 [DOI] [PMC free article] [PubMed] [Google Scholar]
- Ray S, Maunsell JH (2011) Different origins of gamma rhythm and high-gamma activity in macaque visual cortex. PLoS Biol 9:e1000610. 10.1371/journal.pbio.1000610 [DOI] [PMC free article] [PubMed] [Google Scholar]
- Ray S, Crone NE, Niebur E, Franaszczuk PJ, Hsiao SS (2008) Neural correlates of high-gamma oscillations (60–200 Hz) in macaque local field potentials and their potential implications in electrocorticography. J Neurosci 28:11526–11536. 10.1523/JNEUROSCI.2848-08.2008 [DOI] [PMC free article] [PubMed] [Google Scholar]
- Riecker A, Ackermann H, Wildgruber D, Meyer J, Dogil G, Haider H, Grodd W (2000) Articulatory/phonetic sequencing at the level of the anterior perisylvian cortex: a functional magnetic resonance imaging (fMRI) study. Brain Lang 75:259–276. 10.1006/brln.2000.2356 [DOI] [PubMed] [Google Scholar]
- Roland J, Brunner P, Johnston J, Schalk G, Leuthardt EC (2010) Passive real-time identification of speech and motor cortex during an awake craniotomy. Epilepsy Behav 18:123–128. 10.1016/j.yebeh.2010.02.017 [DOI] [PubMed] [Google Scholar]
- Saltzman EL, Munhall KG (1989) A dynamical approach to gestural patterning in speech production. Ecol Psychol 1:333–382. 10.1207/s15326969eco0104_2 [DOI] [Google Scholar]
- Schalk G, McFarland DJ, Hinterberger T, Birbaumer N, Wolpaw JR (2004) BCI2000: a general-purpose brain–computer interface (BCI) system. IEEE Trans Biomed Eng 51:1034–1043. 10.1109/TBME.2004.827072 [DOI] [PubMed] [Google Scholar]
- Schalk G, Leuthardt EC, Brunner P, Ojemann JG, Gerhardt LA, Wolpaw JR (2008) Real-time detection of event-related brain activity. Neuroimage 43:245–249. 10.1016/j.neuroimage.2008.07.037 [DOI] [PMC free article] [PubMed] [Google Scholar]
- Schultz T, Wand M (2010) Modeling coarticulation in EMG-based continuous speech recognition. Speech Commun 52:341–353. 10.1016/j.specom.2009.12.002 [DOI] [Google Scholar]
- Scott SH, Kalaska JF (1997) Reaching movements with similar hand paths but different arm orientations. I. Activity of individual cells in motor cortex. J Neurophysiol 77:826–852. 10.1152/jn.1997.77.2.826 [DOI] [PubMed] [Google Scholar]
- Shen L, Alexander GE (1997) Preferential representation of instructed target location versus limb trajectory in dorsal premotor area. J Neurophysiol 77:1195–1212. 10.1152/jn.1997.77.3.1195 [DOI] [PubMed] [Google Scholar]
- Slutzky MW. (2018) Brain–machine interfaces: powerful tools for clinical treatment and neuroscientific investigations. Neuroscientist. Advance online publication. Retrieved September 17, 2018. doi: 10.1177/1073858418775355. [DOI] [PMC free article] [PubMed] [Google Scholar]
- Slutzky MW, Jordan LR, Lindberg EW, Lindsay KE, Miller LE (2011) Decoding the rat forelimb movement direction from epidural and intracortical field potentials. J Neural Eng 8:036013. 10.1088/1741-2560/8/3/036013 [DOI] [PMC free article] [PubMed] [Google Scholar]
- Tate MC, Herbet G, Moritz-Gasser S, Tate JE, Duffau H (2014) Probabilistic map of critical functional regions of the human cerebral cortex: Broca's area revisited. Brain 137:2773–2782. 10.1093/brain/awu168 [DOI] [PubMed] [Google Scholar]
- Tourville JA, Reilly KJ, Guenther FH (2008) Neural mechanisms underlying auditory feedback control of speech. Neuroimage 39:1429–1443. 10.1016/j.neuroimage.2007.09.054 [DOI] [PMC free article] [PubMed] [Google Scholar]
- Wang WR, Arora R, Livescu K (2014) Reconstruction of articulatory measurements with smoothed low-rank matrix completion. Paper presented at 2014 IEEE Spoken Language Technology Workshop, South Lake Tahoe, CA, December. [Google Scholar]
- Wang W, Arora R, Livescu K, Bilmes JA (2015) Unsupervised learning of acoustic features via deep canonical correlation analysis. Paper presented at the ICASSP 2015: 40th IEEE International Conference on Acoustics, Speech and Signal Processing (ICASSP), Brisbane, QLD, Australia, April. [Google Scholar]
- Westbury J, Milenkovic P, Weismer G, Kent R (1990) X-ray microbeam speech production database. J Acoust Soc Am 88:S56–S56. [Google Scholar]
- Whalen DH. (1990) Coarticulation is largely planned. Haskins Laboratories Status Report on Speech Research SR-101/102:149–176.
- Wise RJ, Greene J, Büchel C, Scott SK (1999) Brain regions involved in articulation. Lancet 353:1057–1061. 10.1016/S0140-6736(98)07491-1 [DOI] [PubMed] [Google Scholar]
- Wise SP, Moody SL, Blomstrom KJ, Mitz AR (1998) Changes in motor cortical activity during visuomotor adaptation. Exp Brain Res 121:285–299. 10.1007/s002210050462 [DOI] [PubMed] [Google Scholar]