Abstract
Flake-shaped nanohybrids based on black phosphorus (BP) have been developed as multifunctional theranostic nanoplatforms for drug delivery, phototherapy and bioimaging. In this work, we report a facile strategy for fabrication of black phosphorus-Au nanoparticle hybrids (BP-AuNPs), which reveal extraordinary near-infrared (NIR) photothermal transduction efficiency and drug delivery capacity. The applications of the nanocomposites as therapeutic agents for high-performance chemo-photothermal tumor therapy are accomplished in vitro and in vivo. BP-AuNPs also exhibit wonderful surface-enhanced Raman scattering (SERS) activity under NIR laser excitation with a low Raman background, allowing BP-AuNPs as promising two-dimensional (2D) fingerprint nanoprobe for bio-SERS analysis. The cellular component identification and label-free live-cell bioimaging based on this type of 2D SERS substrate are generally investigated, which open up promising new perspectives in nanomedicine, including diagnosis, imaging and therapy.
Introduction
Black phosphorus (BP), a new member of the family of two-dimensional (2D) nanomaterials, has been discovered to be an interesting alternative to graphene owing to its p-type semiconducting properties.1 Similar to graphene, few-layered BP nanosheets can be acquired via facile mechanical exfoliation from the bulk crystal, which can be easily achieved in practice.2 Despite being at the budding stage, several profound breakthroughs have been achieved in the biomedical applications of BP nanostructures in view of their excellent physicochemical features and biocompatibility.3–14 BP displays nice near-infrared (NIR) absorption and high photothermal conversion efficiency that allows efficient NIR photothermal cancer therapy and photoacoustic bioimaging.6–8 BP nanosheets can also serve as novel nanocarrier and photosensitizer with efficient generation of singlet oxygen for chemotherapy and photodynamic therapy.11–14 The latest efforts aim to exploit the multimodal bioapplications of BP-based nanomaterials, via integrating the imaging modality and the therapeutic pattern into one nanosystem.15–19 On the other hand, 2D nanomaterials have been considered as the burgeoning supports for nanoparticles, thereby forming layered hybrid nanostructures which can offer improved physicochemical properties for versatile bioapplications.20 So far, only a sparse body of literature has revealed the combination of metal nanoparticles with BP nanosheets, which has been proven to have enhanced theranostic potentials for photothermal, photodynamic and sonodynamic therapy, as well as magnetic resonance imaging.21, 22
In terms of the optical biosensing applications, fluorescence-based technique based on the fluorescence resonance energy transfer between 2D nanomaterial and the exogenous fluorophore is commonly adopted for biomarker detection, intracellular tracking and pathological diagnosis. In the case of biomass labeling, 2D nanoprobe can remarkably improve the binding affinity between ligand and receptor, thus achieving higher diagnostic efficiency to clinical specimens.23 However, this method is deemed to be indirect owing to its dependence to external optical features, while identification through utilization of the intrinsic characteristics of biological samples is rare. This issue may be tackled by the surface-enhanced Raman scattering (SERS) spectroscopy, a label-free analytical approach that can provide the firsthand molecular fingerprint information for physiological or pathological discrimination.24 2D material-noble metal nanocomposites are promising SERS substrates due to their excellent SERS activities, which can be mainly attributed to the electromagnetic enhancement originating from the abundant “hot spots” located in the interstices among the fixed metallic nanoparticles and additional chemical enhancement derived from the charge transfer between 2D sheet and the analyte.25, 26 The surface enrichment of molecules on the 2D sheet through π-π stacking or electrostatic interaction may also contributes to the intense SERS signals.27 However, the application of current graphene oxide (GO)-based SERS substrates is often limited for their intense background signals in the fingerprint region of biosamples (600–1800 cm−1).28 While the intrinsic features of BP nanosheet are all situated below 500 cm−1, which makes BP a promising substrate alternative for bio-SERS analysis.29
Herein, a 2D SERS probe based on BP nanosheet is fabricated for directly exploring the fingerprint information of cancer cells. A facile one-pot method is adopted to synthesize black phosphorus-Au nanoparticle hybrids (BP-AuNPs), in which BP itself serves as the reductant for the in situ chemical reduction of gold salts on BP sheets (Scheme 1). The obtained BP-AuNPs exhibit outstanding bio-SERS activity benefiting from the multiple Raman enhancement effects and low inherent background. These features endow BP-AuNPs with the capability for cellular component identification as well as label-free live-cell bioimaging without any exogenous signals. The nanocomposites also exhibit superior NIR photothermal transduction efficiency and drug delivery performance, which can act as a novel theranostic agent for chemo-photothermal tumor therapy.
Scheme 1.
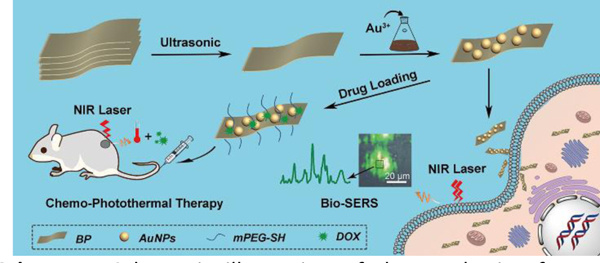
Schematic illustration of the synthesis of BP-Au nanocomposites and their theranostic applications.
Results and Discussion
Characterization of nanostructures
The BP sheets were prepared by liquid exfoliation of bulk crystals according to the literature with some modification.6 The transmission electron microscopy (TEM) image of the BP sheets (Fig. 1a) and the corresponding selected-area electron diffraction (SAED) pattern reveal the typical lamellar structure and crystalline nature of phosphorene. The lateral length of BP nanosheets after stripping is calculated to be 308±168 nm (Fig. S1†). The crystal structure of BP was further confirmed by X-ray diffraction (XRD) analysis, which indicated an orthorhombic structure of black phosphorus (Fig. 1h).10, 15 The element composition of BP was detected by an energy-dispersive x-ray (EDX) spectrometer. Besides the vast majority of elemental P, we can also observe oxygen element in the EDX spectrum of BP sheets (Fig. S2†), which can be ascribed to the oxidation of BP during the preparation and preservation processes.30
Fig. 1.
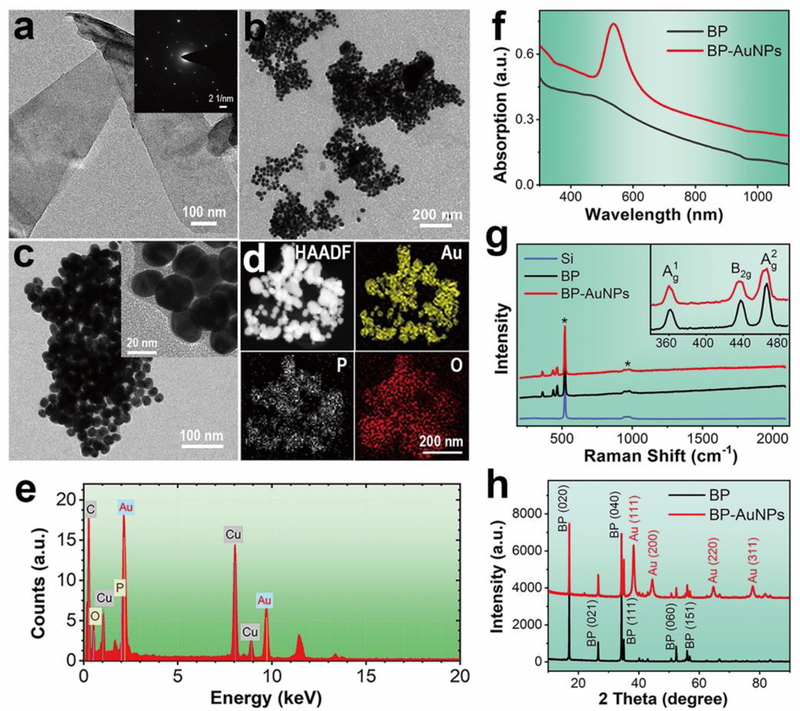
a) TEM image of the BP sheets with corresponding SAED pattern (inset). b, c) TEM images of the BP-Au nanohybrids at different magnifications. d) HAADF-STEM image and corresponding elemental mapping images of BP-Au nanohybrids. e) EDX pattern of BP-Au nanocomposites. f) UV-vis-NIR absorbance spectra of the nanostructures. g) Raman spectra of the nanomaterials, which indicate negligible background signals. The peaks marked by the star (*) are stemed from the Si substrate. Inset shows the enlargement spectra of BP and BP-AuNPs. h) XRD patterns of BP nanosheets and BP-AuNPs.
BP-Au nanohybrids were synthesized easily in the presence of BP flake and gold salt, with BP acting as the sole reductant. Fig. 1b shows the morphological features of BP-Au nanocomposites conducted by TEM observation. It can be obviously observed that the surface of BP flakes is well modified by a large number of spherical AuNPs after the in situ chemical reduction, and all of the nanoparticles are confined in the range of the supports that few particles reside outside of the BP sheet, indicating the effective attachment of AuNPs onto the black phosphorus. EDX analysis demonstrates the existence of elemental phosphorus, oxygen and gold in the nanocomposites (Fig. 1e). The higher magnification TEM images of BP-AuNPs (Fig. 1c) demonstrate that the gold nanoparticles on the surface of BP sheet have the random location and heterogeneous size distribution with an average particle size of about 27 nm. The XRD pattern for BP-Au sample reveals a mixed crystal characteristic that comprises two groups of crystal lattices, BP and Au nanostructures (Fig. 1h). The surface morphology can also be investigated by the atomic force microscopy (AFM). As shown in Fig. S3†, the AFM image shows some few-layered BP sheets with relatively flat topographies, which is consistent with the data acquired from conventional liquid exfoliation method.31 After deposition of AuNPs, the thickness of the nanocomposites increases significantly and the topography becomes more undulating. Fig. 1d illustrates the high-angle annular dark field scanning transmission electron microscopy (HAADF-STEM) image of BP-Au nanohybrids and the corresponding elemental mapping images obtained by EDX spectroscopy for Au, P and O. The Au map matches well with the bright region in the HAADF-STEM image, indicating the distribution of gold nanostructures on BP nanosheet. The elemental signals of P and O originated from the BP flake are also observed, further proving the formation of the nanocomposites.
The ultraviolet-visible-near infrared (UV-vis-NIR) absorbance spectrum of BP displays a wide light absorption range from UV region to NIR region with a decreasing absorption intensity (Fig. 1f), which coincides with the spectral feature of the as-exfoliated BP nanosheets reported previously.12 The absorption spectral line of BP-AuNPs contains the absorption characteristics of the two components, the absorption peak at around 530 nm (AuNPs) and broad absorption across the NIR region (BP). Fig. 1g displays the Raman spectra of the nanostructures, where three prominent Raman bands at about 361, 437 and 466 cm−1, assigned to the one out-of-plane phonon mode (A1g) and two in-plane modes (B2g and A2g) respectively, can be observed. We can also notice an extremely low Raman background in the wavenumber range above 500 cm−1, indicating the potential of BP-AuNPs as reasonable choice for biofingerprint analysis.
Bio-SERS analysis
The SERS activity of BP-AuNPs was firstly estimated using some typical dyes as Raman reporters and citrate-stabilized AuNPs (Fig. S4†) as the control. It can be seen from Fig. S5–8† that the BP-Au nanohybrids reveal NIR-excitation-source dependent SERS performance that is remarkably enhanced compared to their component units. With the discovery of prominent SERS features, we then investigated the capabilities of BP-AuNPs for living cell analysis. Human hepatoblastoma (Hep G2) cells pre-incubated with 32 μg mL−1 gold nanostructures (elemental gold concentration) were prepared for Raman scanning via a confocal Raman microspectrometer (Renishaw, inVia) with 785 nm excitation from a semiconductor laser. The label-free Raman bioimaging was accomplished by plotting the integrated SERS signals of the cellular components from 620 to 1720 cm-1. As shown in Fig. 2a, the endocytosed gold nanostructures become visible in the brightfield images with the increase of incubation time. It can be clearly observed that the uptake of BP-AuNPs by Hep G2 cells is much faster than that of citrate-stabilized AuNPs, as the aggregates of BP-AuNPs are quite distinct under the microscope after 6 h incubation. The rapid accumulation of BP-AuNPs inside cells may be ascribed to the internalization of BP-based nanomaterials through clathrin-independent endocytosis pathways that is much different from that of gold nanoparticles.15, 32 Benefiting from the excellent SERS performance, distinguishable SERS image with defined contour is obtained from the Hep G2 cells incubated with BP-AuNPs for 6 h, and the image is closely correlated with the brightfield microscopy image. While the SERS image of cells incubated with AuNPs shows scarcely any signal at 6 h under the same scanning parameters. Along with the increased intake of AuNPs, some SERS signals appear in the Raman images of Hep G2 cells after 12 h incubation. However, only a limited number of Raman bands arising from vibrations of the cellular components can be observed, such as 833 cm−1, 1000 cm−1, 1129 cm−1, 1304 cm−1, and 1582 cm−1 (Table S1†), and the SERS intensities of these bands are relatively weak (Fig. 2b). On the other hand, the mean SERS spectra of Hep G2 cells induced by BP-AuNPs demonstrate similar spectral pattern compared to that of AuNPs, but the SERS spectra generated from BP-AuNPs display more abundant SERS peaks and significantly enhanced signal intensities than that from AuNPs (Fig. 2c). The Raman enhancement induced by BP-AuNPs is about 70 times larger than that generated from AuNPs based on the integrated SERS signals of cells at 6 h. The declined intensities of SERS signals can be spotted after the incubation of cells with BP-AuNPs for 12 h, which should be associated with the changes in the endosomal subenvironment caused by the excessive accumulation of BP-AuNPs.33 The phenomenon also occurs in different cell individuals containing BP-AuNPs with various degrees of aggregation (Fig. S9†). Moreover, we also confirmed the ability of BP-AuNPs for reliable SERS detection in the high-wavenumber region (Fig. S10†).
Fig. 2.
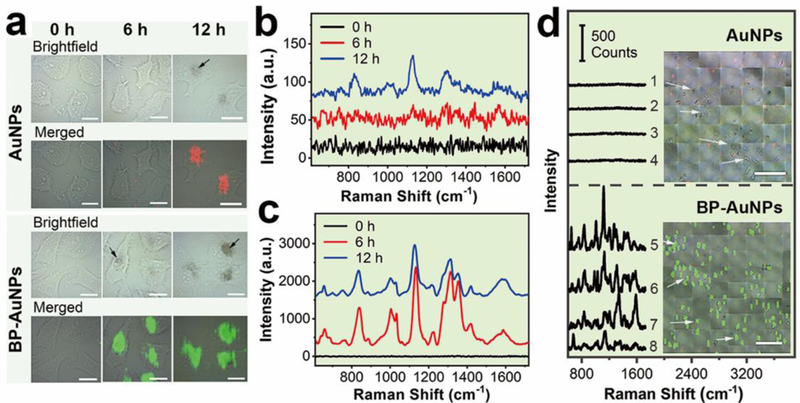
Fingerprint analysis and label-free NIR SERS imaging of living cancer cells. a) SERS imaging of Hep G2 cells incubated with AuNPs or BP-AuNPs for different times (Scale bar: 20 μm). b) and c) represent the mean SERS spectra of Hep G2 cells induced by AuNPs and BP-AuNPs, respectively. The arrows indicate the aggregates of gold nanostructures. d) Large-area ultrafast SERS imaging of Hep G2 cells using AuNPs and BP-AuNPs as the label-free SERS probes, respectively (Scale bar: 200 μm). The spectral lines show the Raman features of the spots randomly marked in the SERS images.
As we know that the Raman signals of cellular components can be easily drowned in the intrinsic Raman features of GO sheet (D and G bands) when GO-metal nanohybrids are chosen as the SERS substrates for cell analysis (Fig. S11†).28, 34 In term of this issue, BP sheet is superior to GO sheet due to its silent feature in the Raman fingerprint region. We randomly extracted four raw SERS spectral lines from a Hep G2 cell containing BP-AuNPs, as displayed in Fig. S12†. As expected, a large amount of cellular SERS signals with certain autofluorescence background but no interference from the SERS substrate are observed, suggesting the superiority of BP-AuNPs-based SERS substrates in comparison to GO-based SERS substrates. In addition, we also demonstrate spectral fluctuations among the four spectral lines, which can be undoubtedly ascribed to the heterogeneity of components in various cytoplasmic regions.35, 36
We further investigated the fast large-area SERS bioimaging using BP-AuNPs as the label-free SERS substrate. NIR Raman mapping with a lateral resolution of 9.9 μm was implemented after Hep G2 cells were co-cultured with AuNPs or BP-AuNPs (32 μg mL−1) for 12 h. Shown by Fig. 2d, the SERS signals induced by AuNPs are barely detected in the cancer cells at our experimental condition (0.19 s integration time, Streamline mode), although the gold nanoparticles are visible under the microscope. Whereas, extremely distinct SERS signals are observed in the Hep G2 cells incubated with BP-AuNPs. The overlaid image indicates that the SERS image matches well with the brightfield image of cancer cells containing BP-AuNPs. It should be noted that a very short scanning time of ~35 ms at each piexl (less than 1.5 min for one 50 × 50 image) is enough to acquire favorable Raman signals for an appropriate SERS image of cells incubated with BP-AuNPs, which is several to tens folds shorter than the acquisition time using label-free SERS mapping reported previously.37, 38 We can also notice that the Raman signals induced by BP-AuNPs are still strong, suggesting that the scanning time can be further shorten without affecting the detection on celluar level. The sensitvity of BP-AuNPs for cellular SERS analysis was further investigated, as shown in Fig. S13† and S14†. Distinct SERS signals of Hep G2 cells are still observed when the gold concentration is reduced to 3.2 μg mL−1, or when the power density of NIR laser irradiation is reduced to 0.5 mW. These data provide a foundation for using BP-AuNPs as the novel SERS nanosensor for ultrasensitive detection of biological samples.
To explore the potential of BP-AuNPs for cancer classification, in this study, Raman detection was performed on three types of tumor cells, including mouse mammary cancer (4T1) cells, human cervical carcinoma (Hela) cells and Hep G2 cells. The mean SERS spectra of these living cells are described in Fig. 3a, revealing the vibrational fingerprint features of intracellular biomolecules. We can find similar Raman spectral patterns among the three types of cells, which consist of five prominent Raman regions (780–900 cm−1, 950–1050 cm−1, 1080–1190 cm−1, 1250–1380 cm−1 and 1530–1640 cm−1). This spectrum profile can also be observed in the SERS signals generated from cells incorporated with citrate-stabilized AuNPs (Fig. 2b). It is understandable that the first order of spectrum profile could be similar in all mammalian cells, on account of the almost identical intracellular biochemical compositions.39 However, there are still evident differences among the three spectral lines, illuminating the capability of BP-AuNPs for cellular discrimination. Table S2† summaries the assignments of the SERS bands shown in Fig. 3a, which can be clearly linked to proteins, nucleic acids, lipids and carbohydrates inside the cancer cells. Though most of the Raman peaks are similar in the three SERS spectra, the position and intensity of several bands are discrepant in each spectrum, even that some peaks are exclusive on one of them. This reflects the subtle biochemical discrepancy in the three types of tumor cells. We also acquired the label-free SERS images (Fig. 3b), where unambiguous vibrational signatures of cellular components are recognized in cytoplasmic regions, indicating the extensive applications of BP-AuNPs on multiple types of cancer cells.
Fig. 3.
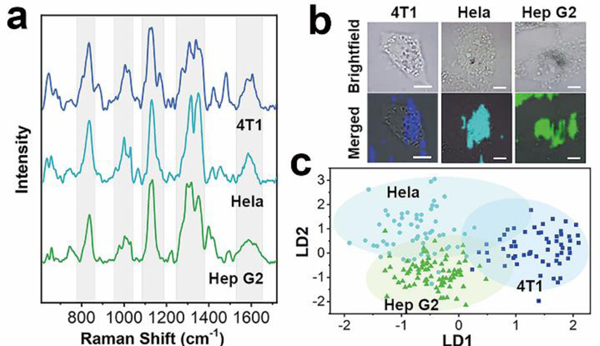
a) The mean SERS spectra of 4T1, Hela and Hep G2 cells incubated with BP-AuNPs. b) SERS images of the three tumor cells (Scale bar: 10 μm). c) Scatter plot of the linear discriminant scores of three kinds of cells using PCA-LDA algorithm.
To achieve more accurately distinguishment, principal component analysis combined with linear discriminant analysis (PCA-LDA), a conventional multivariate statistical method in Raman analysis,36 was used to quantify and maximize the variance and separation among the three samples. PCA allows simplification of the Raman spectra by extracting a set of PC variables. We chose the first fifty PCs that accounted for 99% of the total variance to perform the linear discriminant analysis. Fig. 3c demonstrates the scatter plot of the first and second discriminant functions (LD1 versus LD2) based on PCA-LDA model, in which a clear separation of 4T1, Hela and Hep G2 cells is achieved, although tiny overlaps are seen among the three groups. The discrimination result obtained by PCA-LDA analysis was then quantitatively evaluated utilizing leave-one-out cross-validation method, as summaried in Table S3†, which showed a good diagnostic accuracy. For each species of cancer cell, the diagnostic sensitivities are 78.0%, 61.7% and 86.3%, and the diagnostic specificities are 97.1%, 66.2% and 58.8% for 4T1, Hela and Hep G2 cells, respectively.
The high-sensitivity of BP-AuNPs for bio-SERS analysis enables monitoring the cellular physiological state. Before the intracellular kinetics study, BP-AuNPs were loaded with a fluorescent dye (rhodamine B) to investigate the endocytosis mechanism. Four endocytic inhibitors, chlorpromazine (CPZ, clathrin inhibitor), amiloride (Ami, macropinocytosis inhibitor), methyl-β-cyclodextrin (MβCD, caveolae inhibitor) and sodium azide (NaN3, ATP-depleting agent) were used to suppress the major endocytosis pathways. As shown in Fig. 4a, the minimum fluorescent signals of the nanohybrids are detected in the cells treated with MβCD or Ami, indicating that BP-AuNPs are taken up mainly by ways of caveolae-dependent endocytosis and micropinocytosis. We further studied the uptake kinetics of the nanostructures in order to understand the intracellular microenvironment changes during the endocytosis process. SERS mapping of the Hep G2 cells which denoted the distribution of endocytosed nanoparticles was acquired at different time points after the addition of BP-AuNPs (Fig. 4b). At 0.5 h, only a small amount of SERS signals are observed in the vicinity of plasmalemma, revealling the beginning of internalization of the nanostructures. The mean SERS spectrum at this stage mainly reflects the microenvironment in the endosome (Fig. 4c), where a few weak Raman peaks related to protein or lipid are observed, including 941 cm−1 (α helix C-C stretching), 1004 cm−1 (Phe ring symmetrical breathing), 1266 cm−1 (amide III and lipid CH2 deformation) and 1394 cm−1 (protein COO- symmetrical stretching).33, 40–43 The SERS signals increase along with the incubation time of BP-AuNPs, and the Raman information becomes more abundant. We can note that some nanoparticles move to the inner region of the cytoplasm at 1 h. The SERS spectrum also witnesses the changes in biochemical components of Hep G2 cells, where some Raman bands that can be attributed to nucleic acids appear, such as 816 cm−1 and 837 cm−1 (O-P-O stretching), 1421 cm−1 (adenine and guanine) and 1506 cm−1 (adenine, cytosine and guanine). The existence of DNA/RNA probably result from the intracellular autophagic pathway after the fusion of endosome with primary lysosome.44 The SERS spectrum acquired at 2 h exhibits more fingerprint features that reflect the hydrolysis process in the lysosome. For example, the C-S band which often occurs in smaller peptides, is hydrolyzed from cysteine-containing proteins, resulting in the Raman peak at 682 cm−1 (C-S stretching mode).42 After 2.5 h incubation, the intensities of SERS signals experience significant enhancement and the typical spectral pattern of cells arises, which maybe the result of the substantial accumulation of gold nanostructures intracellularly, as shown in the SERS image. Thereafter, the Raman spectral features change little, except for the SERS intensities. Correspondingly, the amount of endocytosed BP-AuNPs gradually increased so that the nanostructures become recognizable in the micrographs.
Fig. 4.
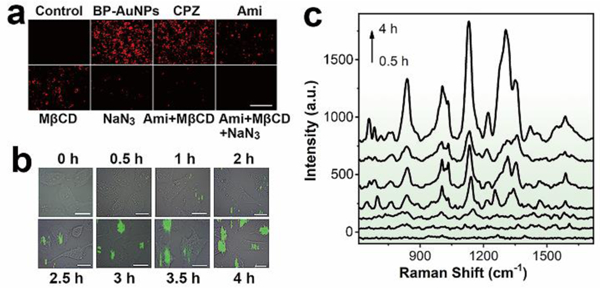
a) Fluorescence analysis of the endocytosis of BP-AuNPs in the presence of various endocytic inhibitors (Scale bar: 200 μm). b) Time-resolved SERS mapping during the endocytosis process of BP-AuNPs. SERS imaging of Hep G2 cells was performed after adding BP-AuNPs (32 μg mL−1) at 0.5, 1, 2, 2.5, 3, 3.5 and 4 h, respectively (Scale bar: 10 μm). c) Mean SERS spectra of the tumor cells extracted from the SERS images at different times.
Photothermal effect of BP-Au nanohybrids
For further therapeutic application, BP-AuNPs based multifunctional nanoplatforms, doxorubicin (DOX)-loaded PEGylated BP-Au (BAPD) nanosheets, were developed to facilitate combined chemotherapy and photothermal therapy of cancer. PEG was used to improve the dispersion of nanosystem (Fig. S15†). Fig. 5 shows the photothermal properities and drug delivery performance of the nanocomposites. In comparison to BP nanosheets, PEGylated BP-AuNPs (BAP) solution with identical concentration of BP experiences more rapid increasement of temperature during the 808 nm laser (2 W cm−2) exposure (Fig. 5a and Fig. S16†), which may be due to the strong plasmonic coupling of the gold nanoparticles. We also observe that the photothermal heating effect of BAP is concentration-dependent (Fig. 5b). The photothermal stability of BAP was evaluated by five laser on/off cycles, where no significant temperature variation was noticed (Fig. 5c). To exactly illustrate the photothermal properties of the nanostructures, the NIR photothermal transduction efficiency (η) was calculated according the previous work.45 As shown in Fig. S17†, the η values are calculated to be 32.8% and 43.0% for BP and BAP, respectively, which further confirms the significantly improved NIR photothermal feature of BAP.
Fig. 5.
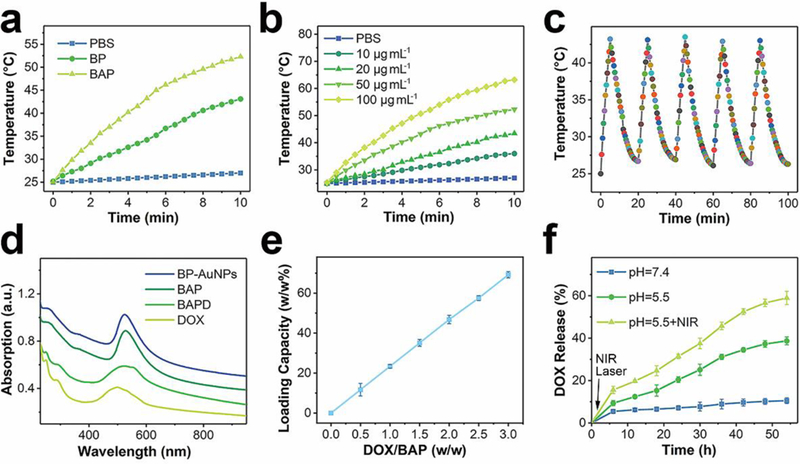
a) Photothermal heating curves of PBS with or without nanoparticles exposed to an 808 nm laser. b) NIR-induced heat generation of different concentrations of BAP aqueous dispersion. c) Temperature variation of BAP solution under five laser on/off cycles. d) UV-vis-NIR absorption spectra of BAP after drug loading. e) Quantification of DOX loading at various DOX concentration. f) DOX release profiles from BAP in PBS buffer at pH values of 7.4 and 5.5 with or without laser irradiation.
The excellent photothermal property of BAP enlightens its potential for photothermal tumor ablation. In view of its SERS activity, we real-time monitored the photothermal effect on Hep G2 cells using SERS technique. The mean SERS spectra of the cancer cells before and after NIR laser irradiation are shown in Fig. 6a, where significant molecular fingerprint changes emerge in response to the laser exposure. The difference spectrum clearly describes the alteration caused by the photothermal effect, and the corresponding tentative biochemical assignments of the Raman information are summarized in Table S4†. More abundant molecular features and more intense integrated Raman intensities are observed in the mean SERS spectrum of Hep G2 cells after laser ablation, which may be attributed to the collapse of membrane microstructure after the photothermolysis, leading to the diffusion of nanohybrids to the regions previously inaccessible. Especially, the Raman bands associated with nucleic acids are significantly prominent in comparison with that in the SERS spectrum before laser irradiation, for example, O-P-O stretching at 815/839 cm−1, thymine, guanine and adenine at 1376 cm−1, cytosine, guanine and adenine at 1508 cm−1, etc.33, 40–43 Concerning the protein, the primary alteration appears in the range of 1300–1400 cm−1, where the Raman bands associated with CH2/CH3 vibration in protein at 1316 cm−1 and 1355 cm−1 undergo remarkable enhancement in their intensities, benefiting from the extensive intracellular distribution of nanostructures. The Raman wavenumbers also shift to 1326 cm−1 and 1352 cm−1 respectively, indicating the structural transformation of protein along with hyperthermia. The SERS images of some typical peaks are displayed in Fig. 6b, demonstrating the intracellular distribution of some biochemical components before and after NIR photothermal ablation. The extensive redistribution of the SERS signals of proteins (1004 cm−1), DNA/RNA (815 cm−1), lipid (700 cm−1) and carbohydrate (883 cm−1) after laser irradiation also reveals the enormous transformation inside the cancer cells during photothermal ablation.
Fig. 6.
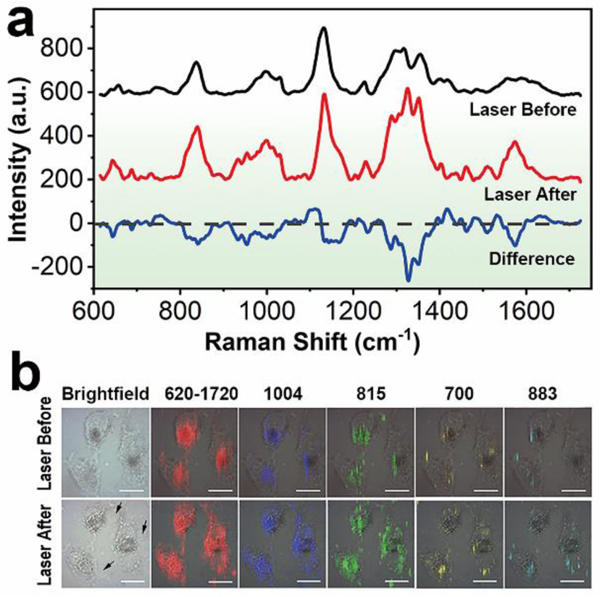
a) SERS spectra of Hep G2 cells before and after NIR laser irradiation. b) SERS mapping of the cancer cells with different Raman peaks, showing the intracellular distribution of the biochemical information. The arrows indicate the membrane blebbing after NIR photothermal treatment. Scale bar: 20 μm.
Chemo-photothermal therapy
The drug loading capability of BAP was measured by the absorption spectrometer. As shown in Fig. 5d, the characteristic peak of DOX emerges in the UV-vis-NIR absorption spectrum of BAPD, proving that the drug has been successfully attached to the nanohybrids. DOX loading also alters the zeta potential of BP nanosheets, from about −30 mV to 22 mV (Table S5†). The DOX loading rate of BAP is directly related to the initial concentration of the drug; and the maximal DOX loading is calculated as about 70% (Fig. 5e), which is significantly higher than that of conventional gold nanostructures due to the existence of BP nanosheet.46 The DOX-releasing characteristic from BAPD is shown in Fig. 5f where pH- and time-dependent drug release property is observed. The release of DOX from the nanocarrier is only about 11% at pH 7.4 after 54 h incubation, while 39% of DOX is released when the pH value of buffer solution drops down to 5.5. The release rate of DOX from BAPD can also be dramatically accelerated by the NIR laser exposure; about 59% of DOX is released with the aid of 808 nm laser irradiation.
Before the chemo-photothermal therapeutic application, classic methyl thiazolyl tetrazolium (MTT) assay was carried out to evaluate the cytotoxicity of BAP. It can be seen from Fig. 7a that there is no obvious toxic effect on Hep G2, 4T1 or Hela cells even if the concentration of the nanohybrids is up to 128 μg mL-1. The biocompatibility of nanocomposites can be further confirmed by the hemolysis assay, where no obvious hemolysis (5%) is observed even if the red blood cells were incubated with nanohybrids at the concentration of 200 μg mL−1 (Fig. S18†). Next, we assessed the in vitro chemo-photothermal efficacy of BAPD by conducting MTT test. Fig. 7b displays the relative viability of Hep G2 cells after anticancer treatment, which illustrates dose-dependent anti-proliferative effects. DOX shows evident cytotoxicity to the cancer cells, and the cell viability drops to about 53% when the concentration of DOX reaches 6 μg mL-1. While a higher cell death rate is observed in BAP plus laser (BAPL) group (70%). In comparison with single therapeutic treatment, chemo-photothermal therapy based on BAP (BAPDL) exhibits excellent tumor cell inhibition efficiency at every drug concentration. The cancer cell inhibition rate in BAPDL group reaches about 90% when the DOX concentration in BAP is 6 μg mL−1, implying remarkable synergetic therapeutic effects. Hep G2 cells were also stained with hoechst 33258, a DNA-binding fluorochrome, to study the apoptosis of cancer cells after treatment. Fig. 7c demonstrates the fluorescence microscopy images, in which the cells without laser or drug treatment presents uniform spherical nuclei emitting light blue fluorescence. The maximum number of granules with bright blue luminescence are observed in BAPDL group, indicating the destruction of nuclear architecture during apoptosis. In addition, the tumor cells in BAPDL group reveal stronger intracellular fluorescent signals of DOX compared to that in BAPD group, further confirming the laser-triggered drug release feature of BAPD.
Fig. 7.
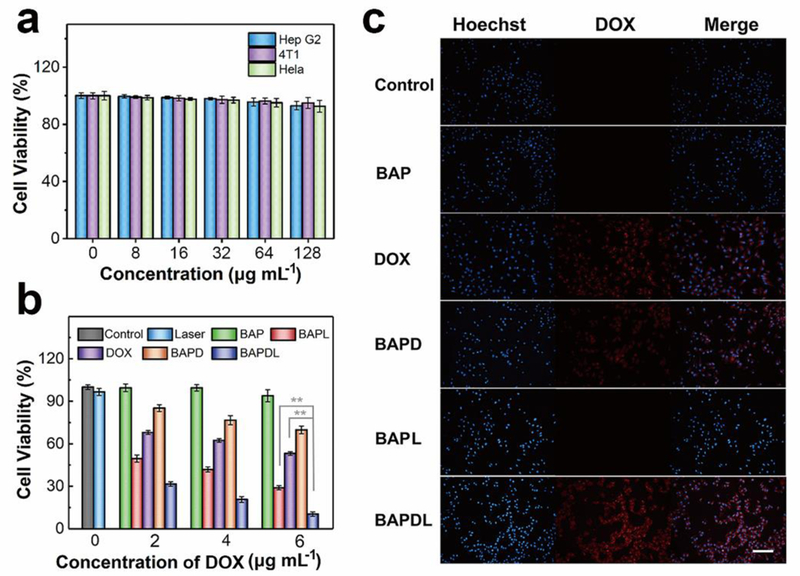
In vitro experiments. a) Relative viabilities of Hep G2, 4T1 and Hela cells after incubation with various concentrations of BAP for 24 h. b) Relative viabilities of Hep G2 cells after different types of treatment at different DOX concentrations. **P<0.01 vs. BAPDL group. c) Fluorescence microcopy images of Hep G2 cells after treatment (Scale bar: 100 μm).
Before in vivo chemo-photothermal therapy, the in vivo distribution of nanomaterials was study. The NIR fluorescent (NIRF) imaging of 4T1-bearing Balb/c mice intravenously injected with NIRF dye-grafted nanocarrier was carried out at different time points. As shown in Fig. S19†, the fluorescent signals were mainly distributed in the tumor region, demonstrating a good tumor accumulation through the enhanced permeability retention (EPR) effect. The NIRF signals gradually increase during the 48-h observation time, indicating a long retention time. Finally, the in vivo synergistic tumor therapeutic efficacy of BAPD was investigated. An infrared thermal camera was used to record the local temperature during the NIR laser irradiation. No obvious temperature change is observed in the tumor region of mice injected with PBS (Fig. 8a). In striking contrast, the surface temperatures of tumors containing BAP or BAPD exhibit a remarkable increase; and the temperatures reach over 65 °C after 150 s of laser exposure, which is fully sufficient to kill the tumors in vivo.47 The in vivo therapeutic efficacies of various treatments were evaluated by measuring the tumor sizes with a digital caliper. The tumor growth curves after different treatments are displayed in Fig. 8b. A rapid growth of tumors is noticed on the mice treated with PBS or BAP during the 16-day observation period. Though the tumor volumes reduce in the first few days, the mice injected with DOX experience an equivalent growth rate in tumor size in comparison with that of control groups, demonstrating that the tumor cells are inadequate to be killed by this dosage of administered DOX. In contrast, efficient anti-tumor effects are discovered in the BAPL group after photothermal treatment. The tumor growth curve in the chemo-photothermal group reveals the lowest growth rate, which may be viewed as the synergistic effect of drug and heat mediated by BP-metal nanostructures. To study the microstructural alteration in tumors, hematoxylin and eosin (H&E) staining of tumor slices was performed after 48 h of treatment. As shown in Fig. 8c, the tumor cells in control groups basically retain intact microstructures, while partial necrotic cells can be observed in the tumor injected with DOX. Destroyed cells increase when the tissues are exposed to NIR laser irradiation. And the most damaged cells can be observed in the tumors under chemo-photothermal treatment, which is consistent with the data above. The mice were sacrificed at day 16 after treatment to collect the tumor tissues. It can be clearly seen that the tumor sizes and the corresponding weights of mice treated with chemo-photothermal therapy are significantly smaller than that in other groups (Fig. 8d,e), further identifying the excellent therapeutic efficacy of BAP-based combined chemotherapy and photothermal therapy in vivo.
Fig. 8.
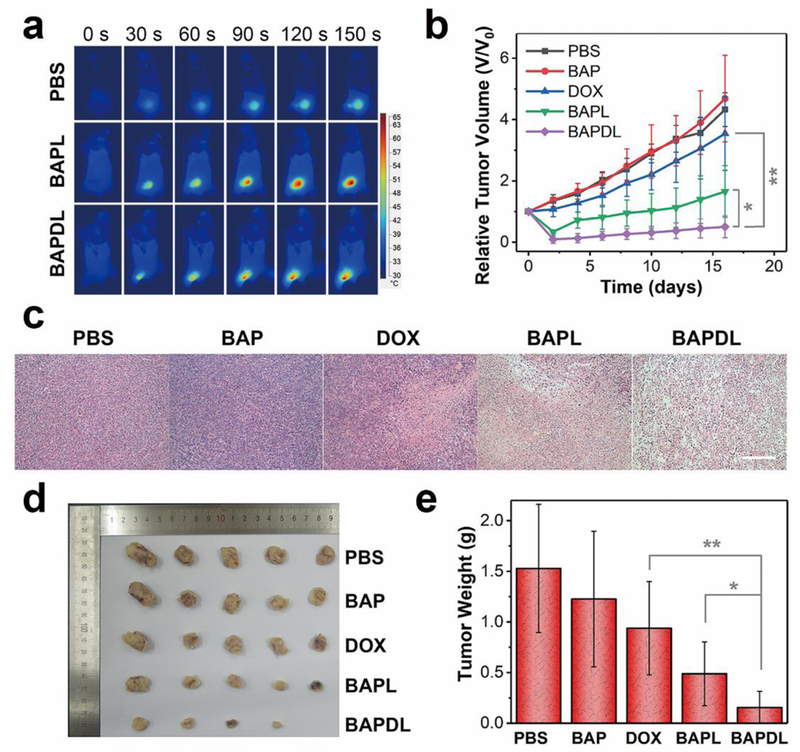
In vivo experiments. a) Infrared thermal images of tumor-bearing mice exposed to an NIR laser after injection with PBS, BAP and BAPD, recorded at different time intervals. b) Tumor growth curves of different groups of mice after therapy. c) Representative H&E-stained tumor slice images from mice post various treatments (Scale bar: 100 μm). d) Photographs of the tumors collected from different groups of mice at the end of treatment (day 16). e) Average weights of tumors collected from mice. *P<0.05 or **P<0.01 vs. BAPDL group.
In addition, the in vivo toxic side effects of nanomaterials were also monitored during the cancer therapy. As displayed in Fig. S20a†, weight loss, a common criterion utilized in oncologic evaluation, is not observed in all groups post-treatment. To accurately evaluate the systematic toxicities of BAP, the histological analysis of major organs of mice was carried out at 16 days after treatment. Fig. S20b† demonstrates the micrographs of major organs (heart, liver, spleen, lung and kidney) with H&E staining, where neither evident organ lesions nor inflammation are noticed in the tissue slices, indicating the promise of utilization of BP-metal nanostructures as biocompatible nanoplatforms for theranostic applications.
Conclusions
In summary, we have developed the multifunctional nanohybrids composed of BP and Au nanoparticles via a facile one-pot approach. The deposition of AuNPs onto the nanosheet endows it with outstanding NIR SERS activity, profiting from the versatile Raman enhancement effects. In comparison with the current graphene-based lamellar SERS platforms, the SERS analysis based on BP-AuNPs does not suffer from the high Raman background in the fingerprint region, which is considered to be much suitable for the detection of biological samples. The utilization of BP-AuNPs novel 2D SERS substrate for the biocomponent identification and classification of tumor cells, ultrafast label-free live-cell NIR SERS imaging, tracking of endocytosed nanostructures, as well as real-time monitoring of photothermal ablation of cancer cells has been successfully achieved. The flake-shaped BP-Au nanocomposites also preserve the favourable NIR absorption characteristic and ultrahigh surface area of BP that can serve as novel nanoplatforms to deliver heat and drug to the tumor cells. The data acquired from in vitro and in vivo experiments have demonstrated the remarkable synergistic effects mediated by the BP-metal based chemo-photothermal therapy. The multimodal bioapplications of BP-Au nanohybrids unlock a novel theranostic strategy in nanomedicine.
Supplementary Material
Acknowledgements
This work was supported by the National Natural Science Foundation of China (61335011, 61675072, 11874021, 21505047, 61505055, 61275187, 81500361 and 81670417), the Natural Science Foundation of Guangdong Province of China (2017A030313813 and 2014A030311024), the Science and Technology Project of Guangdong Province of China (2017A020215059) and the NIH grants (DP3 DK104397 and R01 EY024544).
Conflicts of interest
There are no conflicts to declare.
Electronic Supplementary Information (ESI) available.
Notes and references
- 1.Li L, Yu Y, Ye GJ, Ge Q, Ou X, Wu H, Feng D, Chen XH and Zhang Y, Nat. Nanotechnol, 2014, 9, 372. [DOI] [PubMed] [Google Scholar]
- 2.Liu H, Neal AT, Zhu Z, Luo Z, Xu X, Tománek D and Ye PD, ACS Nano, 2014, 8, 4033. [DOI] [PubMed] [Google Scholar]
- 3.Choi JR, Yong KW, Choi JY, Nilghaz A, Lin Y, Xu J and Lu X, Theranostics, 2018, 8, 1005. [DOI] [PMC free article] [PubMed] [Google Scholar]
- 4.Yang B, Yin J, Chen Y, Pan S, Yao H, Gao Y and Shi J, Adv. Mater, 2018, 30, 1705611. [DOI] [PubMed] [Google Scholar]
- 5.Chen W, Ouyang J, Yi X, Xu Y, Niu C, Zhang W, Wang L, Sheng J, Deng L, Liu YN and Guo S, Adv. Mater, 2018, 30, 1703458. [DOI] [PubMed] [Google Scholar]
- 6.Sun Z, Xie H, Tang S, Yu XF, Guo Z, Shao J, Zhang H, Huang H, Wang H and Chu PK, Angew. Chem. Int. Ed, 2015, 54, 11526. [DOI] [PubMed] [Google Scholar]
- 7.Shao J, Xie H, Huang H, Li Z, Sun Z, Xu Y, Xiao Q, Yu X-F, Zhao Y, Zhang H, Wang H and Chu PK, Nat. Commun, 2016, 7, 12967. [DOI] [PMC free article] [PubMed] [Google Scholar]
- 8.Sun C, Wen L, Zeng J, Wang Y, Sun Q, Deng L, Zhao C and Li Z, Biomaterials, 2016, 91, 81. [DOI] [PubMed] [Google Scholar]
- 9.Sun Z, Zhao Y, Li Z, Cui H, Zhou Y, Li W, Tao W, Zhang H, Wang H, Chu PK and Yu XF, Small, 2017, 13, 1602896. [DOI] [PubMed] [Google Scholar]
- 10.Lee HU, Park SY, Lee SC, Choi S, Seo S, Kim H, Won J, Choi K, Kang KS, Park HG, Kim HS, An HR, Jeong KH, Lee YC and Lee J, Small, 2016, 12, 214. [DOI] [PubMed] [Google Scholar]
- 11.Mao C, Xiang Y, Liu X, Cui Z, Yang X, Li Z, Zhu S, Zheng Y, Yeung KWK and Wu S, ACS Nano, 2018, 12, 1747. [DOI] [PubMed] [Google Scholar]
- 12.Wang H, Yang X, Shao W, Chen S, Xie J, Zhang X, Wang J and Xie Y, J. Am. Chem. Soc, 2015, 137, 11376. [DOI] [PubMed] [Google Scholar]
- 13.Geng S, Wu L, Cui H, Tan W, Chen T, Chu PK and Yu X-F, Chem. Commun, 2018, 54, 6060. [DOI] [PubMed] [Google Scholar]
- 14.Wang S, Weng J, Fu X, Lin J, Fan W, Lu N, Qu J, Chen S, Wang T and Huang P, Nanotheranostics, 2017, 1, 208. [DOI] [PMC free article] [PubMed] [Google Scholar]
- 15.Tao W, Zhu X, Yu X, Zeng X, Xiao Q, Zhang X, Ji X, Wang X, Shi J, Zhang H and Mei L, Adv. Mater, 2017, 29, 1603276. [DOI] [PMC free article] [PubMed] [Google Scholar]
- 16.Chen W, Ouyang J, Liu H, Chen M, Zeng K, Sheng J, Liu Z, Han Y, Wang L, Li J, Deng L, Liu YN and Guo S, Adv. Mater, 2017, 29, 1603864. [DOI] [PubMed] [Google Scholar]
- 17.Qiu M, Wang D, Liang W, Liu L, Zhang Y, Chen X, Sang DK, Xing C, Li Z, Dong B, Xing F, Fan D, Bao S, Zhang H and Cao Y, Proc. Natl. Acad. Sci. U. S. A, 2018, 115, 501. [DOI] [PMC free article] [PubMed] [Google Scholar]
- 18.Li Y, Liu Z, Hou Y, Yang G, Fei X, Zhao H, Guo Y, Su C, Wang Z, Zhong H, Zhuang Z and Guo Z, ACS Appl. Mater. Interfaces, 2017, 9, 25098. [DOI] [PubMed] [Google Scholar]
- 19.Wang H, Zhong L, Liu Y, Xu X, Xing C, Wang M, Bai SM, Lu CH and Yang HH, Chem. Commun, 2018, 54, 3142. [DOI] [PubMed] [Google Scholar]
- 20.Yin PT, Shah S, Chhowalla M and Lee K-B, Chem. Rev, 2015, 115, 2483. [DOI] [PMC free article] [PubMed] [Google Scholar]
- 21.Yang D, Yang G, Yang P, Lv R, Gai S, Li C, He F and Lin J, Adv. Funct. Mater, 2017, 27, 1700371. [Google Scholar]
- 22.Ouyang J, Deng L, Chen W, Sheng J, Liu Z, Wang L and Liu YN, Chem. Commun, 2018, 54, 2874. [DOI] [PubMed] [Google Scholar]
- 23.Ma YH, Dou WT, Pan YF, Dong LW, Tan YX, He XP, Tian H and Wang HY, Adv. Mater, 2017, 29, 1604253. [DOI] [PubMed] [Google Scholar]
- 24.Lane LA, Qian X and Nie S, Chem Rev, 2015, 115, 10489. [DOI] [PubMed] [Google Scholar]
- 25.Xu W, Mao N and Zhang J, Small, 2013, 9, 1206. [DOI] [PubMed] [Google Scholar]
- 26.Zhang X, Dai Z, Si S, Zhang X, Wu W, Deng H, Wang F, Xiao X and Jiang C, Small, 2017, 13, 1603447. [Google Scholar]
- 27.Ren W, Fang Y and Wang E, ACS Nano, 2011, 5, 6425. [DOI] [PubMed] [Google Scholar]
- 28.Chen Y, Zhang Y, Pan F, Liu J, Wang K, Zhang C, Cheng S, Lu L, Zhang W, Zhang Z, Zhi X, Zhang Q, Alfranca G, de la Fuente JM, Chen D and Cui D, ACS Nano, 2016, 10, 8169. [DOI] [PubMed] [Google Scholar]
- 29.Lin J, Liang L, Ling X, Zhang S, Mao N, Zhang N, Sumpter BG, Meunier V, Tong L and Zhang J, J. Am. Chem. Soc, 2015, 137, 15511. [DOI] [PubMed] [Google Scholar]
- 30.Abellan G, Lloret V, Mundloch U, Marcia M, Neiss C, Gorling A, Varela M, Hauke F and Hirsch A, Angew. Chem. Int. Ed, 2016, 55, 14557. [DOI] [PubMed] [Google Scholar]
- 31.Brent JR, Savjani N, Lewis EA, Haigh SJ, Lewis DJ and O’Brien P, Chem. Commun, 2014, 50, 13338. [DOI] [PubMed] [Google Scholar]
- 32.Chithrani BD and Chan WCW, Nano Lett, 2007, 7, 1542. [DOI] [PubMed] [Google Scholar]
- 33.Kneipp J, Kneipp H, McLaughlin M, Brown D and Kneipp K, Nano Lett, 2006, 6, 2225. [DOI] [PubMed] [Google Scholar]
- 34.Kim YK, Na HK, Kim S, Jang H, Chang SJ and Min DH, Small, 2015, 11, 2527. [DOI] [PubMed] [Google Scholar]
- 35.Tang HW, Yang XB, Kirkham J and Smith DA, Anal. Chem, 2007, 79, 3646. [DOI] [PubMed] [Google Scholar]
- 36.Huefner A, Kuan WL, Muller KH, Skepper JN, Barker RA and Mahajan S, ACS Nano, 2016, 10, 307. [DOI] [PubMed] [Google Scholar]
- 37.Liu Z, Hu C, Li S, Zhang W and Guo Z, Anal. Chem, 2012, 84, 10338. [DOI] [PubMed] [Google Scholar]
- 38.Chen Y, Bai X, Su L, Du Z, Shen A, Materny A and Hu J, Sci. Rep, 2016, 6, 19173. [DOI] [PMC free article] [PubMed] [Google Scholar]
- 39.Huefner A, Kuan WL, Barker RA and Mahajan S, Nano Lett, 2013, 13, 2463. [DOI] [PMC free article] [PubMed] [Google Scholar]
- 40.Thomas GJ Jr., Prescott B and Olins DE, Science, 1977, 197, 385. [DOI] [PubMed] [Google Scholar]
- 41.Willets KA, Anal. Bioanal. Chem, 2009, 394, 85. [DOI] [PubMed] [Google Scholar]
- 42.Yu NT, Liu CS and O’Shea DC, J Mol. Biol, 1972, 70, 117. [DOI] [PubMed] [Google Scholar]
- 43.Xie W, Wang L, Zhang Y, Su L, Shen A, Tan J and Hu J, Bioconjugate Chem, 2009, 20, 768. [DOI] [PubMed] [Google Scholar]
- 44.Fujiwara Y, Kikuchi H, Aizawa S, Furuta A, Hatanaka Y, Konya C, Uchida K, Wada K and Kabuta T, Autophagy, 2013, 9, 1167. [DOI] [PMC free article] [PubMed] [Google Scholar]
- 45.Zhang L, Chen Y, Li Z, Li L, Saint-Cricq P, Li C, Lin J, Wang C, Su Z and Zink JI, Angew. Chem. Int. Ed, 2016, 55, 2118. [DOI] [PubMed] [Google Scholar]
- 46.Wang F, Wang YC, Dou S, Xiong MH, Sun TM and Wang J, ACS Nano, 2011, 5, 3679. [DOI] [PubMed] [Google Scholar]
- 47.Jang B, Park JY, Tung CH, Kim IH and Choi Y, ACS Nano, 2011, 5, 1086. [DOI] [PubMed] [Google Scholar]
Associated Data
This section collects any data citations, data availability statements, or supplementary materials included in this article.


