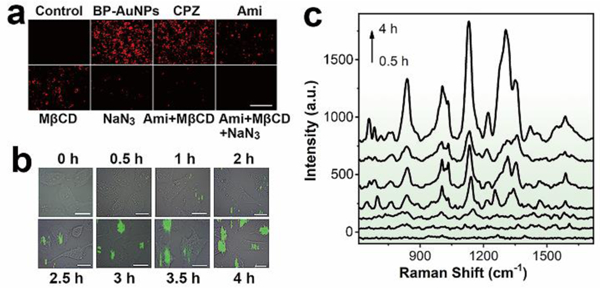
Fig. 4.

a) Fluorescence analysis of the endocytosis of BP-AuNPs in the presence of various endocytic inhibitors (Scale bar: 200 μm). b) Time-resolved SERS mapping during the endocytosis process of BP-AuNPs. SERS imaging of Hep G2 cells was performed after adding BP-AuNPs (32 μg mL−1) at 0.5, 1, 2, 2.5, 3, 3.5 and 4 h, respectively (Scale bar: 10 μm). c) Mean SERS spectra of the tumor cells extracted from the SERS images at different times.
