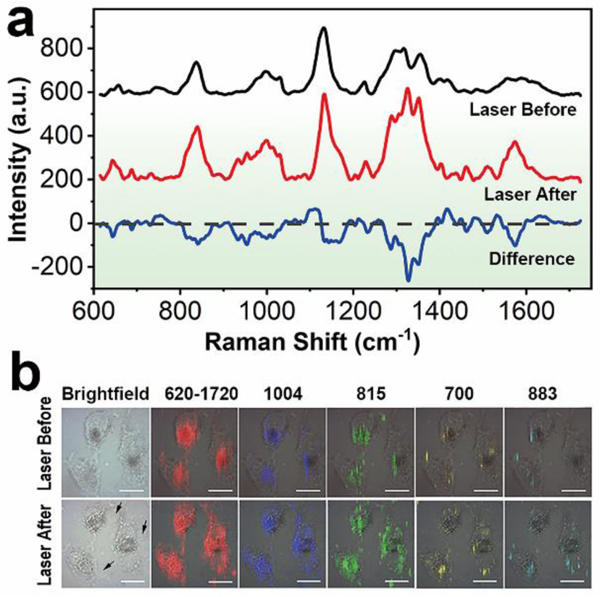
Fig. 6.

a) SERS spectra of Hep G2 cells before and after NIR laser irradiation. b) SERS mapping of the cancer cells with different Raman peaks, showing the intracellular distribution of the biochemical information. The arrows indicate the membrane blebbing after NIR photothermal treatment. Scale bar: 20 μm.
