Abstract
Cancer cells have routinely been cultured in two dimensions (2D) on a plastic surface. This technique, however, lacks the true environment a tumor mass is exposed to in vivo. Solid tumors grow not as a sheet attached to plastic, but instead as a collection of clonal cells in a three-dimensional (3D) space interacting with their neighbors, and with distinct spatial properties such as the disruption of normal cellular polarity. These interactions cause 3D-cultured cells to acquire morphological and cellular characteristics which are more relevant to in vivo tumors. Additionally, a tumor mass is in direct contact with other cell types such as stromal and immune cells, as well as the extracellular matrix from all other cell types. The matrix deposited is comprised of macromolecules such as collagen and fibronectin.
In an attempt to increase the translation of research findings in oncology from bench to bedside, many groups have started to investigate the use of 3D model systems in their drug development strategies. These systems are thought to be more physiologically relevant because they attempt to recapitulate the complex and heterogeneous environment of a tumor. These systems, however, can be quite complex, and, although amenable to growth in 96-well formats, and some now even in 384, they offer few choices for large-scale growth and screening. This observed gap has led to the development of the methods described here in detail to culture tumor spheroids in a high-throughput capacity in 1536-well plates. These methods represent a compromise to the highly complex matrix-based systems, which are difficult to screen, and conventional 2D assays. A variety of cancer cell lines harboring different genetic mutations are successfully screened, examining compound efficacy by using a curated library of compounds targeting the Mitogen-Activated Protein Kinase or MAPK pathway. The spheroid culture responses are then compared to the response of cells grown in 2D, and differential activities are reported. These methods provide a unique protocol for testing compound activity in a high-throughput 3D setting.
Keywords: Cancer Research, Issue 139, Tumor spheroids, three-dimensional (3D), multi-well plates, drug screening, high-throughput, defined medium
Introduction
In the past decade, more and more studies have implemented the use of 3D cell culture models to understand concepts that are not fully recapitulated by growing cells in 2D on plastic. Examples of these concepts include the alternations in normal epithelial cell polarity1 where the spatial orientation of apical and basal layers of cells are lost, as well as the role of the extracellular matrix in regulating survival and cell fate. Oncology research, in particular, has used 3D models to understand the basic biology of cancer cells and the differences between 2D and 3D cell culture systems3,4. The development of more sophisticated cell culture techniques and their further adaption to multi-well formats has enabled the search for new drugs in 3D settings. In contrast to cells grown under 2D conditions, 3D models of tumors range in complexity from layered cellular systems5 to single-cell-type spheres of different sizes, to complex multi-cell-type spheres6,7,8. The discovery of novel compounds or biologics that potently induce cell death in these 3D model systems is, therefore, of high interest in drug development campaigns. Endpoints of these assays are often identical to those performed in 2D cultures to assess changes in cell proliferation, but when conducted in a more physiologically relevant setting, they may reveal the true level of dependency of the target gene or pathway being interrogated.
As introduced above, a variety of model systems have been developed to study drug responses in 3D culture systems, but the majority use either 96 or 384-well microtiter plates and are not easily adaptable to the high-throughput screening (HTS) formats often used in drug discovery screening campaigns. Such systems include the use of hanging droplet technologies, spheroid cultures, pulsating cells with magnetic particles to induce levitation, and cultures incorporating natural or synthetic gels such as collagen, Matrigel, or polyethylene glycol (PEG)2. Here, we present the detailed methods of a previously developed technique to produce 3D spheroid cultures from established cancer cell lines in a 1536-well plate format. In this protocol, a highly defined medium is used which prevents the attachment of normally adherent cell lines9. This system has limitations (i.e., it cannot fully recapitulate a complex model system of cancer), but nevertheless, these assays enable a high-throughput screening of large collections of small molecules and crosswise comparisons of drug response between 2D and 3D cultures against a variety of cell lines and compounds.
The cell lines selected to demonstrate the methods in this article all harbor mutations in genes related to the MAPK signaling pathway, a pathway which is highly dysregulated in cancer, and for which many therapeutics are available. Many of the lines have activating oncogenic mutations in the Kirsten Rat Sarcoma virus also referred to as KRAS, the Neuroblastoma RAS or NRAS, the Harvey Rat Sarcoma virus oncogene or HRAS, and the associated kinases Rapidly Accelerated Fibrosarcomas, also known as RAFs. Recent literature suggests that the inhibitors of different nodes of this pathway are uniquely more efficacious in a subset of the cell lines when grown under 3D conditions9,10. One study found that when cancer cells with active RAS were cultured in 3D, they demonstrated an increased sensitivity to MAPK inhibitors, and further, that this approach could identify pathways and targeted inhibitors that might be missed in the traditional 2D setting. The goal of this study is to present the methods used to culture these cell lines, and further, to demonstrate the differential responses to these inhibitors which can be observed only when using 3D cell culture systems.
Protocol
1. Culturing of 1536-well 3D Tumor Spheroids
Prepare a fresh 3D tumor spheroid medium stem (cell medium + knockout serum replacement + insulin-transferrin-selenium) by adding the following reagents to 500 mL of Dulbecco's Modified Eagles Medium (DMEM/F12): 1x penicillin/streptomycin, 10 ng/mL of human basic fibroblast growth factor (bFGF), 20 ng/mL of human epidermal growth factor (EGF), 0.4% bovine serum albumin (BSA) (Fraction V), 1x insulin-transferrin-selenium, and 1% knockout (KO) serum replacement (do not freeze-thaw).
Filter-sterilize the entire medium with the supplements through a 0.4 µm bottle-top filter system.
Detach the cancer cell lines, which have been growing according to recommended routine culture conditions, from the traditional cell-culture flasks by washing them 3x with 1x phosphate buffered saline (PBS) and adding an appropriate amount of 0.25% trypsin (1 mL per 5 cm2) for 5 min to create a thin layer over the cells. Neutralize the trypsin with 5x the amount of the medium containing the serum and proceed to count the cells. For example, use 25 mL of medium for 5 mL of trypsin.
Adjust the concentration of the cell solution to 62.5 x 10⁴ cells/mL in order to seed a total of 500 cells per well in 8 µL of spheroid medium into the 1536-well tissue-culture-treated plates.
In a biological safety cabinet, seed the cells using a sterilized, small stainless-steel-tipped cassette with a peristaltic-pump-based system. Between different cell lines, flush the tubing of the cassette with 1x PBS and 70% Ethanol for 10 s.
Alternatively, seed the cells using a liquid handler located within a HEPA-filtered room using either a sterilized, small stainless-steel-tipped cassette and a peristaltic pump or an attached syringe pump, depending on the number of plates per cell line needed.
Seal the plates using a breathable adhesive plate seal either manually or using a plate sealer.
Place the plates in a spinning incubator set at 10 rpm and 37 °C with 5% carbon dioxide (CO2) and 95% relative humidity. Allow the spheroids to form for 3 d.
2. Culturing of 1536-well 2D Cancer Lines
NOTE: The 1536-well 2D cancer lines should be cultured 24 h before the addition of the compound to the 3D plates.
Prepare a 2D cancer cell medium by adding the following reagents to 500 mL of an appropriate growth medium for the selected lines: 1x penicillin/streptomycin and 10% fetal bovine serum (FBS).
Filter-sterilize the entire medium with the supplements through a 0.4 µm bottle-top filter system.
Detach the cancer cell lines, which have been growing according to recommended routine culture conditions, from the traditional cell-culture flasks by washing them 3x with 1x PBS and adding an appropriate amount of 0.25% trypsin (1 mL per 5 cm2) for 5 min to create a thin layer over the cells. Neutralize the trypsin with 5x the amount of the medium containing the serum and proceed to count the cells. For example, use 25 mL of medium for 5 mL of trypsin.
Adjust the concentration of the cell solution to 62.5 x 10⁴ cells/mL in order to seed a total of 500 cells per well in 8 µL of complete medium into 1536-well tissue-culture-treated plates.
In a biological safety cabinet, seed the cells using a sterilized, small stainless-steel-tipped cassette with a peristaltic-pump-based system. Between the different cell lines, flush the tubing of the cassette with 1x sterile PBS and 70% Ethanol for 10 s.
Alternatively, seed the cells using a liquid handler located within a HEPA-filtered robotics room using either a sterilized, small stainless-steel-tipped cassette and a peristaltic pump or the attached syringe pump, depending on the volume of the plates per cell line needed.
Seal the plates using a breathable adhesive plate seal either manually or using a plate sealer.
Place the plates in a spinning incubator set at 10 rpm and 37 °C for 24 h prior to the compound addition, with 5% CO2 and 95% relative humidity.
3. Compound Addition
Prepare 8-point, 3-fold serial dilutions of MAPK inhibitors in 100% dimethyl sulfoxide (DMSO) on a liquid-handling robot with a 10 mM top concentration. The proteasome inhibitor Bortezomib is used as a positive control for a complete cell killing to determine the dynamic range of the assay.
Quick-spin all assay plates and compound plates at 100 x g to collect any condensation. Remove the adhesive seal from each plate and place a plate on an acoustic dispenser set-up to add a total of 8 nL of each compound/dilution representing a final concentration of 0.1% DMSO per well and a top compound dose of 10 µM.
After the addition of the compound is completed, place a custom-made, stainless-steel cell culture lid which prevents evaporation on the plate and place the plate into a spinning incubator at 37 °C for 5 d, with 5% CO2 and 95% relative humidity.
4. Detection Reagent Addition and the Acquirement of Raw Data
Pre-warm an adequate volume of a cell lysis reagent containing luciferin to detect changes in adenine triphosphate (ATP) and, thus, changes in the cell proliferation at room temperature or in a 37 °C water bath. Add a total of 3 µL of the detection reagent to each well using a peristaltic pump and incubate the plate at room temperature for at least 15 min.
Capture the luminescence on a plate luminometer.
5. Data Processing
Extract the raw data from the instrument and normalize all fields containing test compounds to the average of all wells containing DMSO alone as the neutral control. From this value, calculate the percent growth inhibition of each compound. This is completed using the formula function in Microsoft Excel where f(x)={(sample value relative light units (RLUs)/(average DMSO value RLUs)*100)}.
Generate the dose-response curves and inhibitory IC50s by graphing the values of the normalized data from step 5.1 against the compound concentration using a graphing program. NOTE: We analyzed the data using Helios, an internal NIBR software tool. To complete this function, we selected the nonparametric curve analysis tool.
Representative Results
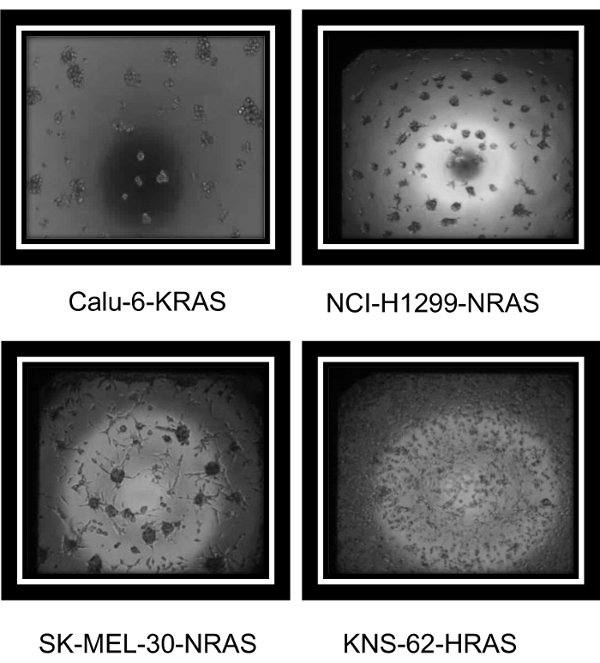
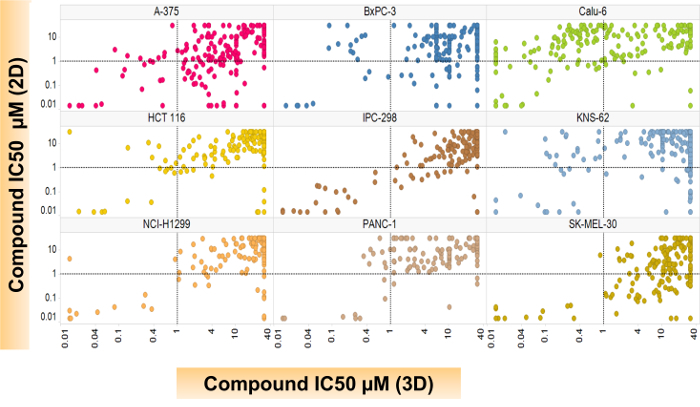
A variety of established cancer cell lines known to grow well under 2D culture conditions were tested using the methods outlined here. Representative images from a variety of MAPK mutant cancer cell lines (Calu-6:KRAS, NCI-H1299:NRAS, SK-MEL-30:NRAS, and KNS-62:HRAS) are seen in Figure 1. These images demonstrate that although the cell lines have various morphologies, each formed 3D structures in the 1536-well assay plates. Figure 2 demonstrates that, when used for large-scale screening, differential compound sensitivity between cultures grown in 2D versus those in 3D can be observed. Each dot on the graph represents one compound's inhibitory concentration where there is a 50% cell killing or the compound's IC50 response in both settings. To demonstrate that the effect is not mediated solely by the different media, Calu-6 cells were cultured in the same media using either 2D tissue-cultured plates or 3D Scivax biofilm plates which prevent attachment. The increased sensitivity or lower IC50 for the 3D growth condition is seen in Supplemental Figure 1 for two compounds in the same media. Lines like Calu-6 demonstrate an increased sensitivity to the compounds when grown under 3D conditions, while lines like SK-MEL-30 are less sensitive in 3D compared to 2D. Table 1 includes additional background information about all the cell lines that were used in this screen.
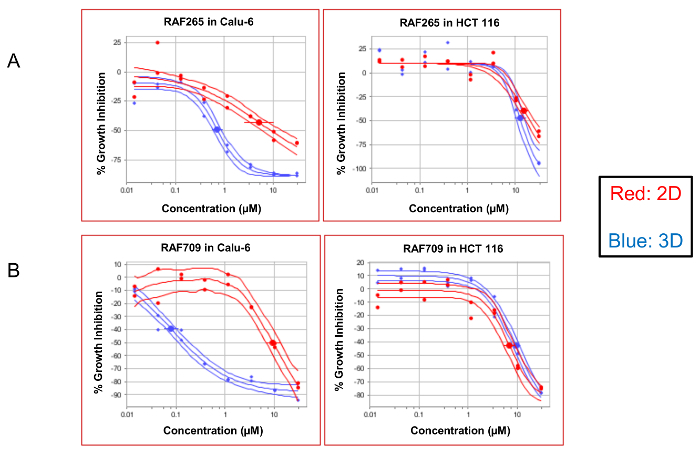
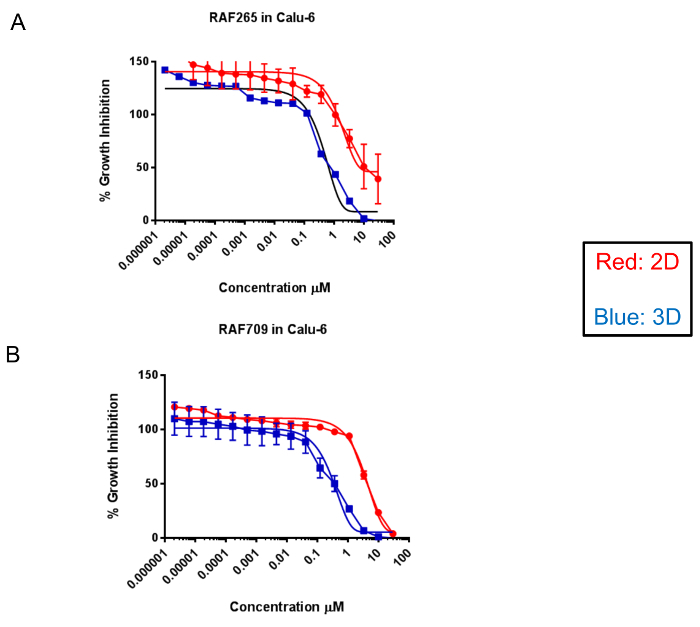
Examples of representative dose-response curves are visualized in Figure 3. This figure demonstrates the differential efficacy of two compounds, RAF265 (Figure 3A) and RAF709 (Figure 3B), which inhibit the activity of RAF kinases. Both compounds are more potent in 3D conditions in Calu-6, which is a non-small cell lung cancer line harboring Q61K, an activating mutation in the protein KRAS. At the same time, both compounds are similarly potent in the 3D spheroids and 2D cultures from the HCT116 colon cancer line, which contains the G13D-activating mutation in KRAS. To demonstrate that the effect of the increased sensitivity is mediated by the growth condition of 3D versus 2D and not simply by the different media conditions, Calu-6 cells were grown using FBS under both conditions. As seen in Supplemental Figure 1, when both 2D and 3D conditions use FBS, the 3D culture still demonstrates an increased sensitivity to the compounds producing a lower IC50.
Finally, the 3D assay also permitted an observation of the phenomenon of paradoxical growth activation, which is known to occur when there is an incomplete inhibition of RAF dimers in highly activated RAS mutant lines, and not in the dimer-independent pathway activation found in BRAF V600E mutations11,12. This activation is seen in Figure 4,upon treatment with the BRAF inhibitor Dabrafenib under 3D conditions in KNS-62, an HRAS-mutated small cell lung cancer line, and also in the atypical-BRAF mutant pancreatic cell line BxPC-3. The growth is activated at low concentrations of the drug, and the growth is only repressed at high concentrations of the drug (Figure 4B). This activation was surprisingly not seen in the KRAS mutant line Calu-6 and is not to be expected in the V600E BRAF mutant line A375. We have observed a paradoxical activation of Calu-6 using other 3D growth models (data not shown).
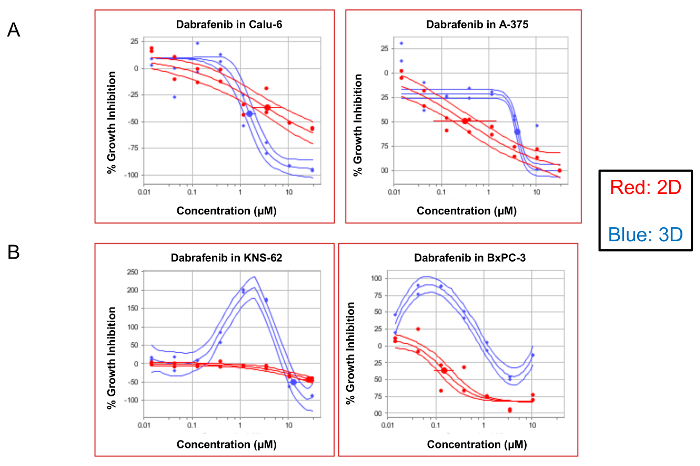
Figure 1: Representative images of cancer cells growing in 3D 1536-well plates. Cells were plated for a total of 3 d in 1536-well plates using a reagent dispenser and a small cassette. Bright-field images, acquired on an inverted microscope using a 4X lens, demonstrate the various 3D morphologies in the MAPK mutant cell lines Calu-6:KRAS, NCI-H1299:NRAS, SK-MEL-30:NRAS, and KNS-62:HRAS. Please click here to view a larger version of this figure.
Figure 2: A scatter plot comparing the 2D- versus the 3D-compound efficacy across cell lines. Spheroids, which were previously generated for 3 d, were then treated with compounds for an additional 5 d before the compound efficacy was determined. Each circle represents a unique compound response. Changes in the cell proliferation were detected using a lytic cell proliferation reagent, and IC50s were calculated using a four-parameter logistic regression analysis with the internal software called Helios. Please click here to view a larger version of this figure.
Figure 3: Dose-response curves comparing 2D- versus 3D-compound efficacy. The dose-response curves demonstrate the compound efficacy compared to the DMSO controls. The curves of the KRAS mutant Calu-6 and HCT116 cells treated with two RAF inhibitors, RAF265 and RAF709, are displayed here as a percentage in the change in cell growth (% growth inhibition) compared to the DMSO control wells. A population of the cells that were grown under 2D conditions appears in red, and those grown as 3D spheroids are in blue. The solid lines around the data indicate the 95% confidence intervals for each data set. Please click here to view a larger version of this figure.
Figure 4: Certain 3D cultures capture the phenomena of paradoxical growth activation. The dose-response curves demonstrate the compound efficacy (% growth inhibition) compared to the DMSO controls. The curves of the KRAS mutant Calu-6, BRAF V600E mutant A375, HRAS mutant KNS-62, and the atypical BRAF mutant BxPC-3 cells treated with a paradoxical activator Dabrafenib are displayed here. A population of the cells that were grown under 2D conditions appears in red, and those grown as 3D spheroids are in blue. The solid lines around the data indicate the 95% confidence intervals for each data set. Please click here to view a larger version of this figure.
 Supplemental Figure 1: Dose-response curves comparing the 2D- versus the 3D-compound efficacy in FBS containing media. The dose-response curves demonstrate the compound efficacy compared to the DMSO controls. The curves of the KRAS mutant Calu-6 cells treated with two RAF inhibitors, RAF265 and RAF709, are displayed here as a percentage in the change in cell growth (% growth inhibition) compared to the DMSO control wells. A population of the cells that were grown under 2D conditions appears in red, and those grown as 3D spheroids are in blue. Both conditions use FBS-containing media. The error bars represent standard deviations from 2 individual data sets. Please click here to view a larger version of this figure.
| Cell Line Name | Lineage | BRAF | RAS |
| A-375 | Melanoma | V600E | WT |
| BxPC-3 | Pancreatic | V487-P492>A | WT |
| Calu6 | Non-Small Cell Lung Cancer | WT | KRAS Q61K |
| HCT 116 | Colorectal | WT | KRAS G13C |
| IPC-298 | Melanoma | WT | NRAS Q61L |
| KNS-62 | Squamous Lung | WT | HRAS Q61L |
| NCI-H1299 | Lung | WT | NRAS G12D |
| PANC-1 | Pancreatic | WT | KRAS G12D |
| SKMEL-30 | Melanoma | WT | NRAS Q61K |
Table 1: Cell line information.
Discussion
The methods presented here demonstrate a detailed protocol on how to produce tumor spheroids in 1536-well plates for large-scale compound screenings. These methods were initially adapted from work at the National Cancer Institute where tumor spheroids were grown in low- throughput assays in 6-well and 96-well plates to ask questions about genetic dependencies and compound sensitivity13,14,15. A critical and unique feature of this protocol is that the spheroids are formed from traditional 2D tissue-cultured cells in 1536-plates using defined media referred to as SCM+KO+ITS. Once the cells are seeded in, they are sealed with breathable adhesive plate seals to prevent any evaporation over the duration of the 3 d spheroid formation. Spheroids can also be cultured for longer periods of time using this approach16. After 3 d of sphere formation, compounds are added for 5 d before assaying the changes in cell growth with a lytic-based proliferation reagent. After normalization to the control wells and calculation of IC50s between cells cultured in 2D vs. 3D, the changes in the compound-treated cells are compared to the control-treated cells.
Since the 1536-well plates are regular tissue-treated plates and not hydrogel-coated or cell-repellent plates, a limitation of this protocol is the use of the defined medium, which is a critical factor to the successful execution of this protocol. The KO serum replacement was initially tested for its ability to successfully aid in the growth of embryonic stem cells in 3D17 and in this protocol has been adapted for the growth of many tumor spheroid lines13,15,18,19. To note is that, although the media conditions are different for the growth of the 2D cells versus the 3D spheroids, we have previously demonstrated that the differential effects of drug sensitivity are mediated by the growth format, and not simply the differences in media composition9.
To ensure the success of this protocol, as a troubleshooting step, it is suggested that a series of assay development experiments are first carried out to optimize each cell line before embarking on a large-scale screen. In this example, all of the cell lines assayed were first evaluated to determine if they could be seeded at the same starting density of 500 cells per well. They were then assayed with DMSO-only plates to examine standard deviations (SD) and coefficients of variance (CVs) for the duration of the growth period. Even with this assay development in place, certain lines grew faster than others, and it would have been beneficial to further optimize the seeding densities and the duration of the experiment of these more challenging lines. Finally, the data presented here demonstrate that there is a tendency, rather than a universal phenomenon, for certain cell lines like the NSCLC line Calu-6 to be uniquely more sensitive to compounds targeting the MAPK pathway in 3D compared to those grown in 2D. Additional experiments are underway to determine what biological mechanisms might be contributing to regulating this striking difference in sensitivity.
The ability to screen spheroids in an ultra-HTS setting allows 3D cultures to be used early on in the drug discovery process and may enable the identification of novel chemical matter that is only active in a 3D setting. With so many clinical candidates never reaching the market due to a lack of efficacy in patients, albeit demonstrating growth inhibition in vitro and regression in vivo, teams have started questioning whether implementing 3D assays could bridge this gap earlier during the discovery process. A number of different plate types exist to culture cells in 3D when using 96-well or 384-well methods. Here, we have presented 1536-well methods which produce multiple foci of individual spheroids. In the future, these findings could be compared to similar screens using new technologies which are under development such as 1536-well plates which could grow cells as hanging drops, or plates which are coated with hydrogel/Matrigel and that are round-bottom, which would allow for the formation of one sphere per well. These conditions would introduce additional layers of complexity to the culture conditions used for screening, making them even more physiologically relevant, and could potentially represent an increased rate of translation from bench to bedside for novel therapies. These technologies would also enable scientific questions involving hypoxia or diffusion gradients, which require the use of larger spheroids.
The methods presented here focus on screening these spheroids against a small molecule library of compounds. In the future, these methods could expand to screen for novel biologics and biotherapeutics such as bi-specific antibodies or antibody-drug conjugates, where 3D cultures may provide more physiologically relevant antibody-antigen interactions. In addition, the use of 3D spheroids may be critical to developing disease-relevant assays for understanding targets and interventions in the emerging immuno-oncology space21.
Disclosures
The authors are employees of Novartis, and some employees are also stockholders.
Acknowledgments
The authors would like to acknowledge Marc Ferrer at the National Center for Advancing Translational Sciences, National Institutes of Health for his support and guidance on the initial development of these assays. In addition, we would like to thank Alyson Freeman, Mariela Jaskelioff, Michael Acker, Jacob Haling, and Vesselina Cooke for their scientific input and discussion as project team members.
References
- Lee M, Vasioukhin V. Cell polarity and cancer--cell and tissue polarity as a non-canonical tumor suppressor. Journal of Cell Science. 2008;121(Pt 8):1141–1150. doi: 10.1242/jcs.016634. [DOI] [PubMed] [Google Scholar]
- Nath S, Devi GR. Three-dimensional culture systems in cancer research: Focus on tumor spheroid model. Pharmacology & Therapeutics. 2016;163:94–108. doi: 10.1016/j.pharmthera.2016.03.013. [DOI] [PMC free article] [PubMed] [Google Scholar]
- Weigelt B, Ghajar CM. The need for complex 3D culture models to unravel novel pathways and identify accurate biomarkers in breast cancer. Advanced Drug Delivery Reviews. 2014;69:42–51. doi: 10.1016/j.addr.2014.01.001. [DOI] [PMC free article] [PubMed] [Google Scholar]
- Li Q, Chow AB, Mattingly RR. Three-dimensional overlay culture models of human breast cancer reveal a critical sensitivity to mitogen-activated protein kinase kinase inhibitors. The Journal of Pharmacology and Experimental Therapeutics. 2010;332(3):821–828. doi: 10.1124/jpet.109.160390. [DOI] [PMC free article] [PubMed] [Google Scholar]
- Li L, Lu Y. Optimizing a 3D Culture System to Study the Interaction between Epithelial Breast Cancer and Its Surrounding Fibroblasts. Journal of Cancer. 2011;2:458–466. doi: 10.7150/jca.2.458. [DOI] [PMC free article] [PubMed] [Google Scholar]
- Pickl M, Ries CH. Comparison of 3D and 2D tumor models reveals enhanced HER2 activation in 3D associated with an increased response to trastuzumab. Oncogene. 2009;28(3):461–468. doi: 10.1038/onc.2008.394. [DOI] [PubMed] [Google Scholar]
- Nyga A, Cheema U, Loizidou M. 3D tumour models: novel in vitro approaches to cancer studies. Journal of Cell Communication and Signaling. 2011;5(3):239–248. doi: 10.1007/s12079-011-0132-4. [DOI] [PMC free article] [PubMed] [Google Scholar]
- Kimlin LC, Casagrande G, Virador VM. In vitro three-dimensional (3D) models in cancer research: an update. Molecular Carcinogenesis. 2013;52(3):167–182. doi: 10.1002/mc.21844. [DOI] [PubMed] [Google Scholar]
- Mathews Griner LA, et al. Large-scale pharmacological profiling of 3D tumor models of cancer cells. Cell Death & Disease. 2016;7(12):e2492. doi: 10.1038/cddis.2016.360. [DOI] [PMC free article] [PubMed] [Google Scholar]
- Polo ML, et al. Responsiveness to PI3K and MEK inhibitors in breast cancer. Use of a 3D culture system to study pathways related to hormone independence in mice. PLoS One. 2010;5(5):e10786. doi: 10.1371/journal.pone.0010786. [DOI] [PMC free article] [PubMed] [Google Scholar]
- Hatzivassiliou G, et al. RAF inhibitors prime wild-type RAF to activate the MAPK pathway and enhance growth. Nature. 2010;464(7287):431–435. doi: 10.1038/nature08833. [DOI] [PubMed] [Google Scholar]
- Bhargava A, et al. Registered report: RAF inhibitors prime wild-type RAF to activate the MAPK pathway and enhance growth. Elife. 2016;5:e09976. doi: 10.7554/eLife.09976. [DOI] [PMC free article] [PubMed] [Google Scholar]
- Mathews LA, Hurt EM, Zhang X, Farrar WL. Epigenetic regulation of CpG promoter methylation in invasive prostate cancer cells. Molecular Cancer. 2010;9:267. doi: 10.1186/1476-4598-9-267. [DOI] [PMC free article] [PubMed] [Google Scholar]
- Mathews LA, Crea F, Farrar WL. Epigenetic gene regulation in stem cells and correlation to cancer. Differentiation. 2009;78(1):1–17. doi: 10.1016/j.diff.2009.04.002. [DOI] [PMC free article] [PubMed] [Google Scholar]
- Mathews LA, et al. Increased expression of DNA repair genes in invasive human pancreatic cancer cells. Pancreas. 2011;40(5):730–739. doi: 10.1097/MPA.0b013e31821ae25b. [DOI] [PMC free article] [PubMed] [Google Scholar]
- Mathews LA, et al. A 1536-well quantitative high-throughput screen to identify compounds targeting cancer stem cells. Journal of Biomolecular Screening. 2012;17(9):1231–1242. doi: 10.1177/1087057112458152. [DOI] [PMC free article] [PubMed] [Google Scholar]
- Horii T, Nagao Y, Tokunaga T, Imai H. Serum-free culture of murine primordial germ cells and embryonic germ cells. Theriogenology. 2003;59(5-6):1257–1264. doi: 10.1016/s0093-691x(02)01166-4. [DOI] [PubMed] [Google Scholar]
- Sun L, et al. Epigenetic regulation of SOX9 by the NF-kappaB signaling pathway in pancreatic cancer stem cells. Stem Cells. 2013;31(8):1454–1466. doi: 10.1002/stem.1394. [DOI] [PMC free article] [PubMed] [Google Scholar]
- Mathews LA, et al. A 1536-well quantitative high-throughput screen to identify compounds targeting cancer stem cells. Journal of Biomolecular Screening. 2012;17(9):1231–1242. doi: 10.1177/1087057112458152. [DOI] [PMC free article] [PubMed] [Google Scholar]
- Mathews Griner LA, et al. High-throughput combinatorial screening identifies drugs that cooperate with ibrutinib to kill activated B-cell-like diffuse large B-cell lymphoma cells. Proceedings of the National Academy of Sciences of the United States of America. 2014;111(6):2349–2354. doi: 10.1073/pnas.1311846111. [DOI] [PMC free article] [PubMed] [Google Scholar]
- Herter S, et al. A novel three-dimensional heterotypic spheroid model for the assessment of the activity of cancer immunotherapy agents. Cancer Immunology, Immunotherapy. 2017;66(1):129–140. doi: 10.1007/s00262-016-1927-1. [DOI] [PMC free article] [PubMed] [Google Scholar]


