

Summary
The ability to directly uncover the contributions of genes to a given phenotype is fundamental for biology research. However, ostensibly homogeneous cell populations exhibit large clonal variance1,2 that can confound analyses and undermine reproducibility3. Here, we used genome-saturated mutagenesis to create a biobank of over 100,000 individual haploid murine embryonic stem cell (mESC) lines targeting 16,950 genes with genetically bar-coded, conditional and reversible mutations. This Haplobank is the largest resource of hemi-/homozygous mutant mESCs to date and is available to all researchers. Reversible mutagenesis overcomes clonal variance by permitting functional annotation of the genome directly in sister cells. We utilize Haplobank in reverse genetic screens to investigate the temporal resolution of essential genes in mESCs, and to identify novel genes that control sprouting angiogenesis and blood vessel lineage specification. Further, a genome-wide forward screen with Haplobank identified PLA2G16 as a host factor required for cytotoxicity by rhinoviruses, which cause the common cold. Thus, Haplobank clones and revertible technologies enable high-throughput, reproducible functional annotation of the genome.
Approaches to functionally analyze the mammalian genome include ENU mutagenesis4, gene targeting5, RNA interference6,7, and CRISPR-mediated genome editing8. Although powerful, these approaches suffer from various caveats, such as poor knockdown efficiency and off-target effects9–11. Additionally, clonal variability within populations can compromise comparisons and reproducibility3,12,13,14. Thus, reversibile mutations enabling direct comparison of phenotypes within a single clone are pivotal to study genetic dependencies.
To generate a conditional mutagenesis system at a genome-wide scale and at the clonal level, we applied insertional mutagenesis with genetically bar-coded lentiviral-, retroviral- 15,16 and transposon [Tol2 17 and Sleeping beauty (SB)18]-based vectors in haploid murine embryonic stem cells (mESCs, Fig. 1a), which enable recessive genetics. We analyzed several parthenogenic haploid mESC lines (Extended Data Fig. 1a,b) and chose to pursue AN3-12 cells (Extended Data Figs. 1c-f, 2 and 3). Insertional mutagenesis permits the integration of invertable splice acceptors, resulting in conditional alleles, as well as high-throughput direct identification of integration sites. To map insertion sites and complex internal bar-codes (>107) by inverse PCR, an optimized universal sequencing strategy was established (Extended Data Fig. 4a,b). A combination of strategies was used to avoid genomic biases of the insertional mutagenesis systems (Fig. 1a,b; Extended Data Figs. 4a-f and 5a, reviewed in19,20), yielding genome-wide mutagenesis (Fig. 1c). Of note, Tol2 outperformed the classical viral delivery systems and even in silico mutagenesis at <1 million integrations (Fig. 1c). The mutagenesis systems also generated anti-sense and intergenic integrations at high frequency due to cryptic transcriptional start sites (Extended Data Fig. 5b,c), however this is not expected to affect disruption of transcription in sense oriantation. Thus, we utilized various delivery systems to obtain unbiased, genome-saturated, and conditional mutagenesis.
Figure 1. A repairable mutant mES cell library.

a) Schematic representation of insertional mutagenesis vectors: Splice acceptor sites (SA) are revertible using non-compatible loxP/lox5171 and FRT/F3 sites (triangles). G418 resistance is conferred by beta-Geo (bgeo) transcribed from the revertible cassette (gene trap vectors, GT) or Neo independently from a PGK promoter (polyA trap, pA), stabilized by a splice donor (SD). Six osteopontin enhancer (OPE) elements (enhanced gene trap; Lenti-ETG, Retro-EGT, and Tol2-EGT vectors) enhance expression of beta-Geo via Oct4/Pouf51 binding. RetroRS carries a spacer sequence between loxP sites and lacks OPEs. Purple diamonds indicate internal barcodes (BC). LTR, long terminal repeats; L200/R175 and LITR/RITR, terminal repeats of Tol2 and SB. b) Heat map representing numbers of integrations per gene per 1 million integrations. Gene expression levels are shown (blue=highly expressed, white=not expressed). Color code shows numbers of integrations. c) Saturation of mutagenesis systems compared to random in silico mutagenesis. Y-axis, total numbers of insertions versus % of genes with integrations. d) Schematic representation of splice acceptor inversions. e) Loss of mESC adhesion in clones with integrations in intron 1 of Ctnna1. Inversion of the gene trap restores cell adhesion, subsequent reversion again disruptes adhesion. Phalloidin images polymerized actin; DAPI visualizes nuclei. Size bars, 10 μm. One representative experiment out of 2 biological replicates is shown.
Next, we developed a high-throughput pipeline to create a biobank of reversible mutations in AN3-12 haploid mESCs. Starting from haploid mESC pools that contained between 107-108 distinct mutations for each mutagen, we arrayed, processed, banked, and mapped over 100,000 individual mESC clones (Extended Data Fig. 6). In total, we generated sense and anti-sense clones that target 16,970 of ~ 24,000 annotated mouse genes (genome release mm10), covering over 70% of the protein-coding genome (Extended Data Table 1 and Extended Data Fig. 7). Integrations display a 5’ bias in genes and in coding sequence (Extended Data Fig. 8), resulting in truncations that are likely to generate loss-of-function alleles. All pools of mutated cells and clones were deposited to Haplobank, and all mapping information, expression levels, and quality control measures can be accessed at www.haplobank.at. A complete collection of cell culture and molecular protocols was submitted to Nature Protocol Exchange and is available as Supplementary file. This resource represents a comprehensive library of mESC clones carrying hemi/homozygous, twice reversible, bar-coded integrations, combining the power of stem cells with tunable mutagenesis.
A key advantage of Haplobank is the ability to compare each mESC clone with its sister clone carrying the conditionally inverted splice acceptor. As a proof-of-principle, we analyzed two mESC clones containing sense integrations within Ctnna1, which encodes alphaE-catenin and is critical for mESC adhesion21. mESCs with sense integrations exhibited reduced Ctnna1 expression and impaired cell adhesion, which were both restored by FlpO-mediated reversal of the integrated mutagenesis vectors. Further, Cre-mediated reversal back into the sense orientation again disrupted alphaE catenin-mediated cell adhesion (Fig. 1d,e). Additionally, we evaluated mESC lines carrying non-disruptive, anti-sense integrations in presumed essential genes. We infected these mESC lines with a pool of retroviruses that encode Cre and mCherry, or GFP only. If a gene is essential, Cre-mediated reversion of the integration to the disruptive sense orientation should specifically deplete mCherry+ cells from the mCherry+/GFP+ cell pool over time, as detected by flow cytometry. Indeed, we confirmed the essential role of several genes for mESC survival (Fig. 2a, b). Thus, our system allows for a direct functional annotation of essentiality, instead of screening for the absence of mutations; moreover, one can directly examine the penetrance and timing of lethal phenotypes.
Figure 2. Essential genes for mESC and common cold virus infections.

a,b) Functional annotation of essential mESC genes. a) Competitive growth assays of anti-sense (GFP+) and Cre-reverted sense (mCherry+) sister cells harboring integrations in the indicated genes. Cell populations were analyzed at the indicated days after Cre addition using flow cytometry. Means +/- SD of biological triplicates. b) FACS plots for the essential gene Psmd1 illustrating depletion of Cherry+ cells. c) Integration sites of top scoring genes in our haploid mESC survival screen of human rhinovirus RV-A1a infections. Loss of function score for integrations into the Ldlr locus p=2.9x10¹² and p=1.4x10¹¹ for Pla2g16. Sense integrations, red triangles; anti-sense integrations, green; exons, blue boxes. Transcriptional start sites are marked. d) Growth advantage of sense versus respective anti-sense sister mESC harboring integrations in Pla2g16 or Ldlr upon infection with RV-A1a. In un-infected cells, mutation of these genes did not confer growth advantages; arbitrarily set to 1. e) Human embryonic kidney HEK293T cells were transduced with 4 different sgRNAs against PLA2G16 and LDLR in biological triplicates, mixed with control GFP+ HEK293T cells at a ratio of 1:3. Ratios of control to mutated HEK293T cells were evaluated on day 13 after infection using FACS. Data in d and e are means +/- SD, normalized to uninfected cells. Individual data points and error bar (STDEV); one tailed students t-test, *< 0.1, **< 0.01, ***< 0.001. f) Targeting of the C-terminal Pla2g16 domain using CRISPR/Cas9. Upon selection of haploid cells to ensure hemizygous editing, cells were split and maintained in the presence and absence of RV-A1a.
Next, we performed a genome-wide screen to uncover novel hits for resistance against infection with a common cold virus. We chose the rhinovirus serotype RV-A1a, which replicates in mouse cells22. A pool of mESCs carrying gene trap insertions was exposed to rhinovirus every other day for 3 weeks. The surviving, virus-resistant cells displayed an enrichment for multiple disruptive insertions in the low density lipoprotein receptor (Ldlr), a known entry portal for this virus (p-value=2.9*10-12), and in the phospholipase Pla2g16 (p-value=1.4*10-11) (Fig. 2c). We confirmed that these genes are required for viral killing using three different sister clones with revertible integrations (Fig. 2d). Next, we used CRISPR-Cas9 technology to disrupt these genes in human embryonic kidney (HEK293T) cells and monitored competitive proliferation with and without RV-A1a infection. In this assay, LDLR was not required for RV-A1a-mediated killing (Fig. 2e), presumably because the virus can enter via other receptors in the absence of functional LDLR in HEK293T cells23. Importantly, we confirmed that inactivation of PLA2G16 with different sgRNAs confers a selective survival advantage to HEK293T cells exposed to RV-A1a (Fig. 2e). Thus, Haplobank enables genome-saturated forward screening and validation to discover novel genes underlying specific phenotypes.
PLA2G16 can catalyze the rate limiting step of arachidonic acid synthesis, and thus couples to cyclooxygenases (COX) and prostaglandin synthesis24,25. However, different COX inhibitory drugs did not block RV-A1a-mediated cell death of control or repaired Pla2g16 sister mESCs, nor did arachidonic acid enhance RV-A1a toxicity (Extended Data Fig. 9a). Selective survival of Pla2g16 or Ldlr mutant mES cells was not affected by COX inhibitors (Extended Data Fig. 9b). Of note, the COX inhibitory drugs ibuprofen and indomethacin conferred partial resistance to RV-A1a in HEK293T cells (Extended Data Fig. 10), albeit at concentrations that also affect other pathways26. Structurally, the short C-terminal vesicular domain of PLA2G16 extends into the endosomal lumen where the virion is located prior to releasing its RNA (Fig. 2f)27. To test the relevance of this domain, we edited the Pla2g16 coding region in the endosomal C-terminus and 3’UTR using CRISPR/Cas9 and selected for RV-A1a resistant cells. Mutations conferring resistance to RV-A1a were enriched in the transmembrane domain and the vesicular domains (Fig. 2f; Extended Data Fig. 11), consistent with a recent, independent haploid screen that identified PLA2G16 in picorna viridae infection28. Our results identify the C-terminal domain of Pla2g16 is a target to block rhinoviral infections.
As a third application of Haplobank, we investigated pathways required for angiogenesis29. Multiple candidate angiogenesis genes have been proposed, but few have been functionally validated30,31. We adapted embryoid body (EB) blood vessel sprouting, which recapitulates key features of in vivo angiogenesis32, to our haploid mESCs. Sprouts stained positive for the endothelial marker CD31 and the basal membrane protein collagen IV, and formed lumens (Fig. 3b). Similar to in vivo blood vessel formation, the cells fronting the vascular structures exhibited characteristic features of tip cells, such as CD31-positive filopodia protrusions followed by stalk cells (Fig. 3b). Tip cells express Delta like ligand 4 (Dll4), which activates the Notch1 pathway on stalk cells to suppress their conversion into tip cells33. We used Notch1 anti-sense non-disruptive clones from Haplobank and, via Cre recombination, created stable sister, sense clones that knock-out Notch1 expression (Extended Data Fig. 12a). EBs derived from multiple sense, knock-out sister clones displayed significantly increased vessel density (Extended Data Fig. 12b and not shown). Gene trap integration upstream of the Notch1 gene did not alter vessel density (Extended Data Fig. 12c). Thus, our EB sprouting assay recapitulates normal blood vessel development.
Figure 3. Novel regulators of angiogenesis.

a, Generation of sprouting vasculature from haploid mESCs, differentiated into Embryoid Bodies (EBs) and cultured with VEGF-A (30ng/mL). b, CD31+ (green) endothelial cells and filopodia, indicative of tip cells in blood vessel sprouts. Luminal structures and Collagen IV+ basement membranes are shown in right panels. Scale bars, 200μm or as indicated. c, Schematic outline for functional validation of candidate genes in sprouting angiogenesis. Haplobank clones were infected with GFP or mCherry-Cre viruses to generate disruptive sense (S) and anti-sense (AS) sister cells. d, Representative images of hypo- and hyper-sprouting sense (S) and anti-sense (AS) sister clones. IB4 marks endothelial cells. Scales, 500μm. e, Quantification of IB4+ blood vessel sprouts. Data were normalized to the respective anti-sense sister clones. Means ± SEM are shown from a minimum of n=3 independent experiments. *<0.05; **< 0.01; ***< 0.001 (Two tailed students t-test).
To identify novel genes, we selected candidates that are more highly expressed in tip versus stalk cells30,31 and were associated with human vascular disease (Extended Data Fig. 13a). We focused on 32 genes,represented in Haplobank. To ensure that differences in angiogenesis are directly linked to inactivation of the respective target genes, and not genetic background noise or clonal effects, we performed color tracing. We infected selected mESCs with GFP- or mCherry-Cre expressing retroviruses to generate sister clones with reverted orientation of the integration (Fig. 3c). We observed large variability between independent clones (Extended Data Fig. 13b,c), highlighting the importance of comparing mutant to genetically repaired sister clones for each gene. Genetic inactivation of Myst3, Mecom, Gja1, Gabrb3, Tnfrsf1a, and Dlg2 reduced sprouting angiogenesis and decreased vessel formation at least 2-fold compared to anti-sense clones; gene trapping of Enpp3, Smarca1, Ndufs4, Plcb1, or Hck promoted blood vessel growth (Fig. 3d,e; Extended Data Fig. 14). Thus, Haplobank enabled rapid, functional and reproducible validation of candidate angiogenesis genes in engineered blood vessels.
To assess the in vivo role of these novel angiogenesis genes, we generated EBs from mESCs stably expressing mCherry and injected them into immuno-compromised mice. The resulting teratomas were assessed for mESC-derived mCherry+ IB4+ blood vessels (Fig. 4a, Extended Data Fig. 15a). To control for teratoma growth rates, we injected 1:1 mixed mosaic EBs of sense (mutant, GFP+) and their respective anti-sense clones (repaired, mCherry+). The contribution of GFP- or mCherry-expressing cells to the endothelial lineage as well as non-endothelial tissues was assessed by cytometry (Extended Data Fig. 15b). Mutated clones of Myst3, Gja1 and Grin2b displayed a decreased contribution to IB4+ vasculature (Fig. 4a; Extended Data Fig. 15b). In contrast, mutant clones that showed increased vessel density in vitro exhibited a greater capacity to form blood vessels in vivo than their anti-sense sister clones (Fig. 4a). These data were confirmed using in situ blood vessel analysis of mixed teratomas (Fig. 4b). To test whether the identified genes modulate angiogenesis via specification of tip cell fate, we performed mosaic tip cell competition assays (Extended Data Fig. 15c,d). As a positive control, we assessed genetic modulation of the Notch1 pathway. As expected, mCherry+ (sense knock-out) Notch1 mutant cells preferentially localized to the tip position compared to GFP+ anti-sense Notch1-expressing sister clones (Fig. 4c,d). Most clones carrying gene mutations that increased sprouting activity displayed a significant increase to the tip cell position, and vice versa (Fig. 4c-e). Therefore, the newly identified angiogenesis genes can control the tip cell fate.
Figure 4. In vivo angiogenesis and cell specifications.

a, Quantification of the indicated sense and anti-sense targeted clones to form blood vessels in teratomas. Means ± SEM are shown (n=3 independent teratomas; n=5 for the AN3-12 control). *< 0.05 (Two tailed students t-test). b, Gja1-sense (GFP+) and Gja1-antisense (mCherry+) sister mES cells were mixed 1:1 to form chimeric EBs and subsequently injected into immunocompromised nu/nu mice. Representative sections to identify IB4, GFP, and mCherry expressing cells are shown. Scale bar 50μm. c, Notch1 anti-sense and mCherry-Cre+ Notch1-sense sister mES cells were mixed (1:1 ratio) to generate mosaic blood vessels and analyzed for red or green cells at the tip position. Scale bar 200μm. d, Relative tip cell position of sister cells with sense and anti-sense integrations in the indicated genes, determined in chimeric 3D sprouts. Means ± SEM of a minimum of n=3 independent experiments. *< 0.05; **< 0.01; ***< 0.001 (Two tailed students t-test). e, Representative image of mosaic blood vessel sprouts from Gja1 sense and anti-sense sister clones. Scale bars, 500 μm and 100 μm (insert). f, Intravenous injection of a Gja1 inhibitory peptide (GAP26) into neonatal mice abrogated retinal angiogenesis. At day 5 after birth, retinas were isolated and stained for IB4+ blood vessels. Scale bars: 500μm upper, 100μm lower panels.
We tested whether one of our novel angiogenesis genes, Gja1, encoding the gap junction protein Connexin43 34, is involved in physiological vascularization of the mouse retina, which begins at birth and progresses until postnatal day 7 35. At postnatal day 6, we observed high Gja1/Connexin43 expression at the angiogenic front where Gja1/Connexin43 localized to endothelial junctions, with the highest intensity in tip cells (Extended Data Fig. 16a). At the vascular plexus, Gja1/Connexin43 expression was predominantly detected in perivascular cells, not endothelial cells (Extended Data Fig. 16b). Moreover, Gja1/Connexin43 was primarily detected at the tip of the developing vascular sprout in 3D blood vessels (Extended Data Fig. 16c). Newborn mice injected i.v. with a Gja1/Connexin43 blocking peptide displayed a delay in vascular network progression and complexity in the retina compared to those injected with a scrambled control peptide36 (Fig. 4f). The number of tip cells at the angiogenic front was decreased, together with decreased numbers of branch points in the vascular plexus (Fig. 4f). Thus, Gja1/Connexin43 is a key regulator of tip cell fate and physiological angiogenesis in vivo.
In summary, the Haplobank resource contains over 100,000 individually mutagenized and bar-coded mESC lines targeting 16,970 protein coding genes. Haplobank complements a collection of 3,396 reversibley targeted genes in a near haploid human leukemia cell line45. Our proof-of-principle experiments uncovering genes required for rhinovirus infection and angiogenesis establish the power of Haplobank in forward and reverse genetic screens, respectively. The strong variability between independent clones revealed the importance of assessing mutant and repaired clones side-by-side, and addresses an increased demand for rigor and reproductibility37. Thus, Haplobank clones and revertible technologies enable high-throughput, reproducible functional annotation of the genome.
Extended Data
Extended Data Figure 1. Properties of the haploid subclone AN3-12.

e-f, Various parthenogenic cell lines derived from independent embryos from an outcross of 129/Sv and C57/B6 and thus containing different genomic background on different chromosomes were subjected to embryoid body formation by placing 1000 cells/hanging drop. We observed downregulation of pluripotency marker genes (a) and upregulation of markers from all three germ layers (b) in all cell lines assayed on day 0 (d0), day 5 (d5) and day 12 (d12). The HMSc2 subclone AN3-12 was chosen for further study based on its growth properties in serum/LIF and absence of feeders. Data is shown as individual data points of n=2 technical replicates together the mean ± SD of one representative experiment. c, Growth curve of AN3-12 in the presence and absence of LIF. Data are shown as individual data points and mean values of 3 biological replicates ± SD. d, FACS analysis of chromosome content of AN3-12 cells (in LIF, same experiment as shown in panel c) shows the decline of haploid (1n) from 35.5% to 24.9% during the 7day culture period. e, AN3-12 cells, cultured as in panel c, maintain a robust haploid population when analyzed on day 17 in ES cell medium despite rapid proliferation. f, Differentiation of AN3-12 cells into keratinocytes resulted in a near complete loss of haploid cells among the Keratin 14 (K14) positive population; ES cells stained with anti-K14 are shown as a negative specificity control (grey curve in the K14 histogram).
Extended Data Figure 2. Analysis of genome integrity.

a, M-FISH karyotypic analysis was performed on parental mouse haploid cells (AN3-12) to evaluate genomic stability. Randomly selected metaphases were karyotyped and examined by M-FISH and DAPI banding. Approximately, 200 metaphases from AN3-12 were counted for the diploid versus haploid frequency and 10 well-spread metaphases were fully karyotyped by M-FISH and DAPI-banding pattern. Images of a normal female diploid and haploid karyotype [19, X] are shown. Images were captured on a Zeiss AxioImager D1 fluorescent microscope equipped with narrow band-pass filters for DAPI, DEAC, FITC, CY3, TEXAS RED, and CY5. b, CNV (copy number variation) analysis of haploid AN3-13 cells by genome sequencing using IlluminaHiSeq2500. Mapped reads were analyzed relative to male genomes of parental mouse strains C57BL/6J and 129/Sv respectively, quotient to closer parental strain is shown. As expected, the X chromosome is overrepresented while the Y chromosome is absent. Regions of detected variation are highlighted with red boxes and shown below. Chromosome numbers are indicated. c, In AN3-12 haploid ES cells three very small deletions (on chromosomes 2, 10, and 12) and 1 duplication (on chromosome 13) were detectable as highlighted. d, Chromosomal distribution of SNP densities for in-house 129/SV and AN3-12 ES cells relative to in-house C57BL/6 are shown. Numbers of SNPs were calculated for all non-overlapping 100 kb windows across the mm10 C57BL/6J mouse reference genome. SNP density in AN3-12 shows regions of high and low number of SNPs relative to the C57BL/6J genome, as expected for a haploid cell line derived from an F1 female between 129/SV and C57BL/6.
Extended Data Figure 3. Differentiation potential of AN3-12 cells.

a, Immunostaining of AN3-12 cells cultured in ES cell medium as well as time course of removal of LIF with addition of 500nM retinoic acid (analysed on the indicated days) shows downregulation of pluripotency markers Oct4, Nanog, as well as Sox2. DAPI is shown as a nuclear counterstain. Bar graphs 50μm b, Histological examination of Teratomas analysed 25 days after injection of 106 cells subcutaneously. All three germ layers were present in 6 analyzed teratomas, representative H&E images are shown. Magnifications are indicated in each panel.
Extended Data Figure 4. Molecular characterization of mutagenesis vectors.

a, Schematic illustration of the universal NGS sequencing strategy. Optimized primer binding sites compatible with Illumina sequencing and 2 restriction enzymes with 4 base pair recognition sites were placed adjacent to the terminal elements (LTR, TR). An internal barcode of 32 bases with alternating weak and strong bases was inserted in a parallel cloning step. b, For mapping of integration sites, genomic DNA was amplified by inverse PCR to introduce adaptor sequences and the experimental index for NGS. Paired-end sequencing maps the genomic integration in the first read using a custom primer, the experimental index as well as the internal barcode using standard Illumina primers binding to the integrated complementary sequence. Barcode (BC) PCR was performed on genomic DNA. c, Meta-analysis of mutagen integrations around transcriptional start sites (TSS) (excluding the precise TSS site). In particular Tol2 and Retrovirus show a preference to integrate in proximity to the TSS. Retroviruses also frequently integrate into the promotor regions, while lentiviral integrations are typically located within the entire gene body. IPKM= Insertions per kilobase per million. The vectors used are described in Fig. 1 legend. d, Distribution of integration sites. Binning the number of integrations in genic and 2kb upstream regions per 10kb windows illustrates pronounced cold spots of mutagenesis using retroviral mutagenesis, where one can observe bins devoid of integrations. e, Genomic region surrounding the Gapdh locus exemplifying the distributions of integrations. While retroviral integrations strongly cluster, Tol2 displays a more uniform distribution of integration sites. Tracks are + strand (top) and – strand (bottom) integration sites. Bar lengths indicate NGS read numbers, subsequent to iPCR. f, Heat map illustrating overlap of epigenetic histone marks with integrations of the indicated mutagens, normalized to peak size. Only retrovirus and Tol2 integrations strongly correlate with DNA accessibility determined by ATACseq and active marks such as H3K4me3 and H3K27ac. In silico mutagenesis is shown as a control.
Extended Data Figure 5. Insertional preferences.

a, Correlation of integration probabilities (IPKM=insertions per kilobase per million) to expression level (mean log2 of FPKM). Strongest correlation is seen for lentiviral constructs as well as Retro-GT without osteopontin enhancer elements. All mutagenesis vectors are described in Fig. 1 and methods. b, 5’RACE on a set of pooled clones with confirmed antisense integration sites revealed multiple spurious transcription initiation sites in the intronic part of the gene trap vector around the lox site, but we failed to detect spliced transcripts. Transcriptional initiation within the lox5171 site is highlighted. Red labelled sequence is marking polyGs used for 5’ tailing. c, Intersection of integration sites of the indicated mutagenesis vectors (see Fig. 1) with genomic features. Coding sequences (CDS), 5’ and 3’ untranslated regions (5’UTR and 3’UTR), 1st Intron, all other introns excluding the first intron (Intron), non-coding exons (ncExon), upstream regions (defined as 2kb upstream of transcriptional start site), and intergenic regions are indicated. Mutagenesis by Piggyback transposons as well as in silico random mutagenesis and ATACseq results are shown for comparison.
Extended Data Figure 6. Generation of the mutant ES cell library.

a, Schematic work flow for generation of the mutant haploid ES cell library. Single cell derived clones were manually picked 10 or 11 days after seeding, expanded in 96 well plates, and either frozen in quadruplicates or further processed for mapping of the integration sites. b, Schematic illustration of the first step of 4D pooling. Each plate was pooled into the respective slice tray as well as a master-plate, uniting identical well coordinates of all plates. c, Schematic illustration of the second step of 4D pooling. Each master-plate was pooled into a master tower pool, a plate with lamella uniting columns, and a plate with lamella uniting columns, thereby generating pools for rows and columns over all samples. d, 4-Dimensional pooling of 9600 clones in 8 rows, 12 columns, 10 slices, and 10 towers resulting in 40 pools. Subsequent to iPCR to introduce experimental indices, pools were combined and deep sequenced. Amplification of internal barcodes confirmed clonal identity and mapping in 4 dimensions. All mapped clones were deposited to Haplobank (www.haplobank.at).
Extended Data Figure 7. Numbers of independent gene trap clones.

a, Numbers of independent available cell lines, carrying a single integration per cell, per gene. For about 37% (RefSeq) to 38% (Ensembl) of genes targeted, there is one gene trap clone available (5’UTR, Intron, or coding sequence), whereas about 18% of genes are targeted in two independent clones, and for ~ 43% of genes 3 or more independent clones are available. b, 24.8% (RefSeq) to 26.8% (Ensembl) of genes are represented by a single cell line if one takes all clones into account and about 40% of genes are hit in more 3 or more clones. c, Separation of all gene traps combined into biotypes in single integration Haplobank clones. Antisense and intergenic insertions are observed in all systems, in particular for enhanced gene trap vectors.
Extended Data Figure 8. Distribution of integration sites relative to coding sequences.
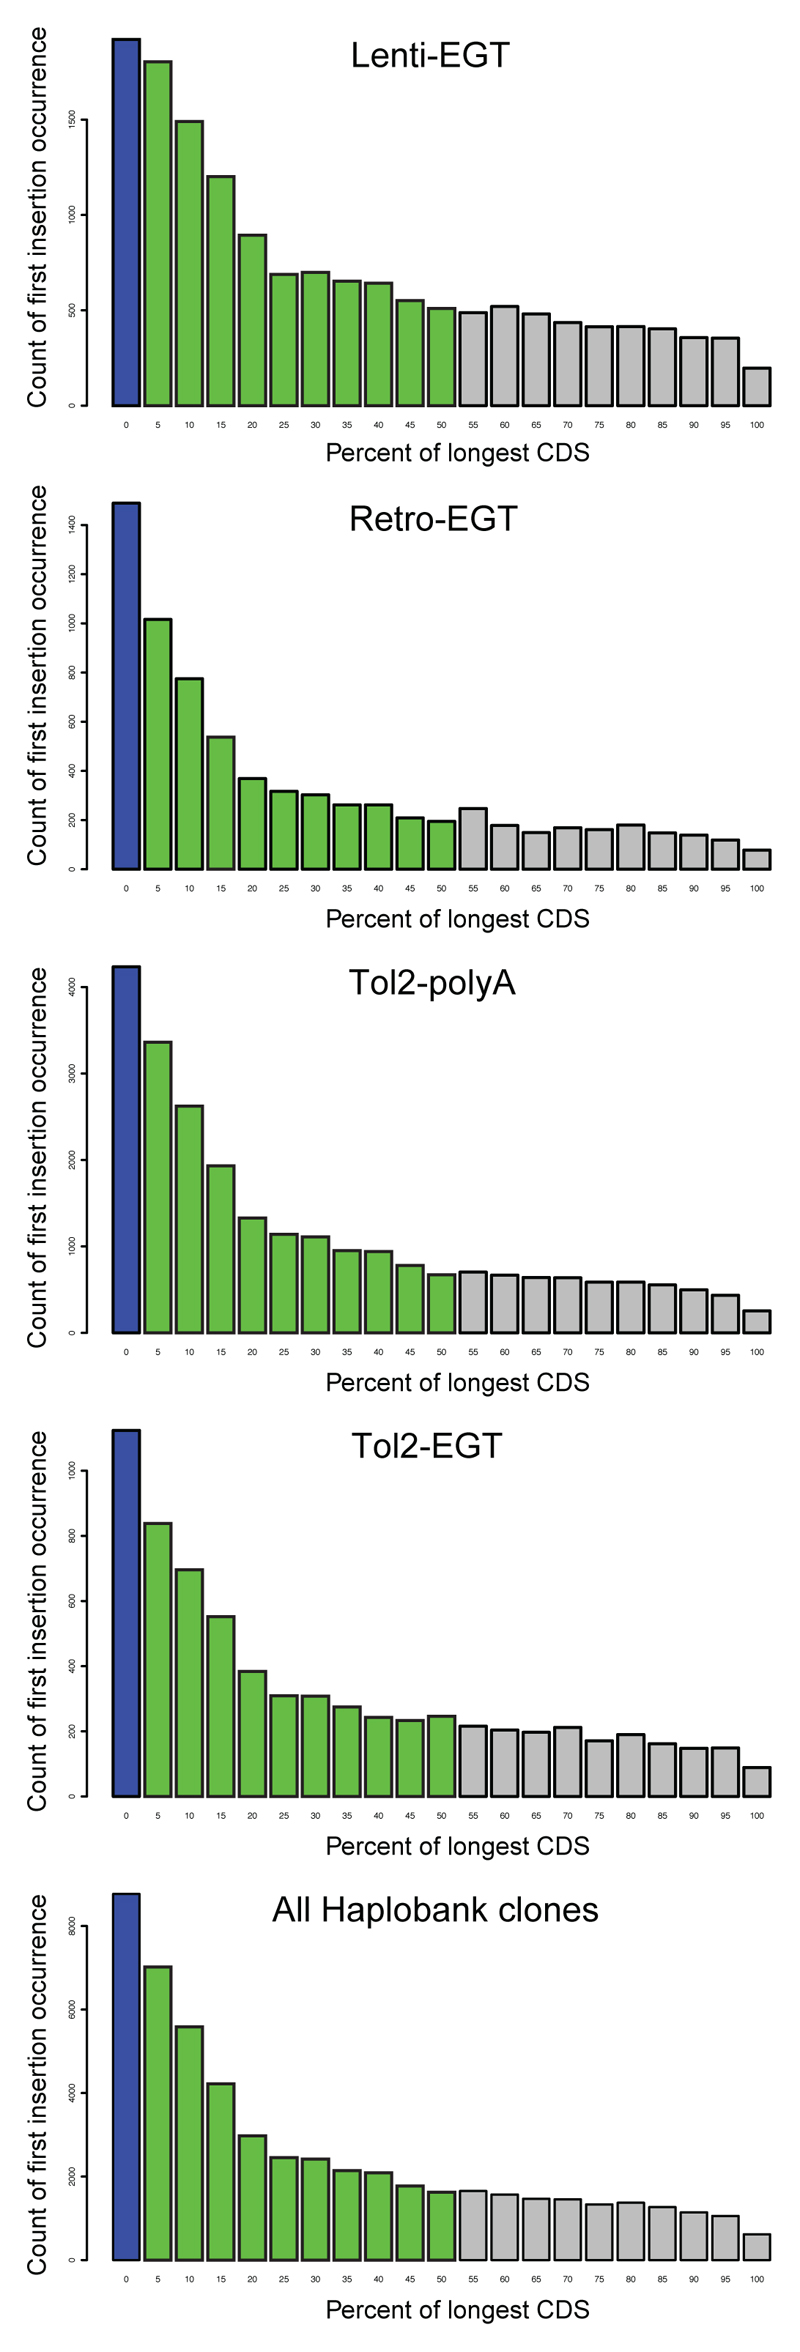
To map the integration sites of our Haplobank clones to the ORFs (open reading frames) of the respective genes dissected ORFs into 5% intervals and annotated integration sites in introns and exons relative to the position within the ORF. All mutagenesis systems (see Fig. 1) show a strong bias towards transcript truncation proximal to the 5’end of the ORFs and are thus predicted to result in loss of function alleles. We defined integrations in the anterior 50% of coding sequence (green bars) as optimal for a gene trap allele; these clones are highlighted by a yellow star on the Haplobank homepage.
Extended Data Figure 9. Interaction of Pla2g16 with Cox inhibitors in mouse ES cells.

a, Titration series of the indicated Cox inhibitors in the presence and absence of rhinovirus (RV-A1a) in mouse ES cells. No protective effect of inhibition of prostaglandin biosynthesis was detected at non-toxic concentrations. Since ES cells do not generate infectious RV-A1a efficiently, conditioned supernatant containing RV-A1a was added daily. Data is shown as individual data points and mean values. b, Haplobank ES cell clones harboring mutations in Ldlr and Pla2g16, respectively, were mixed as sister cells in sense (red) and antisense (green) orientation labelled by GFP and mCherry. Subsequently, cells were cultured in the presence and absence of rhinovirus RV-A1a for 4 days and ratios were then quantified using FACS. Selection pressure for loss of Ldlr and Pla2g16 was not affected by inhibition of Cox. Data is shown as mean of 3 biological replicates, error bars represent SD.
Extended Data Figure 10. Interactions of PLA2G16 with Cox inhibitors in human HEK293T cells.

a, RV-A1a exposure causes cell death in HEK293T cells in a dose dependent manner. Cell viability was quantified 3 days after infection by Alamar blue cell viability measurement. Data is shown as individual data points of 5 biological replicates and mean values. b, Titration series for ibuprofen and indomethacin treatment in the presence and absence of rhinovirus (RV-A1a) in human embryonic kidney HEK293T cells. Protective effects of ibuprofen and indomethacin were detected at high concentration. Cell viability was quantified 2.5 days after infection by Alamar blue cell viability measurement. Data is shown as individual data points of 4 biological replicates and mean values. c, Competitive growth assays in HEK293T cells. Cells containing sgRNAs targeting PLA2G16 did not show a growth difference in the absence of RV-A1a or when treated with indomethacin at 100μM, but were significantly enriched when challenged with RV-A1a, indicting preferential survival. By contrast, control guide treated cells did not show growth advantages at any experimental condition. Data are shown as individual data points and mean values +/- SD of biological triplicates analysed on days 0, 3, 6, and 10 after RV-A1a exposure.
Extended Data Figure 11. Pla2g16 domain mapping in rhinovirus infections.

a, Scheme of Pla2g16 domains. The enzymatic center of Pla2g16 is located in the cytoplasm (green); an alpha-helix in the transmembrane domain (yellow) connects it to a short vesicular domain (blue), located in endosomes14. b, Design of CRISPR sgRNAs targeting the mRNA regions encoding the vesicular domain of 7 amino acids (sgRNA1) and the 3’UTR (sgRNA2) in haploid ES cells to test essentiality of these domains in RV-A1a infections. c, Cells carrying sgRNA2 showed editing in only 1/12 cases, but upon selection with RV-A1a were enriched for deletions within the vesicular domain. For sgRNA2, all mapped deletions in control cells only affected the 3’UTR, where the expected Cas9 cuts occur; upon RV-A1a exposure, the majority of observed deletions affected the transmembrane domain, the vesicular domain, and in some cases even extended into the cytoplasmatic region. Color codes: Grey: deletion; Red: alternative reading frame and insertions.
Extended Data Figure 12. Increased blood vessel sprouting in Notch1 mutant ES cells.

a, Assessment of 4 independent Notch1 targeted clones from Haplobank. The locations of the integrations are shown: 2 anti-sense (as) clones marked by green triangles, 1 sense (s) clone marked by the red triangle, and one clone with an upstream (as-up) integration (blue triangle). Flipping of the gene traps upon Cre infection is shown by PCR in the middle panel. Loss of Notch1 protein (intracellular domain, ICD) expression (clones A4, H7), and re-expression (clone D5) upon Cre recombination are shown by Western blot (lower panel). β-actin is shown as a loading control. WT, parental clone without any gene trap integration. b, Notch1 inactivation leads to a hyper-sprouting phenotype. Note the advanced progression and increased density of the vascular networks upon Notch1 deletion (sense clone) compared to anti-sense sister cells (upper panels – bright field images, lower panels IB4 immunostaining to mark endothelial cells). Scale bars 500μm. c, Angiogenic sprouting is not affected when the gene trap is located 1500bp upstream of the Notch1 gene (A2 clone). For molecular characterization of the A2 clone see Extended Data Fig. 12. GFP+ and Cre-reverted mCherry+ sister cells were analyzed in 3D blood vessel organoid cultures. Bright field images are shown. Scale bars 500 μm.
Extended Data Figure 13. Candidate tip cell genes and clonal variability.

a, Differentially expressed genes in endothelial tip cells versus stalk cells from two published datasets15,16 in the murine retina were filtered for genes that have also been associated (Ingenuity pathway analysis) with candidate genes/pathways for vascular diseases in humans. Scatterplot showing the frequency of independent associations of “tip cell genes” with various human vascular diseases. Genes available at Haplobank at the beginning of the project were chosen for functional analysis in the 3D organoids. For most of the listed candidate genes, there were no functional vascular data available. b, Quantification of IB4 positive vascular structures from the indicated sister clones carrying sense and repaired antisense integrations. Clones were classified according to their sprouting capacity from low (hypo-sprouting) to high (hyper-sprouting).Data are shown as individual data points from a minimum of n=3 independent experiments for each sense/antisense sister clone combination together with the mean values ± SEM. * P < 0.05; ** P < 0.01; *** P < 0.001 (Two tailed students t-test). c, Different clones with independent integrations in the same gene showed reproducible phenotypes in sprouting angiogenesis. Vascular outgrowths were stained for endothelial specific IB4 expression, number of vessels counted and normalized to the respective anti-sense sister clones. Data are shown as individual data points from a minimum of n=3 independent experiments for each sense/antisense sister clone combination together with the mean values ± SEM. * P < 0.05; ** P < 0.01; *** P < 0.001 (Two tailed students t-test).
Extended Data Figure 14. Sprouting angiogenesis in revertible sister clones.

Representative images of the indicated sense (S) and anti-sense (AS) sister clones. IB4 was used to mark endothelial cells. GFP or mCherry expression indicates the respective flipped gene traps. Note that some sense clones are GFP+ while others are mCherry+; this is due to the original orientation of the integration in sense or anti-sense, which was then reverted by the mCherry-Cre expressing virus. Scale bars for all images is 500μm. For quantification of data see Fig. 3e.
Extended Data Figure 15. Generation of a chimeric vasculature in vivo.

a, Representative fluorescence image of a haploid ES cell-derived teratoma stained for endothelial specific IB4. Endothelial cells arising from haploid ES cells are positive for mCherry and IB4 (yellow), whereas host endothelial cells are only positive for IB4 and appear green. Scale bars 50 μm. b, Representative FACS analysis of teratomas following injection of chimaeric EBs into immunocompromised mice. Myst3 anti-sense (mCherry+) and sense (GFP+) sister clones were mixed at a 1:1 ratio. VE-Cadherin-negative non-endothelial cells were also determined within the teratomas. c, Parental haploid ES cells stably expressing GFP or mCherry-Cre were assessed for their ability to generate IB4+ vascular structures in the presence of VEGF-A. The number and ratios of IB4+ vessels per organoid were not apparently different between GFP and mCherry-Cre expressing cells. Scale bars 500μm. Data are shown as individual data points from n=4 independent experiments mean values ± SEM. P=0.207 (Two tailed students t-test). d, GFP and mCherry-Cre expressing parental haploid ES cells contribute equally to tip cells (49.2 % GFP+; 50.8 % mCherry-Cre+) in 1:1 mixed mosaic cultures. Data are shown as individual data points from of n=4 independent experiments together with the mean values ± SEM. P=0.823 (Two tailed students t-test).
Extended Data Figure 16. Gja1/Connexin43 localizes to tip cells in the developing mouse retina and in ES cell-derived 3D blood vessels.

a, Localization of Gja1/Connexin43 protein in the murine retina at postnatal day 6 (P6). Endothelial cells are marked by IB4 staining. At the angiogenic front, Gja1/Connexin43 expression is found in endothelial cells, primarily localized at tip cells (arrows). Scale bars 50μm. b, Retinas were stained for Gja1/Connexin43 protein expression and the endothelial marker IB4 to visualize the vascular networks on postnatal day 6 (P6). Note punctate pattern of Gja1/Connexin43 adjacent to the IB4+ vessels, suggestive of Gja1/Connexin43 expression in perivascular cells. Scale bars 50 μm. c, Gja1/Connexin43 protein predominantly localizes to the tip cells (arrows) in our 3D blood vessels. Vessels are marked by CD31 immunostaining and counterstained by DAPI. Bar graph indicates percentages of vessels with highest Gja1/Connexin43 expression in the tip cell; Data is shown as individual data points of 8 independent EBs together with the mean values ± SD of vessels. Scale bars upper panels 20μm, lower panels 10μm.
Extended Data Table 1. Haplobank clones.
Numbers of clones available with respect to different mutagens, orientation of the inserted gene trap to gene transcription, as well as the number of different genes hit. A gene is defined as the genomic region between the transcriptional start and stop sites. www.haplobank.at (Please access as User: BetaForReviewer; password: ready2GoLive).
Supplementary Material
Supplementary information is available in the online version of the paper.
Acknowledgments
We thank all members of our laboratories, IMBA/IMP and VBCF services for support and Life Science Editors for assistance. We thank Britta Knapp, Ireos Filipuzzi, and Thomas Aust for clone picking, N. Rao Movva and Tewis Bouwmeester (NIBR) for support, and Kristina Handler for the differentiation protocols. Haplobank is generously funded by Nestlé Institute of Health Science NIHS, the Austrian National Bank (OeNB), an Advanced ERC grant and Era of Hope/National Coalition against Breast Cancer/DoD (to J.M.P.). U.E. is a Wittgenstein Prize fellow. D.B is supported by FWF P23308-B13. A.S. is supported by an ERC Consolidator Grant, Boehringer Ingelheim, and FFG.
Footnotes
Author Contributions. U.E. generated the haploid library with technical support from An.L., C.H., J.L., M.H., A.-M.H., M.K., N.S., E.W., N.V.D.L, J.M., P.D., D.H., R.R., D.E.. U.E., R.AW and Al.L. characterized cell line. An.L., G.M., U.E., D.B., T.D., T.B., and T.M. performed Rhinovirus work. A.S. wrote bioinformatics algorithms and set-up the Haplobank webpage. S.Z. performed RACE experiments, F.Y. and B.F. karyotyping, C.A.A. supported standardization. J.A.Z.M. and O.B. performed ATACseq. Z.I. advised on mutagenesis vectors. R.A.W., I.A., D.A., Al.L, and H.G. performed blood vessel experiments. U.E. and J.M.P. coordinated the project.
The authors declare no competing financial interests.
Data availability. All genomic data are accessible through GEO accession number GSE84090 (http://www.ncbi.nlm.nih.gov/geo/query/acc.cgi?token=qrgxmuaindmpjah&acc=GSE84090). A detailed methods collection is available as supplementary file and Nature Protocol Exchange. .All protocols and cell lines can be obtained via www.haplobank.at
References
- 1.Cahan P, Daley GQ. Origins and implications of pluripotent stem cell variability and heterogeneity. Nat Rev Mol Cell Biol. 2013;14:357–68. doi: 10.1038/nrm3584. [DOI] [PMC free article] [PubMed] [Google Scholar]
- 2.Hou Y, et al. Single-cell triple omics sequencing reveals genetic, epigenetic, and transcriptomic heterogeneity in hepatocellular carcinomas. Cell Res. 2016;26:304–19. doi: 10.1038/cr.2016.23. [DOI] [PMC free article] [PubMed] [Google Scholar]
- 3.Begley CG, Ellis LM. Drug development: Raise standards for preclinical cancer research. Nature. 2012;483:531–3. doi: 10.1038/483531a. [DOI] [PubMed] [Google Scholar]
- 4.Justice MJ, Noveroske JK, Weber JS, Zheng B, Bradley A. Mouse ENU mutagenesis. Human Molecular Genetics. 1999;8:1955–1963. doi: 10.1093/hmg/8.10.1955. [DOI] [PubMed] [Google Scholar]
- 5.Robertson E, Bradley A, Kuehn M, Evans M. Germ-line transmission of genes introduced into cultured pluripotential cells by retroviral vector. Nature. 1986;323:445–8. doi: 10.1038/323445a0. [DOI] [PubMed] [Google Scholar]
- 6.Elbashir SM, et al. Duplexes of 21 ± nucleotide RNAs mediate RNA interference in cultured mammalian cells. Nature. 2001;411:494–498. doi: 10.1038/35078107. [DOI] [PubMed] [Google Scholar]
- 7.Brummelkamp TR, Bernards R, Agami R. A system for stable expression of short interfering RNAs in mammalian cells. Science. 2002;296:550–553. doi: 10.1126/science.1068999. [DOI] [PubMed] [Google Scholar]
- 8.Jinek M, et al. A Programmable Dual-RNA – Guided. Science. 2012;337:816–822. doi: 10.1126/science.1225829. [DOI] [PMC free article] [PubMed] [Google Scholar]
- 9.Fu Y, et al. High-frequency off-target mutagenesis induced by CRISPR-Cas nucleases in human cells. Nat Biotechnol. 2013;31:822–6. doi: 10.1038/nbt.2623. [DOI] [PMC free article] [PubMed] [Google Scholar]
- 10.Morgens DW, Deans RM, Li A, Bassik MC. Systematic comparison of CRISPR / Cas9 and RNAi screens for essential genes. Nat Biotechnol. 2016;34:1–4. doi: 10.1038/nbt.3567. [DOI] [PMC free article] [PubMed] [Google Scholar]
- 11.Evers B, et al. CRISPR knockout screening outperforms shRNA and CRISPRi in identifying essential genes. Nat Biotechnol. 2016;34:11–14. doi: 10.1038/nbt.3536. [DOI] [PubMed] [Google Scholar]
- 12.Rouhani F, et al. Genetic Background Drives Transcriptional Variation in Human Induced Pluripotent Stem Cells. PLoS Genet. 2014;10 doi: 10.1371/journal.pgen.1004432. [DOI] [PMC free article] [PubMed] [Google Scholar]
- 13.Fedorov LM, Haegel-Kronenberger H, Hirchenhain J. A comparison of the germline potential of differently aged ES cell lines and their transfected descendants. Transgenic Res. 1997;6:223–231. doi: 10.1023/a:1018446325492. [DOI] [PubMed] [Google Scholar]
- 14.Echeverri CJ, et al. Minimizing the risk of reporting false positives in large-scale RNAi screens. Nat Methods. 2006;3:777–9. doi: 10.1038/nmeth1006-777. [DOI] [PubMed] [Google Scholar]
- 15.Schnutgen F, et al. Genomewide production of multipurpose alleles for the functional analysis of the mouse genome. Proc Natl Acad Sci U S A. 2005;102:7221–7226. doi: 10.1073/pnas.0502273102. [DOI] [PMC free article] [PubMed] [Google Scholar]
- 16.Schnütgen F, et al. Enhanced gene trapping in mouse embryonic stem cells. Nucleic Acids Res. 2008;36 doi: 10.1093/nar/gkn603. [DOI] [PMC free article] [PubMed] [Google Scholar]
- 17.Ika Mayasari N, et al. Mixture of differentially tagged Tol2 transposons accelerates conditional disruption of a broad spectrum of genes in mouse embryonic stem cells. Nucleic Acids Res. 2012;40 doi: 10.1093/nar/gks262. [DOI] [PMC free article] [PubMed] [Google Scholar]
- 18.Ivics Z, Hackett PB, Plasterk RH, Izsvák Z. Molecular Reconstruction of Sleeping Beauty, a Tc1-like Transposon from Fish, and Its Transposition in Human Cells. Cell. 1997;91:501–510. doi: 10.1016/s0092-8674(00)80436-5. [DOI] [PubMed] [Google Scholar]
- 19.Bellen HJ, et al. The Drosophila gene disruption project: Progress using transposons with distinctive site specificities. Genetics. 2011;188:731–743. doi: 10.1534/genetics.111.126995. [DOI] [PMC free article] [PubMed] [Google Scholar]
- 20.Ivics Z, et al. Transposon-mediated genome manipulation in vertebrates. Nat Methods. 2009;6:415–422. doi: 10.1038/nmeth.1332. [DOI] [PMC free article] [PubMed] [Google Scholar]
- 21.Torres M, et al. An alpha-E-catenin gene trap mutation defines its function in preimplantation development. Proc Natl Acad Sci U S A. 1997;94:901–6. doi: 10.1073/pnas.94.3.901. [DOI] [PMC free article] [PubMed] [Google Scholar]
- 22.Reithmayer M, Reischl A, Snyers L, Blaas D. Species-specific receptor recognition by a minor-group human rhinovirus (HRV): HRV serotype 1A distinguishes between the murine and the human low-density lipoprotein receptor. J Virol. 2002;76:6957–6965. doi: 10.1128/JVI.76.14.6957-6965.2002. [DOI] [PMC free article] [PubMed] [Google Scholar]
- 23.Hofer F, et al. Members of the low density lipoprotein receptor family mediate cell entry of a minor-group common cold virus. Proc Natl Acad Sci. 1994;91:1839–1842. doi: 10.1073/pnas.91.5.1839. [DOI] [PMC free article] [PubMed] [Google Scholar]
- 24.Jaworski K, et al. AdPLA ablation increases lipolysis and prevents obesity induced by high-fat feeding or leptin deficiency. Nat Med. 2009;15:159–168. doi: 10.1038/nm.1904. [DOI] [PMC free article] [PubMed] [Google Scholar]
- 25.Duncan RE, Sarkadi-Nagy E, Jaworski K, Ahmadian M, Hei SS. Identification and functional characterization of adipose-specific phospholipase A2 (AdPLA) J Biol Chem. 2008;283:25428–25436. doi: 10.1074/jbc.M804146200. [DOI] [PMC free article] [PubMed] [Google Scholar]
- 26.Tsutsumi S, et al. Endoplasmic reticulum stress response is involved in nonsteroidal anti-inflammatory drug-induced apoptosis. Cell Death Differ. 2004;11:1009–1016. doi: 10.1038/sj.cdd.4401436. [DOI] [PubMed] [Google Scholar]
- 27.Uyama T, et al. Interaction of Phospholipase A/acyltransferase-3 with Pex19p: A possible involvement in the down-regulation of peroxisomes. J Biol Chem. 2015;290:17520–17534. doi: 10.1074/jbc.M114.635433. [DOI] [PMC free article] [PubMed] [Google Scholar]
- 28.Staring J, et al. PLA2G16 represents a switch between entry and clearance of Picornaviridae. Nature. 2017;541:412–416. doi: 10.1038/nature21032. [DOI] [PubMed] [Google Scholar]
- 29.Potente M, Gerhardt H, Carmeliet P. Basic and therapeutic aspects of angiogenesis. Cell. 2011;146:873–887. doi: 10.1016/j.cell.2011.08.039. [DOI] [PubMed] [Google Scholar]
- 30.Del Toro R, et al. Identification and functional analysis of endothelial tip cell-enriched genes. Blood. 2010;116:4025–4033. doi: 10.1182/blood-2010-02-270819. [DOI] [PMC free article] [PubMed] [Google Scholar]
- 31.Strasser GA, Kaminker JS, Tessier-Lavigne M. Microarray analysis of retinal endothelial tip cells identifies CXCR4 as a mediator of tip cell morphology and branching. Blood. 2010;115:5102–5110. doi: 10.1182/blood-2009-07-230284. [DOI] [PubMed] [Google Scholar]
- 32.Jakobsson L, et al. Endothelial cells dynamically compete for the tip cell position during angiogenic sprouting. Nat Cell Biol. 2010;12:943–953. doi: 10.1038/ncb2103. [DOI] [PubMed] [Google Scholar]
- 33.Hellström M, et al. Dll4 signalling through Notch1 regulates formation of tip cells during angiogenesis. Nature. 2007;445:776–780. doi: 10.1038/nature05571. [DOI] [PubMed] [Google Scholar]
- 34.Valdimarsson G, De Sousa PA, Beyer EC, Paul DL, Kidder GM. Zygotic expression of the connexin43 gene supplies subunits for gap junction assembly during mouse preimplantation development. Mol Reprod Dev. 1991;30:18–26. doi: 10.1002/mrd.1080300103. [DOI] [PubMed] [Google Scholar]
- 35.Pitulescu ME, Schmidt I, Benedito R, Adams RH. Inducible gene targeting in the neonatal vasculature and analysis of retinal angiogenesis in mice. Nat Protoc. 2010;5:1518–34. doi: 10.1038/nprot.2010.113. [DOI] [PubMed] [Google Scholar]
- 36.Chaytor AT, Martin PE, Edwards DH, Griffith TM. Gap junctional communication underpins EDHF-type relaxations evoked by ACh in the rat hepatic artery. Am J Physiol Heart Circ Physiol. 2001;280:H2441–H2450. doi: 10.1152/ajpheart.2001.280.6.H2441. [DOI] [PubMed] [Google Scholar]
- 37.Baker M. 1,500 Scientists Lift the Lid on Reproducibility. Nature. 2016;533:452–454. doi: 10.1038/533452a. [DOI] [PubMed] [Google Scholar]
Associated Data
This section collects any data citations, data availability statements, or supplementary materials included in this article.