Abstract
Escaping from imminent danger is an instinctive behaviour fundamental for survival that requires classifying sensory stimuli as harmless or threatening. The absence of threat allows animals to forage for essential resources, but as the level of threat and potential for harm increases, they have to decide whether or not to seek safety1. Despite previous work on instinctive defensive behaviours in rodents2–11, little is known about how the brain computes the threat level for initiating escape. Here we show that the probability and vigour of escape in mice scale with the saliency of innate threats, and are well described by a model that computes the distance between threat level and an escape threshold. Calcium imaging and optogenetics in the midbrain of freely behaving mice show that the activity of excitatory neurons in the deep layers of the medial superior colliculus (mSC) represents the threat stimulus saliency and is predictive of escape, whereas dorsal periaqueductal gray (dPAG) glutamatergic neurons encode exclusively the escape choice and control escape vigour. We demonstrate a feed-forward monosynaptic excitatory connection from mSC to dPAG neurons that is weak and unreliable – yet necessary for escape behaviour – which provides a synaptic threshold for dPAG activation and the initiation of escape. This threshold can be overcome by high mSC network activity because of short-term synaptic facilitation and recurrent excitation within the mSC, which amplifies and sustains synaptic drive to the dPAG. Thus, dPAG glutamatergic neurons compute escape decisions and vigour using a synaptic mechanism to threshold threat information received from the mSC, and provide a biophysical model of how the brain performs a critical behavioural computation.
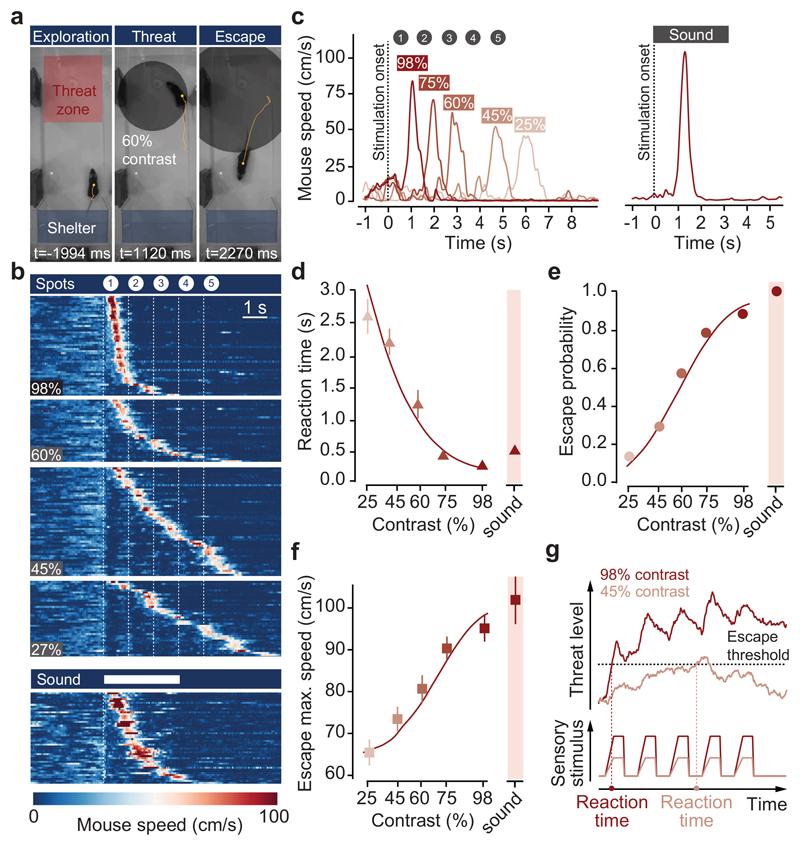
Detecting and escaping threats is an instinctive behaviour that reduces the chances of being harmed, but that also results in halting other behaviours and potential loss of resources. To balance escape with other survival behaviours, animals use sensory information and past experience to estimate threat and decide whether or not to escape1. While perceptual decision making has been studied in primates and rodents using learned choice tasks12,13, and previous work has identified key circuits for innate defence4–8,14,15, the neurophysiological basis of escape decisions in mammals is largely unknown. We investigated escape in mice using innately aversive overhead expanding spots3,16, while varying the spot contrast to manipulate stimulus saliency. Stimulus presentation while animals explored an arena with a shelter resulted in shelter-directed escape responses that were variable and probabilistic (Fig. 1a-c). Decreasing stimulus contrast progressively increased reaction times and reduced escape probability, producing chronometric and psychometric curves similar to those from learned perceptual categorisation tasks12,13 (Fig. 1d,e, Supplementary Video 1). Response vigour (escape speed) also increased with contrast (Fig. 1f), showing that probability, reaction time and vigour of instinctive escape are innately matched to the saliency of the threat stimulus (see also Extended Data Fig. 1). The relationship between these variables was well captured by a drift-diffusion model12,17 that integrates a noisy threat level variable over time and implements the escape decision as a threshold-crossing process (Fig. 1g, see Methods), and further supported by innately aversive ultrasonic sweeps, which generated escape with high probability, short reaction times and high vigour (Fig.1b-f).
Figure 1. Escape behaviour during threats of varying intensity.
a, Video frames of escape to expanding spots. Yellow lines show the mouse trajectory during the preceding 2s, stimulation onset is t=0. b, Raster plot of mouse speed during escape trials for visual (top, organised by contrast) and sound (bottom) stimulation, sorted by reaction time (N=13). c, Single trial traces from one mouse escaping to different contrast spots (left) and sound (right). d, Chronometric, e, psychometric and f, vigour curve for contrast and escape behaviour; N=13, 209 trials; escape probability: P=2.5x10⁻⁷, reaction time: P=3.5x10⁻⁸, vigour: P=1.6x10⁻⁶. g, Theoretical model for computing escape from threat stimuli. Datapoints in d-f are means of trials pooled across animals, error bars are SEM, red lines are model fit to the data, p-values: repeated-measures ANOVA.
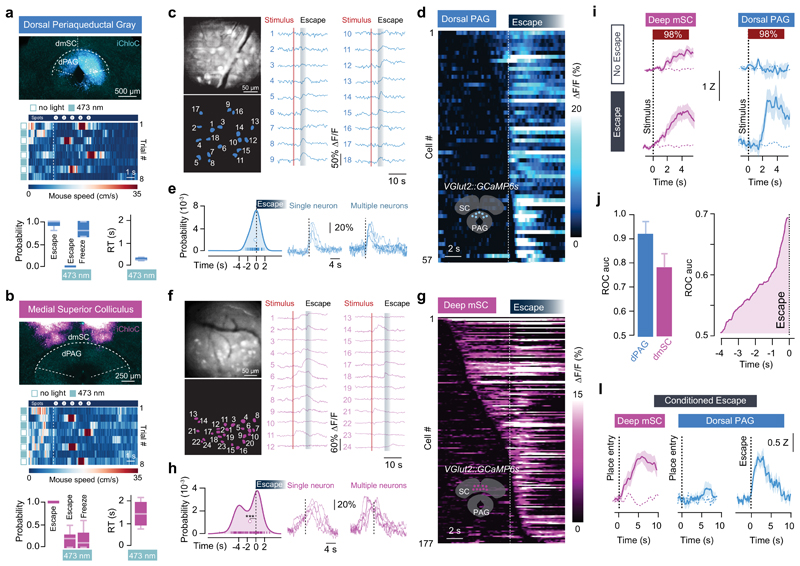
Multiple brain regions contribute to instinctive defensive behaviours5,7,8,14,18,19, so we next used optogenetic inactivation20 of excitatory neurons expressing vesicular glutamate transporter 2 (VGluT2+) to define critical circuit nodes for escape (Fig. 2a,b). Inactivation of the dPAG and mSC severely affected escape, without affecting exploratory behaviour (Extended Data Fig. 2), but in different ways. Inactivating dPAG neurons switched the response to threat from escape to freezing with fast reaction times (269±35ms, Fig. 2a; Supplementary Video 2), indicating that the threat was still detected and that the dPAG is specifically required to initiate escape. In contrast, visual and sound stimulation after SC inactivation produced no defensive response in 62±10% of light-on trials, suggesting that the link between sensory stimulus and response to threat was severely compromised (Fig. 2b, Supplementary Video 3). In the remaining trials, the reaction time was slow (1443±255ms, Fig. 2b) and the vigour of escape reduced (Extended Data Fig. 2c), compatible with a reduction in the perceived threat level. Similar results were obtained with muscimol inactivation of the dPAG and mSC, while inactivation of the visual cortex (V1) or amygdala only caused small decreases in escape probability and vigour (Extended Data Fig. 3). Next we performed calcium imaging of VGluT2+ neurons in the deep layers of the mSC (dmSC) or dPAG in freely behaving animals. Activity in both areas increased during stimulus-evoked escape (Fig. 2c,f), with a trial reliability of 28±3% for the dPAG and 35±3% for the dmSC, yielding a mean fraction of active cells of 14±5% and 23±6%, respectively, which was stable over multiple trials (Extended Data Fig. 4). However, the temporal profile of dPAG and dmSC activity was distinct. While dPAG cells were active in the peri-escape initiation period (Fig. 2d,e), activity in most dmSC cells preceded escape onset (Fig. 2g,h), and this temporal difference was also reflected in the ensemble activity onset (onset relative to escape start: -0.25±0.48s for dPAG, -1.77±0.5s for dmSC, P=0.59 and P=0.00075 respectively, two-tailed t-test comparison with escape onset). Sorting trials from the same stimulus contrast by trial outcome (Fig. 2i) showed that dmSC neurons encode the threat stimulus, and also reflect the choice to escape (z-score=1.93±0.23 for escape, 1.18±0.11 for no escape), whereas activity in dPAG neurons increases exclusively in escape trials (z-score=2.28±0.17 for escape, 0.49±0.19 for no escape). Receiver-operator characteristic analysis (ROC) of ensemble activity reflected this difference, and showed that an ideal observer of dmSC activity could predict the decision to escape 900ms before escape initiation (68% correct; Fig. 2j). Ensemble dmSC activity was also strongly anti-correlated with reaction time, further suggesting that it is important for escape initiation (Extended Data Fig. 4i,j). To further test the nature of dmSC signals we exposed mice to a place aversion paradigm that resulted in spontaneous flights upon approaching the threat area (Extended Data Fig. 5; Supplementary Video 4). Activity of dmSC neurons after conditioning increased upon place entry and preceding escape, despite no stimulus presentation (z-score=1.94±0.17; Fig. 2l). Importantly, pre-escape activity was still predictive of escape, and not related to head-rotation movements (Extended Data Fig. 4k), indicating that dmSC neurons encode a variable correlated with escape likelihood. In agreement with the threat stimulus data, dPAG activity increased exclusively during escape initiation (Fig. 2l). In addition, there was a correlation between escape speed and peak calcium activity, which was ~3 times stronger in dPAG, and specific for running during escape to shelter (Extended Data Fig. 4l,m).
Figure 2. Encoding of threat and escape behaviour in the superior colliculus and periaqueductal gray.
a, (top) iChloC expression in VGluT2+ dPAG neurons, (middle) speed raster during interleaved trials of threat presentation with light-off or on, (bottom) summary for stimulation during dPAG inactivation (Pescape=0.03±0.03, Pfreeze=0.86±0.06, mean freezing duration=4.3±1.0s; N=6, escape: P=8.12x10⁻⁵, freezing: P=0.00029, U-tests between light-off and light-on). (b) same as (a) for VGluT2+ dmSC inactivation (Pescape=0.18±0.05, Pfreeze= 0.19±0.07, N=9 mice, escape: P=5.15x10⁻⁵, freezing: P=0.02; U-tests as above). Reaction times are slower during mSC than dPAG inactivation (P=0.002, two-tailed t-test). c, GCaMP6s field-of-view of dPAG VGluT2+ neurons (top left), cell mask (bottom left) and single trial examples (right). d, Average calcium response for active dPAG cells, aligned to escape and sorted by onset (57/138 cells, N=3, 55 trials). e, Left, distribution of dPAG cell onsets (curve is kernel density estimation, markers show onsets). Mean onset=-0.24±0.21s (white marker, not different from 0s; P=0.24, two-tailed t-test). Right, example single trial traces. (f,g,h) Same as (c,d,e) for dmSC (177/218 active cells, N=8, 111 trials; mean onset= -1.51±0.17s, P=3.5x10⁻¹² Wilcoxon test comparison with 0s). i, Population activity for 98% contrast (z-score), grouped by trial outcome for dmSC (pink; 111 trials, P=0.023, two-tailed t-test between escape and no escape; P=5.8x10⁻¹⁰, 1-sample t-test between no escape and 0) and dPAG (blue; 55 trials, P=0.00028 and P=0.11, tests as for mSC). Dashed lines are activity without stimulus. j, ROC Area under the curve (auc, left), and auc evolution for dmSC signals up to escape (right, 75 trials; error bars are SD). l, dmSC activity upon place entry increases after conditioning (left, dashed line is activity before conditioning; 57 trials, N=7, P=0.00013, two-tailed t-test between pre- and post-conditioning), whereas dPAG activity increases selectively upon escape (middle and right, z-score=1.5±0.2, 20 trials, N=3, P=0.0004, two-tailed t-test between pre- and post-conditioning). Box-whisker plots show median, IQR and range. Error bars and shaded areas are SEM, RT is reaction time. *** P<0.001.
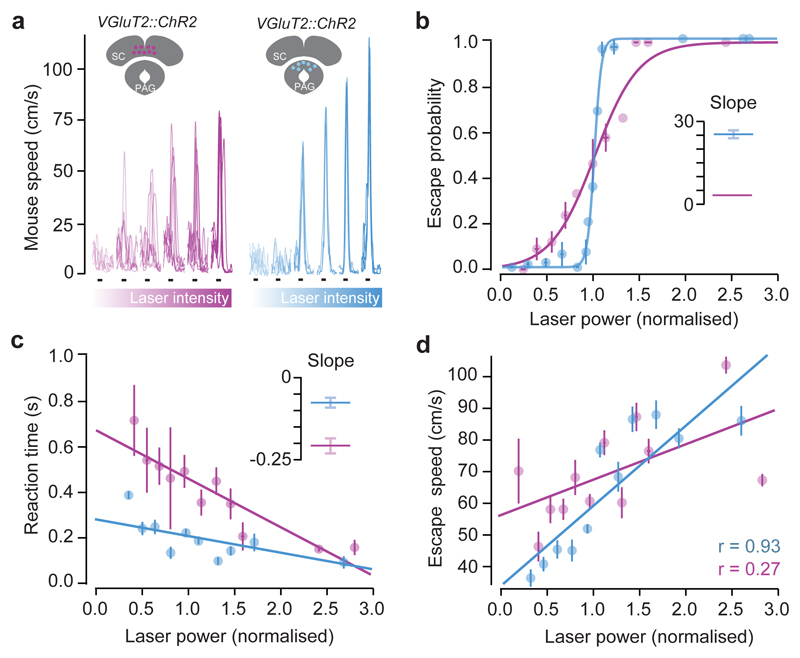
These activity profiles are consistent with dmSC neurons representing a pre-escape variable such as threat intensity, while dPAG neurons encode the result of the threat thresholding computation. This predicts that direct dmSC activation should produce psychometric and chronometric curves similar to sensory stimulation, as activity is still being passed through the threshold mechanism to initiate escape, while dPAG stimulation should reliably elicit escape behaviour with short reaction times. We tested this prediction using in vivo channelrhodopsin-2 (ChR2) activation of dmSC or dPAG VGluT2+ neurons (Fig. 3a), which recapitulated shelter-directed flights (Extended Data Fig. 6a-c, Supplementary Video 5). Gradually increasing dmSC network activation by increasing light intensity progressively increased escape probability and decreased response variability (Fig. 3b,c), while increasing dPAG activity produced a steep, all-or-none curve, with stereotyped responses for each intensity (Fig. 3b,c), in agreement with our model hypothesis. Reaction times also decreased with stronger dmSC activation, while escape latencies for dPAG activation were short across the stimulation range (Fig. 3d), demonstrating that dmSC activity determines escape onset. Stimulation strength was also correlated with escape speed, but the correlation was stronger for dPAG stimulation (Fig. 3e), suggesting that dPAG activity represents a post-threshold variable from which escape vigour is computed. Moreover, dmSC activation while inactivating the dPAG did not elicit escape, whereas inactivation of an alternative dmSC projection target, the parabigeminal nucleus (PBGN)5, did not impair escape, suggesting that dmSC threat information has to flow through the dPAG to initiate escape (Extended Data Fig. 6d-i).
Figure 3. Optogenetic stimulation shows different roles for mSC and dPAG in escape behaviour.
a, Speed traces with increasing light intensity (10Hz pulse, black lines) from one mouse (mSC left, dPAG right). b, Psychometric curve (mSC: 278 trials, N=4, slope=4.0, 95% CI [2.75, 5.25]; dPAG: 590 trials, N=7, slope =26.3, 95% CI [22.1, 30.4]). Lines are logistic fits (pooled across all animals and binned light intensities), inset shows fit slope (error bars are SD). c, Chronometric curve (mSC: 149 trials, slope=-0.21, 95% CI [-0.27, -0.15]; dPAG: 328 trials, slope=-0.07, 95% CI [-0.11, -0.03]). Lines are linear fits, inset as (b). d, Correlation between light intensity and escape speed (mSC: 149 trials, P=0.04; dPAG: 328 trials, P=1.5x10⁻⁵; Pearson’s r). Error bars are SEM unless otherwise indicated, mSC data is shown in purple and dPAG in blue.
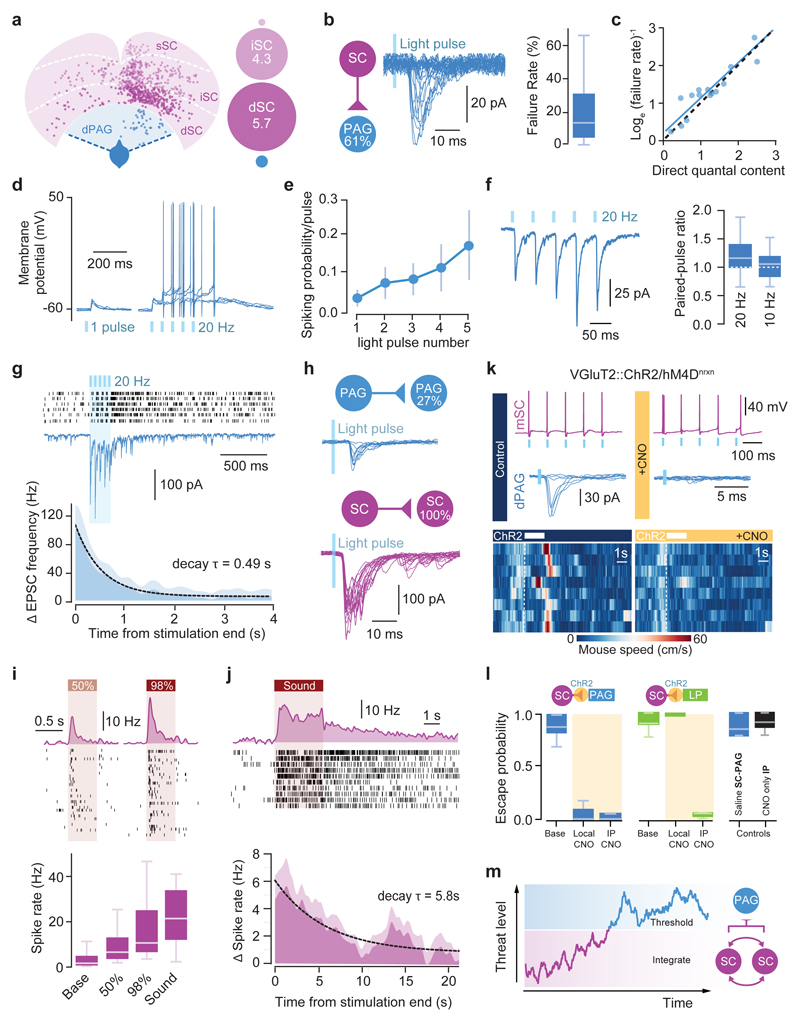
To determine whether dmSC neurons project directly to dPAG neurons, we performed monosynaptic rabies tracing, which revealed a feed-forward 11:1 SC-dPAG convergence ratio, of mostly medially located excitatory cells (Fig. 4a; Extended Data Fig. 7). Optogenetic activation of VGluT2+ dmSC axons in vitro elicited excitatory monosynaptic input in 61% of VGluT2+ dPAG neurons (Fig. 4b, left; Extended Data Fig. 8a-e), but the connections were weak (peak EPSC: -37.9±11.9pA), with high failure rates (20.3±8%), low quantal content (2.3±0.6), and followed Poisson statistics, indicating a very low synaptic release probability (Fig. 4c, Extended Data Fig. 8f-h). Consequently, the probability of firing dPAG neurons was extremely low (0.02±0.01 for single light pulses; Fig. 4d,e), thus providing a synaptic threshold for dmSC activity to engage the dPAG. However, repeated light stimulation elicited more action potentials than expected from temporal summation (spikes/pulse: 0.17±0.1 for 10Hz, 0.16±0.08 for 20Hz; membrane time constant=28.3±3ms, significantly different from the 20Hz inter-stimulus interval, P=5.8x10⁻⁶, 1-sample t-test against 50ms; Fig. 4e and Extended Data Fig. 8b). This happens because first, the connection facilitates (20Hz PPR=1.22±0.09, 10Hz PPR=1.04±0.08), providing input amplification at the synaptic level (Fig. 4f). Second, dmSC stimulation triggered a long-lasting increase in sEPSCs frequency, which decayed to baseline with a 0.49s time constant (Fig. 4g). Recordings of VGluT2+ dPAG-dPAG and dmSC-dmSC connectivity showed weak and sparse dPAG input onto dPAG cells (27%, -54±8.3pA), while 100% of dmSC cells received strong input from other dmSC cells (-146.7±41.5pA, Fig. 4h), in agreement with previous work21 and suggesting that recurrent excitation in the dmSC amplifies signals at the network level. Together, these synaptic and network mechanisms allow sustained dmSC activation to overcome the weak connection to VGluT2+ dPAG neurons and drive firing of the escape network. In vivo silicon probe recordings in awake head-fixed animals showed that during threat stimuli22,23, dmSC single units fire in the short-term facilitation frequency range of the dmSC-dPAG synaptic connection (73 units from 3 animals, Extended Data Fig. 9), in a contrast-dependent manner (peak firing rate: 20.4±4.1Hz for 98%, 10.7±1.8Hz for 50%, 23.9±2.5Hz for sound, Fig.4i). Moreover, a fraction of units sustained increased firing beyond the stimulus (37% of visual- and 15% of sound-responding units; time constant to decrease to baseline: 0.23s and 5.8s, respectively; Fig. 4j), in agreement with recurrent dmSC activity assisting with integration to threshold. In the final set of experiments we tested whether the dmSC-dPAG connection is critical for computing escape. We co-expressed the synaptically-targeted inhibitory designer receptor hM4D-neurexin (hM4Dnrxn)24 and ChR2 in VGluT2+ dmSC neurons, which caused a 71±7% reduction in synaptic transmission to the dPAG in the presence of clozapine-N-oxide (CNO), while leaving dmSC neuron firing intact (Fig. 4k, Extended Data Fig. 10a-b). In vivo microinfusion of CNO over dmSC-dPAG synapses blocked escape to visual stimuli (Extended Data Fig. 10c) and optogenetic dmSC activation, similar to systemic CNO injection (Fig. 4k,l, Supplementary Video 6). Notably, doubling the intensity or frequency of optogenetic stimulation was not sufficient to rescue escape (Extended Data Fig. 10a,d), while inhibiting the dmSC projection to the lateral posterior nucleus of the thalamus (LP) did not affect escape (Fig. 4l).
Figure 4. Neural circuit and biophysical mechanisms for computing escape behaviour.
a, Left, dPAG VGluT2+ (blue) and presynaptic cells (pink) from rabies tracing, for deep (dSC), intermediate (iSC) and superficial SC (sSC). Right, SC:dPAG convergence ratios for single dPAG cells. b, mSC-dPAG connectivity (left; n=79, N=21), example traces (middle), and failures summary (right, n=8, N=7). c, Direct quantal content versus estimation from failure rate (fit slope = 0.92, 95% CI [0.74,1.1]; n=15). Blue line: linear fit, dashes: unity line (see Methods). d, dPAG voltage response to dSC stimulation. e, Spiking probability summary (n=20 N=10, plot shows mean and SEM). f, Example average trace (left) and summary (right; n=11,18, N=7,8 for 10Hz, 20Hz respectively). g, dPAG example trace during mSC stimulation (middle) and sEPSC raster (5 trials, top). Bottom, sEPSC frequency summary (n=21, N=9). Dashed line: exponential fit. h, Examples and connectivity for dPAG (top; n=11, N=2) and dmSC (bottom; n=22, N=10). i, Top, firing rate histograms and spike rasters from one dmSC single unit. Bottom, summary data (32 visual- and 45 sound-responsive units, P=0.01 for 50% vs 98%, P=2.8x10⁻⁵ for 50% visual vs sound). j, Top, example unit showing persistent activity, and average histogram for cells with persistent activity (bottom, dashed line: exponential fit; 7 units). k, hM4Dnrxn activation does not affect ChR2-evoked mSC cell firing (top), but blocks mSC-dPAG EPSCs (middle). Bottom, example speed rasters during mSC activation before (left) and after (right) CNO microinfusion to the mSC-dPAG projection. l, Summary of CNO application to mSC:PAG (local CNO: Pescape=0.08±0.05, N=5, P=0.0008*; i.p. CNO: Pescape=0.05±0.05, N=4, P=0.01*; P=0.5 for local vs i.p. CNO), and mSC-LP projection (local CNO: Pescape=1.0±0, N=4, P=0.1*; i.p. CNO: Pescape=0.04±0.02, N=3, P=0.04*; P=0.01 for local vs i.p. CNO). Saline mSC-dPAG microinfusion and CNO i.p. without hM4Dnrxn do not reduce escape (N=5, P>0.15). m, escape decision model. Shaded areas show SEM, box-whisker plots show median, IQR and range. P-values: two-tailed U-test; asterisk: U-test vs baseline Pescape.
Our results support a model where threat evidence is integrated in the dmSC and passed through a synaptic threshold at the dPAG level to initiate escape (Fig. 4m). While it is likely that multiple mSC projections support escape behaviour, we show that the dmSC-dPAG synaptic connection is necessary for escape initiation, whereas SC projections to LP5,7 are not, suggesting that there might be dedicated projections for controlling freezing7 and escape. Also, in contrast to previous work using optogenetic activation of SC-PBGN projections5, we did not find a critical role for this pathway in escape initiation, which could be explained by antidromic activation of SC neurons projecting to both PBGN and dPAG, or by back-projections to the SC. A key result is that dmSC activity encodes a high-order signal predictive of escape, in agreement with its role in multisensory integration25 and decision-making26–28. Successfully escaping from threats to reach safety requires integration of multiple information streams, such as knowledge about the spatial environment9, and our results provide a mechanistic entry point for understanding how the brain computes a fundamental survival behaviour, and goal-directed behaviours in general.
Online Methods
Animals
Male and female adult C57BL/6J wild-type, VGluT2-ires-Cre29 (Jackson Laboratory, stock #016963) and VGluT2::EYFP (R26 EYFP, Jackson Laboratory #006148) mice were housed with ad libitum access to chow and water on a 12h light cycle and tested during the light phase. All experiments were performed under the UK Animals (Scientific Procedures) Act of 1986 (PPL 70/7652) following local ethical approval.
Surgical procedures
Animals were anaesthetised with an intraperitoneal injection (i.p.) of ketamine (95mg/kg) and xylazine (15.2mg/kg), and carpofen (5 mg/kg) was administered subcutaneously. Isoflurane (0.5-2.5% in oxygen, 1L/min) was used to maintain anaesthesia. Craniotomies were made using a 0.5mm burr and viral vectors were delivered using pulled glass pipettes (10μl Wiretrol II with a Sutter P-1000) in an injection system coupled to a hydraulic micromanipulator (MO-10, Narishige) on a stereotaxic frame (Model 1900 and 963, Kopf Instruments), at ~10nl/min. Implants were affixed using light-cured dental cement (RelyX Unicem 2, 3M) and the wound sutured (6-0, Vicryl Rapide) or glued (Vetbond). Coordinates are measured from lambda.
Viruses
The following viruses were used in this study and are referred to by contractions in the text. For optogenetic activation, AAV2-EF1a-DIO-hChR2(H134R)-EYFP-WPRE (3.9x10¹² GC/ml), AAV2-EF1a-DIO-hChR2(H134R)-mCherry-WPRE (6.6x10¹² GC/ml; Deisseroth) were acquired from the UNC Vector Core (USA). Optogenetic inhibition experiments were performed with AAV9-Ef1a-DIO-iChlo-2A-tDimer (3.75x10¹² GC/ml; a gift from S. Wiegert and T. Oertner) or AAV1-EF1a-DIO-iChloC-2A-dsRed (5x10¹³ GC/ml; Addgene #70762, a gift from T. Margrie). For control and calcium imaging experiments respectively, AAV2-EF1a-DIO-EYFP-WPRE (4.0x10¹² GC/ml) and AAV9-CAG-DIO-GCaMP6s-WPRE (6.25x10¹² GC/ml) were acquired from Penn Vector Core (USA). For retrograde rabies tracing, EnvA pseudotyped SADB19 rabies virus (EnvA-dG-RV-mCherry) was used in combination with AAV8 coding for TVA and rabies virus glycoprotein (RG) that were prepared from pAAV-EF1a-FLEX-GT (Addgene plasmid #26198, Callaway) and pAAV-Syn-Flex-RG-Cerulean (Addgene plasmid #98221, Margrie). All viruses used for rabies tracing were a gift from T. Margie30, and previously tested for leakiness and specificity31. Additionally, a recombinant AAV with retrograde functionality (rAAV2-retro-mCherry, 6.97x10¹² GC/ml, Addgene #8107032) was used. For chemogenetic inhibition experiments, AAV5-CAG-DIO-mCherry-2A-hM4D-HA-2A-nrxn1A (3.9x10¹² GC/ml, a gift from S. Sternson) or AAV2-CAG-DIO-mCherry-2a-hM4D-nrxn1a (6.19x10¹¹ GC/ml, Addgene #60544) were used.
Behavioural procedures
Experimental set-up
All behavioural experiments were performed in a rectangular perspex arena (W:20cm x L: 60cm x H: 40cm) with a red-tinted shelter (19cm x 10cm x 13.5cm) at one end, housed within a sound-deadening, light-proofed cabinet with six infra-red LED illuminators (TV6700, Abus). A screen (90cm x 70cm; `100 micron drafting film`, Elmstock,) was suspended 64cm above the arena floor, and a DLP projector (IN3126, InFocus) back-projected a grey uniform background via a mirror, providing 7-8lx at the arena floor. Experiments were recorded at 50 frames per second with a near-IR GigE camera (acA1300-60gmNIR, Basler) positioned above the arena centre. Video recording, sensory and optogenetic stimulation was controlled with custom software written in LabVIEW (2015 64-bit, National Instruments). The position of the animal was tracked on-line, and used to deliver stimuli when the animal entered a predefined ‘threat area’ (21cm x 20cm area at opposite end to shelter). An empty plastic Petri dish (replaced fresh for each animal; 35mm) was affixed to the arena floor in the centre of the threat area to enrich the environment. All signals and stimuli, including each camera frame, were triggered and synchronised using hardware-time signals controlled with a PCIe-6351 board (National Instruments).
Protocols
Mice were placed in the arena and given 8min to explore the new environment, after which sensory stimuli were delivered when the animal entered the threat area longer than 100ms. A typical experiment lasted 30-60min. In the standard visual stimulation protocol, we used a pseudo-random contrast sequence to minimise the development of aversion or habituation during the behavioural session (see Extended Data Figures 1 and 5e,f for quantification). The sequence consisted of a first stimulus at 98% contrast, followed by a random selection without replacement from the remaining contrasts, and this process was repeated until the end of the behavioural session. Each stimulus was delivered with at least 30s inter-stimulus interval. For the conditioning protocol shown in Fig. 2l and Extended Data Fig. 5, repeated presentations (3-6 trials) at 98% contrast were delivered with no minimum inter-stimulus interval after a 10min acclimatisation period.
Sensory stimuli
The standard visual stimulus was a sequence of five dark expanding circles, and unless otherwise stated, each subtended a visual angle of 2.6° at onset and expanded linearly at 118°/s to 47° over 380ms, after which it maintained the same size for 250ms and began an inter-stimulus interval of 500ms. The contrast of the spot was varied in a number of experiments, and for clarity is reported as a positive percentage (low to high; e.g. 25% to 98%), converted from the negative Weber fraction (low to high; -0.25 to -0.98). The contrast was varied by altering the intensity of the spot against a grey screen maintained at constant luminance (standard luminance, 7.95cd/m2). The spot was located on the screen directly above the centre of the threat area, ~15° from the animal’s zenith. The auditory stimulus consisted of a frequency-modulated upsweep from 17 to 20kHz over 3s33. Waveform files were created in MATLAB (Mathworks), and the sound was generated in LabVIEW, amplified and delivered via an ultrasound speaker (L60, Pettersson) positioned 50-55cm above the arena, centred over the threat area.
Analysis
Behavioural video and tracking data was sorted into peri-stimulus trials and manually annotated. Detection of the threat stimulus was assumed if the animal showed a stimulus-detection response, in which the ears of the animal move posteriorly and ventrally, which precedes interruption or commencement of body movement. To differentiate failures of escaping from failures of attending to the stimulus, trials with no stimulus-detection response were excluded from the analysis. This resulted in the exclusion of three no-escape trials from the 25% contrast dataset, which increased the escape probability from 0.12 to 0.13. The onset of escape was measured as the first video frame marking the onset of a continuous movement consisting of a head turn followed by a full-body turn towards the shelter. Escape was annotated automatically and defined as the animal moving to enter the shelter in a single movement without stopping, within 0.9s after stimulus termination (or 6s after approaching a 15cm boundary from threat area for spontaneous escapes after conditioning). Behaviour metrics were calculated by pooling all trials and animals (Fig. 1d-f) and also by analysing each mouse individually and then computing an average value across all mice (Extended Data Fig. 1a-c). Statistical analysis was performed using animal numbers for sample size. The escape probability for a given stimulus is the fraction of trials which led to an escape to the shelter. The maximum speed of the escape is calculated as the peak value of the speed trace between the onset of the escape and entry to the nest. Quantification of exploratory behaviour was done for behavioural sessions lasting at least 40 min, by calculating the cumulative displacement of the animal in 1 min bins followed by smoothing with a 5 point flat window. We did not observe any differences in the behavioural response to threat stimulation between male and female mice, and therefore data from both sexes has been pooled (for 98% contrast stimulation, escape probability: 0.86 for males, 0.88 for females, P=1.0, Fisher exact test; reaction time: 369.2±51.8ms for males, 365.6±39.6ms for females, P = 0.96, two-tailed t-test; vigour: 91.8±4.5cm/s for male, 89.1±11.1 for female, P=0.81, two-tailed t-test).
Behavioural model
The threat level (T) evolves over time according to
| (1) |
where a(t) is the diameter of the expanding visual spot scaled by the spot contrast C. The variable τT sets the time constant for changing the threat level and W is a white-noise Wiener process parametrised by σN. At each time point, T is compared against a threshold B, and escape initiated if T > B. The reaction time is the time at threshold crossing measured relative to stimulus onset. In this model we allow the threat level to continue evolving after the threshold has been crossed, similar to previous work on changes of mind during decision making34, and escape vigour V is computed from the peak of the threat level as a logistic function:
| (2) |
The model was first fitted with three free parameters (B, τT, σN) to the reaction time and escape probability data simultaneously by simulating 10,000 trials for each parameter set and using the brute force method in LMFIT Python 2.7 package. Escape vigour was then fitted to the average peak threat levels across all trials with free parameters k and s using least-squares minimisation in LMFIT. The fit parameters for the curves shown in Figure 1 are: B=0.165, τT=1200ms, σN=0.6, k=90, s=1.5.
Pharmacological inactivation
Animals were bilaterally implanted with guide cannulae (Plastics One, Bilaney Consultants) over the target region (see Supplementary Table 1) and given at least 48h for recovery. On test day, mice were placed in the standard arena for 10min and escape responses were assessed with a single visual stimulus (one 98% contrast expanding spot) or auditory stimulus. Additionally, in PBG- and PAG-cannulated mSC-VGluT2::ChR2 animals, optogenetic responses were also evoked. The animals were then lightly anaesthetised in an induction chamber and placed on a heating pad where anaesthesia was maintained with a nose-cone (2% isoflurane, 1L/min). Internal cannulae were inserted and sealed with Kwik-Sil. Muscimol-BODIPY-TMR-X (0.5mg/ml) or Alexa-555 (100μM; Life Technologies), dissolved in 1:1 PBS: 0.9% saline with 1% DMSO, was then infused at a rate of 70-100nl/min using a microinjection unit (10μl Model 1701 syringe; Hamilton, in unit Model 5000; Kopf Instruments) followed by a 5min wait period per hemisphere. Animals spent no longer than 30mins under anaesthesia and were given 30min to recover in the homecage, after which they were placed back in the cleaned arena and subjected to visual, auditory or optogenetic stimulation. Immediately upon termination of the behavioural assay, ~1hr after infusion, animals were anesthetised with isoflurane (5%, 2L/min) and decapitated. Acute slices (150μm) were cut using a microtome (Campden 7000smz-2 or Leica VT1200S) in ice-cold PBS (0.1M), directly transferred to 4% PFA solution, and kept for 20min at 4°C. The slices were then rinsed in PBS, counter-stained with DAPI (3μM in PBS), and mounted on slides in SlowFade Gold (Life Technologies) before wide-field imaging (Nikon TE2000) on the same day to confirm the site of infusion. Behavioural data was annotated as described. For the calculation of the maximum exploration speed, the peak speed of the 7min acclimatisation period before stimulation was used. Statistical analysis was performed using animal numbers for sample size.
Calcium imaging in freely-moving animals
Data acquisition
A miniaturised head-mounted fluorescence microscope35 (Model L, Doric Lenses Inc.) was used to image GCaMP6s in neurons of male VGluT2-Cre mice. AAV9-CAG-Flex-GCaMP6s (300-550nl; Penn Vector Core) was injected into the mSC (AP: −0.2 to −0.5, ML: +0.25, DV: −1.6) or dPAG (AP: −0.4 to −0.6, ML:+0.25, DV: −2.2). At the level of the inferior colliculus, the dura was incised using a 30G needle, and gently pulled forward to partially reveal the SC. A GRIN lens-equipped cannula (SICL_V_500_80; Doric Lenses Inc.) was used to push forward the transverse sinus and inserted to the same depth as the injection coordinates, after which the craniotomy was covered with Kwik-Cast and the cannula affixed with dental cement. At least 21 days after surgery, the microscope was attached to the mouse without anaesthesia, and the animal was placed back in the homecage for 5-10min, for acclimatisation to the microscope. During this period, the optimal imaging parameters for the preparation were determined: the acquisition rate was 14.2Hz in most experiments (median; range: 10-20Hz) with an excitation power of 450μW (median; range: 0.2-1.1mW). After a baseline period of 7min, animals were exposed to visual and/or auditory stimulation. For the visual stimulation, contrast was 98%, the inter-stimulus interval was 750ms, and post expansion period was 20ms, with the total epoch length and expansion rate unchanged. A typical session lasted 1.5hr (1-3 sessions per animal), with imaging data acquired during stimulation and control trials in ~5min epochs, with at least 2 days between sessions. If prolonged bouts of animal inactivity occurred, imaging was halted to minimize photobleaching. Fluorescence and behavioural frame trigger signals were acquired at 10kHz for offline synchronisation.
Data analysis
Behavioural video and tracking data were sorted into peri-stimulus trials and manually annotated to mark behavioural events as described above. Fluorescence stacks were registered36 and background-subtracted (Fiji). Cell body-like structures were identified manually as regions-of-interest (ROIs; elliptic or polygonal areas) in Fiji using the maximum intensity projection of registered movies, aided by inspection of deconvolved images. For each animal, ROI masks were rigidly translated to account for FOV movement between imaging sessions, and new cells added to the FOV if they became visible. In some cases, the FOV moved such that ROIs could not be mapped to the previous sessions, and it was therefore counted as a new FOV. Mean intensity traces were extracted for each ROI, interpolated with the behavioural video frames and tracking data, and ΔF/f calculated on a trial-by-trial basis with a baseline of 5s before stimulus onset. Traces were then smoothed with a 20 point Hanning window and Z-scored. ROIs were only included in the analysis if they had transients with a Z-score above 2 at any time during the recording session, to ensure that they were live, active neurons. Average responses for each cell were obtained by averaging across all trials independent of the trial outcome and statistical analysis was performed on all cells pooled together. Ensemble average responses were obtained by averaging the responses of all cells in a field-of-view and summary statistics calculated over all trials for each field-of-view. For the ROC analysis, the annotated behavioural outcomes were used to sort data into ‘Escape’ and ‘No Escape’ classes, and the ROC curves and AUC statistics were calculated using the open-source package Scikit-learn. The SD for the AUC was estimated using bootstrapping. ‘Peri’ and ‘Pre-escape’ time periods were defined as escape onset ±1s and <1s, respectively. For the plot in Extended Data Fig. 4i, escape latencies were first binned and average calcium signal waveforms calculated for each bin, and the signal rise slope was obtained by fitting a linear function (y=mx+b). The onset of calcium signals was measured by finding the time of the peak and iteratively moving backwards along the signal to determine the time point at which the signal reaches the baseline. Peak calcium responses after conditioning were taken from a 5s time window starting when the animal entered the threat area.
Optogenetic experiments
For optogenetic activation37, VGluT2-Cre and VGluT2::EYFP mice were injected with AAV-DIO-ChR2-EYFP or -mCherry, (see Viruses) into the dmSC (80-120nl per side, ML: +/- 0.2 to 0.35, AP: -0.25 to -0.45, DV: -1.4 to -1.55) or dPAG (40-80nl per side ML: +/- 0.0 to -0.4, AP: -0.4 to -0.6, DV: -1.95 to -2.2). Control animals were injected with 120nl AAV2-DIO-EYFP into the dPAG. One optic fibre (200μm diameter, MFC-SMR; Doric Lenses Inc.) was implanted per animal, medially, 250-300μm dorsal to the injection site. For optical stimulation, light was delivered by a 473nm solid-state laser (CNI) in conjunction with a continuous ND filter wheel for varying light intensity (NDC-50C-4M, Thorlabs) and a shutter (LS6, Uniblitz) driven by trains of pulses generated in LabVIEW. In some experiments, this system was substituted by a laser diode module (Stradus, Vortran) with direct analogue modulation of laser intensity. Magnetic patchcords (Doric Lenses Inc.) were combined with a rotary joint (FRJ 1x1, Doric Lenses Inc.) to allow the cannula to be connected without restraint and allow unhindered movement. In all experiments, animals were placed in the standard arena and given 8min to acclimatise. As the fraction of cells spiking in a ChR2-expressing neuronal network increases as a function of light intensity in vivo38, we chose to systematically modulate light intensity as a proxy for setting the level of activation in the dPAG and mSC. For the intensity modulation assay, the laser intensity was set initially to give a low irradiance (0.1-0.2mW/mm2) that did not evoke an observable behavioural response. Mice were photostimulated (473nm, train of 10 light pulses of 10ms at 10Hz) upon entering the threat area with an inter-stimulus interval of at least 30s. After at least three trials of this intensity, the irradiance was increased by 0.1-0.3mW/mm2 until a behavioural response was observed, after which 8-15 trials were obtained at a given intensity, before further increasing the light intensity. This process was iterated until an intensity was reached which always evoked a flight response (Pescape=1). For one animal, the standard stimulus was not sufficient to reach Pescape=1 and the curve was acquired with a higher frequency stimulus (10 light pulses of 10ms at 20Hz). If the animal stopped exploring the arena, precluding Pescape=1 from being obtained, the experiment was terminated after 4hrs and not analysed. To normalise stimulation intensity and compare across animals, trials were first classified as escape if the animal reached the shelter within 5s of stimulation onset, to calculate the fraction of escape trials at a given intensity. The escape probability curve of each animal was then fitted with a logistic function (1/(1+e-k(x-x0)), and light intensities were normalised to x0. In the frequency modulation assay, high laser power was used (range, 12-13.5mW/mm2) and the stimulus consisted of 10 light pulses of 10ms at either 2, 5, 10, 20 and 40Hz, delivered in a pseudo-random order.
For histological confirmation of the injection site, animals were anaesthetised with Euthatal (0.15-0.2ml and transcardially perfused with 10ml of ice-cold phosphate-buffered saline (PBS) with heparin (0.02mg/ml) followed by 4% para-formaldehyde (PFA) in PBS solution. Brains were post-fixed overnight at 4°C then transferred to 30% sucrose solution for 48h. 30μm sections were cut with a cryostat (Leica CM3050S) and a standard free-floating immunohistochemical protocol was used to increase the signal of the tagged ChR2 and counter-stain neurons. The primary antibodies used were anti-GFP (1:1000, chicken; A10262, or rabbit; A11122, Life Technologies), anti-RFP (1:1000, rabbit; 600-401-379, Rockland) and anti-NeuN (1:1000, mouse; MAB-377, Millipore) and the secondary antibodies were Alexa-488 Donkey anti-rabbit and Goat anti-chicken, Alexa-568 Donkey anti-rabbit and Donkey anti-mouse, and Alexa-647 Donkey anti-mouse (1:1000, Life Technologies). Brain sections were mounted on charged slides using the mounting medium SlowFade Gold (containing DAPI; S36938, Life Technologies), and imaged using a wide-field microscope (Nikon TE2000).
For optogenetic inactivation experiments, VGluT2-Cre and VGluT2::EYFP mice were injected with AAV-DIO-iChloC-dsRed, (see Viruses) into the dmSC (250nl per side, ML: +/- 0.35, AP: 0.1 to -0.45, DV: -1.4 to -1.55) or dPAG (200nl per side, ML: +/- 0.4, AP: -0.4 to -1, DV: -2.2), with 2 injections per hemisphere along the AP axis spaced 300μm apart. Dual optic fibres (400μm diameter, 1.2mm apart, DFC_400/430-0.48_3.5mm_GS1.2_C60; Doric Lenses Inc.) were implanted at the injection site. Behavioural testing was done 10-41days after virus injection. Animals were presented with visual or auditory stimuli that elicited escape, and laser-on trials were interleaved with laser-off trials (473nm, 5-8s square pulse, 15mW/mm2). For histological confirmation of the fibre placement and injection site, animals were decapitated under anaesthesia, brains were quickly removed and post-fixed in 4% PFA overnight at 4°C. Slices of 100μm thickness were cut on a HM650V vibratome (Microm) in 0.1M PBS, stained with DAPI before mounting, and imaged on a wide-field microscope (Axio Imager 2, Zeiss).
Chemogenetic inactivation experiments
VGluT2-Cre and VGluT2::EYFP mice were injected with AAV-DIO-hM4D-nrxn-mCherry (see Viruses) into the dmSC (200-250nl per side, ML: +/- 0.35, AP: -0.1 to -0.45, DV: -1.4 to -1.55), with 2-3 injections per hemisphere along the AP axis. Dual guide cannulae were implanted at ML: +/- 0.6, AP: -0.55, DV: -1.6 to target the SC-dPAG projection, and ML: +/-1.7, AP: +1.7, DV: -2.05 (angle: 7° lateral from zenith) to target the SC-LP thalamus projection. In experiments with optogenetic stimulation, AAV-DIO-ChR2-EYFP was injected into the dmSC first (coordinates and volumes as above) and a 200μm optic fibre cannula was implanted at ML: +/-0.1, AP: -0.3, DV: 1.35 (angle: 35° posterior from zenith). After 20-55days, escape responses to optogenetic or visual stimuli were assessed in a baseline session to estimate the stimulus intensities that evoke escape with Pescape=1. 30min following microinfusion or i.p. injection, escape responses were reassessed using the same stimuli, and, for optogenetic activation, 200% of baseline intensity or frequency were tested in addition to the baseline strength. For cerebral microinfusions, CNO was diluted in buffered saline containing (in mM): 150 NaCl, 10 D-glucose, 10 HEPES, 2.5 KCl, 1 MgCl2, and to a final concentration of 1 or 10μM. Experiments with visual-evoked escape were done with 1μM, and optogenetically-evoked escape with 1 and 10μM. There was no significant difference between 1 and 10μM at the electrophysiological and behavioural level, and the data have thus been pooled (comparisons between 1μM and 10μM CNO: ChR2-induced firing of SC VGluT2+ neurons, P>0.999 Wilcoxon test; SC-dPAG VGluT2+ EPSC amplitude, P=0.0973 Mann Whitney test; Pescape after CNO microinfusion, P=0.6095, Mann Whitney test). Cerebral microinfusions of CNO or vehicle were performed as described above using 500μm protruding internal cannulae (see Pharmacological Inactivation), with a volume of 0.6-1.0μl per hemisphere. For i.p. injections, 1mg CNO was dissolved in 1ml 0.9% saline just before the experiment and injected at a final concentration of 10mg/kg. Repeated administration of CNO was separated by 2-3 days, preceded by a new baseline session for each treatment. Histological confirmation of cannula placements and viral infection was performed as stated above.
Electrophysiological recordings in acute midbrain slices
Data acquisition
Coronal slices were prepared from VGluT2::EYFP mice aged 6–12 weeks. Brains were quickly removed and transferred to ice-cold slicing solution containing (in mM): 87 NaCl, 26 NaHCO3, 50 sucrose, 10 glucose, 2.5 KCl, 1.25 NaH2PO4, 3 MgCl2, 0.5 CaCl2. Acute coronal slices of 250μm thickness were prepared at the level of the SC and PAG (-4.8 to -4.1mm from bregma) using a vibratome (VT1200, Leica or 7000smz-2, Campden). Slices were then stored under submerged conditions, at near-physiological temperature (35°C) for 30min before being cooled down to room temperature (19–23°C). For recordings, slices were transferred to a submerged chamber and perfused with ACSF containing (in mM): 119 NaCl, 26 NaHCO3, 10 glucose, 2.5 KCl, 2 CaCl2, 1 MgCl2, 1 NaH2PO4 (heated to 34°C at a rate of 2–3 ml min-1). All ACSF was equilibrated with carbogen (95% O2, 5% CO2, final pH 7.3). Whole-cell patch-clamp recordings were performed with an EPC 800 amplifier (HEKA). Data was digitised at 20kHz (PCI 6035E, National Instruments), filtered at 5kHz and recorded in LabVIEW using custom software. Pipettes were pulled from borosilicate glass capillaries (Harvard Apparatus, 1.5mm OD, 0.85mm ID) with a micropipette puller (P-1000, Sutter, USA or P-10, Narishige, Japan) to a final resistance of 4-6MΩ. Pipettes were backfilled with internal solution containing (in mM): 130 KGluconate or KMeSO3, 10 KCl, 10 HEPES, 5 phosphocreatine, 2 Mg-ATP, 2 Na-ATP, 1 EGTA, 0.5 Na2-GTP, 285–290mOsm, pH was adjusted to 7.3 with KOH. VGluT2+ dPAG and dmSC cells were visualised on an upright Slicescope (Scientifica) using a 60x objective (Olympus) and identified based on location and EYFP expression. The resting membrane potential (RMP) was determined immediately after establishing the whole-cell configuration and experiments were only continued if cells had a RMP more hyperpolarised than -45mV. Input resistance (Rin) and series resistance (Rs) were monitored continuously throughout the experiment, and Rs was compensated in current-clamp recordings. Only cells with a stable Rs <30MΩ were analysed. For ChR2-assisted circuit mapping, recordings were made 10-51 days (mean= 22.3±2.3 days) after injection of AAV2-DIO-ChR2-mCherry into the mSC or dPAG of VGluT2::EYFP mice. ChR2 was stimulated with wide-field 490nm LED illumination (pe-100, CoolLED, 1ms or 10ms pulse length, maximum light intensity=2.7mW). To characterise the cellular effects of iChloC activation, dPAG or dmSC VGluT2+ cells expressing AAV5-DIO-iChloC-dsRed were recorded from at 46 days after infection, and iChloC was stimulated with 1s long, 490nm light pulses. Recordings in animals expressing hM4D-nrxn in the dmSC were made 22-53 days after injection (mean= 29.4±3.1 days), and ChR2 was activated at 10, 20 and 100% light intensity (0.27, 0.54 and 2.7mW).
Pharmacology
No drugs were added to the recording ACSF, except for the following experiments: miniature EPSCs (mEPSCs) were recorded in 1μM Tetrodotoxin (TTX, Sigma Aldrich), and ESPC recordings shown in Extended Data Fig. 8 were recorded in 1μM TTX and 100μM 4-Aminopyridine (4-AP, Sigma Aldrich); to test the effect of hM4D-neurexin activation on firing rates and synaptic transmission, 1-10μM CNO (freebase, Hellobio) was added to the ACSF during recordings.
Data analysis
Analysis was performed using custom-written procedures in Python, except for the analysis of sEPSCs and mEPSCs which was done in IGOR Pro 6 (WaveMetrics) using TaroTools (by Taro Ishikawa). The Rin was calculated from the steady-state voltage measured in response to a hyperpolarising test pulse of 500ms duration at a holding potential of −60mV. The membrane time constant was calculated by fitting the decay of the test pulse with a single exponential (y=y0+Ae(-(x-x0)/τ)). The membrane potential values stated in the text are not corrected for liquid junction potentials. The sEPSC frequency before and after ChR2 stimulation was calculated from 6-8 repetitions per cell. Failures of light-evoked synaptic transmission were defined as a peak amplitude of less than the mean current baseline +2SD in a time window defined by the onset of the mean evoked synaptic current ±5ms. Quantal content calculated by the direct method was obtained by dividing the peak amplitude of the evoked current by the peak amplitude of the sEPSCs in the same cell (which is not significantly different from the mEPSC amplitude, see Extended Data Fig. 8f-h), and the Poisson estimation was calculated as loge(failure rate)-1 39,40. The paired-pulse ratio was calculated as the ratio of peak amplitudes between the second and first EPSCs in a train. Effects of drug application were calculated after a perfusion time of at least 10min. Statistical analysis was performed on cells pooled across animals.
Single unit recordings
Data acquisition
Neuropixels silicon probes (phase3, option1, 384 channels41) were used to record extracellular spikes from dmSC neurons in three male adult C57BL/6J wild-type mice. A craniotomy was made over the SC and sealed with Kwik-Cast, followed by attachment of a metal custom-made head-plate and ground pin to the skull, using dental cement. At least 36 hours after surgery, mice were placed on a plastic wheel and head-fixed at an angle of 30° from the anterior-posterior axis, parallel to an LCD monitor (Dell, 60Hz refresh rate) centred 30 cm above the head. Prior to recording, the probe was coated with DiI (1mM in ethanol, Invitrogen) for track identification and a wire was connected to the ground pin for external reference and ground. For recording, the probe was slowly inserted into the SC (AP: -0.5 to -0.7, ML: 0.4 to 0.8) to a depth of 2.8-3.0 mm and left in place for at least 20 minutes before the beginning of the recording session. Data was acquired using spikeGLX (https://github.com/billkarsh/SpikeGLX, Janelia Research Campus), high-pass filtered (300Hz), amplified (500x), and sampled at 30kHz. Sensory stimuli were delivered and synchronized using custom-made LabVIEW software and a PCIe-6353 board (National Instruments). Visual and auditory stimuli (98% contrast; 50% contrast; sound) were presented interleaved with a 1min interval and a total of 30 presentations each.
Data analysis
Analysis was performed in MATLAB 2017a. Raw voltage traces were band-pass filtered (300-5000Hz), spikes were detected and sorted automatically using JRCLUST42, followed by manual curation. Only units with a clear absolute refractory period in the auto-correlogram were classified as single units. Firing rate histograms were calculated as the average firing rate in bins of 1ms for 30 consecutive trials, and subsequently smoothed. Units were considered to respond to the threat stimulus if their firing rate increased by at least 1Hz in a 500ms time-window from stimulus onset when compared to the baseline (500ms before stimulus onset). Peak firing rates for each stimulus were calculated as the mean of a 30ms time-window centred on the time of the average peak firing rate of all responding units. Responses to 50% contrast visual stimuli were calculated on all units that responded to 98% contrast. For units showing persistent activity after stimulus offset, the time constant to decay to baseline was obtained by fitting a single exponential to the average firing rate histogram. Statistical analysis was performed on single units pooled from all animals.
Retrograde tracing
For monosynaptic rabies tracing43,44 from the dPAG, TVA and RG were injected unilaterally into the dPAG45 with an angled approach from the contralateral hemisphere to avoid infection of the SC in the target hemisphere (20°, AP: -0.45 to -0.5, ML: -0.6, DV: -2.2,). EnvA-dG-RV-mCherry was injected into the dPAG vertically (AP: -0.4, ML: +0.5, DV: -2.1) 10-14days later. Animals were perfused seven days post-rabies virus injection. Brains were cut at 100μm thickness on a microtome (HM650V, Microm). All sections containing the PAG and SC were mounted in SlowFade Gold, and imaged using a confocal microscope (SP8, Leica). Tile scans of the entire section were acquired with a 25x water objective (Olympus) at five depths (10μm apart) and maximum projections of these stacks were used for subsequent analysis. Cell counting was done manually (Cell counter plug-in, Fiji) in reference to the Paxinos and Franklin atlas46. To quantify the position of presynaptic SC cells along the mediolateral axis, the coordinates of the counted cells were normalised to the medial and lateral extents of the SC for each brain slice, and a kernel density estimation was performed (Scikit-learn, Python). For retrograde tracing from the dmSC, rAAV2-retro-mCherry was injected unilaterally. AAV2-CamkII-GFP was co-injected to label the injection site in 2 out of 3 brains. Animals were sacrificed 14-18 days afterwards and their brains processed as described above. Every third section along the rostrocaudal axis of the SC was imaged with on an Axio Imager 2 (Zeiss) and presynaptic cells in the dPAG and auditory cortex were counted manually.
Histological quantifications
To estimate the fraction of VGluT2+ cells in a target area that were infected with viral vectors, we compared the density of infected cells in VGluT2-Cre animals at the implant site, to control densities quantified using the VGluT2::EYFP reporter line. Optogenetic vectors infected 86±6% for dPAG and 95±9% for mSC; GCamp6 infected 90±8% for dPAG and 86±1% for mSC; hM4D infected 93±15% for mSC. The placement of optic fibres, GRIN lenses and cannulae was assessed histologically based on their tract and tip location, and their tip locations are illustrated in the respective sections of the Paxinos mouse brain atlas46 (see Extended Data Figures).
General data analysis
Data analysis was performed using custom-written routines in Python 2.7. and custom code will be made available per request. Data are reported as mean±SEM unless otherwise indicated. Sample size is denoted as n (number of cells/trials, as appropriate) and N (number of animals). Statistical comparisons using the significance tests stated in the main text were made in SciPy Stats and GraphPad Prism, and statistical significance was considered when P<0.05. Data were tested for normality with the Shapiro-Wilk test, and a parametric test used if the data were normally distributed, and a non-parametric otherwise, as detailed in the text next to each comparison.
Extended Data
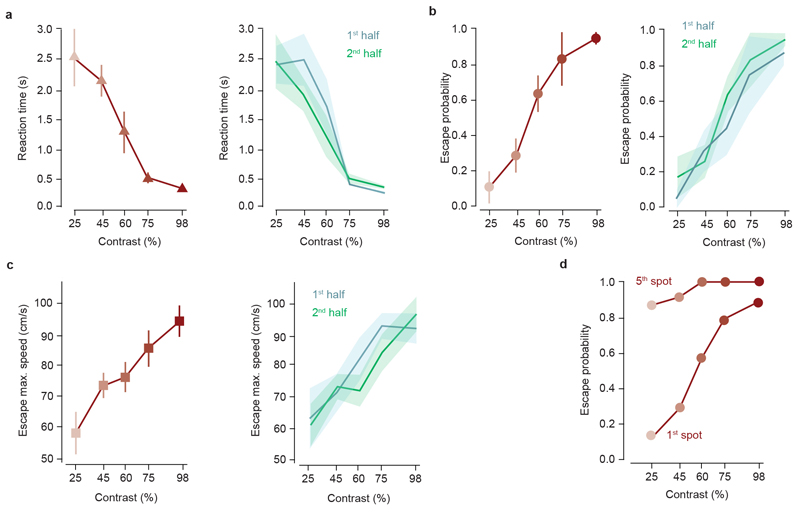
Extended Data Figure 1. Behaviour metrics computed over single mice.
a-c, Summary plots for escape behaviour metrics calculated for each mouse individually and averaged. Plots on the left were obtained with data from all trials, and in the plots on the right, trials for each contrast were split in half and the behaviour metrics calculated for each half. There is a significant dependency on contrast for all metrics (reaction time: P=3.5x10⁻⁸; escape probability: P=2.1x10⁻⁷; escape vigour: P=1.6x10⁻⁶, repeated measures ANOVA), and no significant difference between the metrics calculated using the first and second half of the trials (P>0.4 for a main effect of trial group in all comparisons, 2-way repeated measures ANOVA), indicating that behavioural performance was stable across repeated presentations of the stimulus. Error bars and shaded areas are SEM. d, Escape probability after the first (as shown in Fig. 1e, calculated by pooling all data) and fifth spot, during the presentation of 5 consecutive expanding spots.
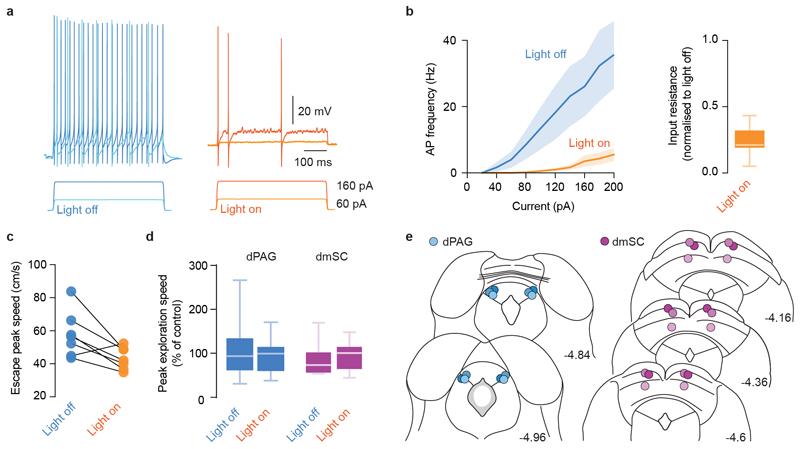
Extended Data Figure 2. iChloC activation strongly reduces neuronal firing and disrupts defensive behaviour without affecting basal locomotion.
a, Example voltage traces showing a VGluT2+ dmSC neuron expressing iChloC responding to current steps in control conditions (Light off) and during continuous illumination with 473nm light (Light on). b, Summary relationship between current injection and action potential firing showing a strong reduction in firing upon illumination (left, average 87.9±3% reduction across all steps, P=1.7x10⁻⁹ for a main effect of light, 2-way repeated measures ANOVA; P<0.05 for simple effects of light on current steps larger than 100pA), as well as a strong reduction in input resistance (right, 73.2±3% reduction, P=1.23x10⁻⁸, t-test). Summary data are pooled from 6 dPAG and 3 dmSC cells. c, For the 18% of trials in which VGluT2+ animals expressing iChloC in the dmSC escape from threat stimuli during continuous illumination (Light on), the vigour of escape is significantly lower (77±7% of Light off) when compared to escapes elicited without iChloC activation (Light off; n=7 trials, N=6 out of 9 animals, P=0.0253, paired t-test). d, Movement during exploration is not affected by iChloC activation in dPAG- or dmSC-targeted animals in the absence of threat, quantified as the maximum speed in the 5s stimulation period (Light on) or control period (Light off) as a percentage of the 5s pre-stimulation period (P=0.8767 for dPAG, P=0.3443 for dmSC, U-test). e, Optic fibre placements for all experiments in dPAG (N=6, blue circles) and dmSC (N=9, magenta circles), coordinates are in mm and from bregma. Mouse brain images reproduced with permission from Elsevier46.
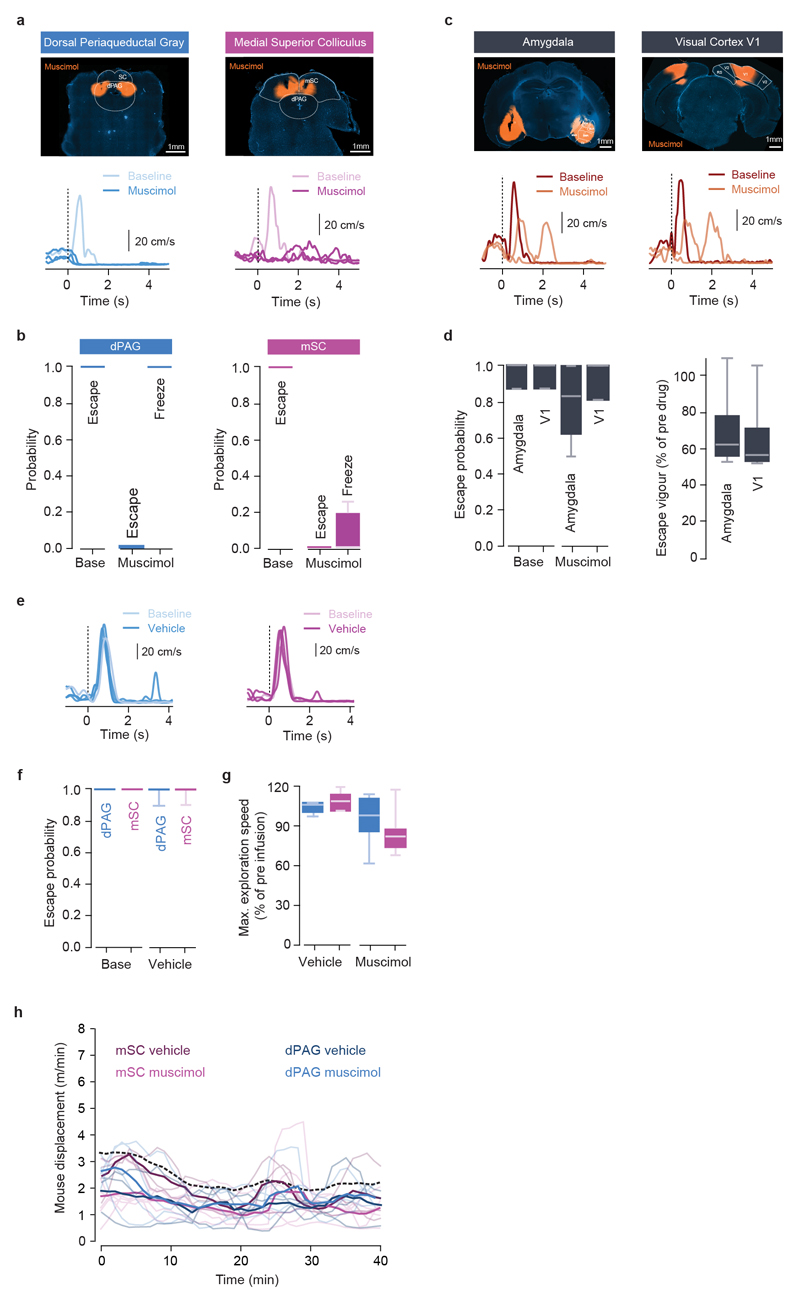
Extended Data Figure 3. Muscimol inactivation of dPAG and mSC abolishes escape while V1 and amygdala have a modulatory effect on escape behaviour.
a, Top, example images of muscimol infusion in the dPAG (left) and mSC (right), and respective speed traces in response to a threatening visual stimulus (bottom) showing a switch from escape to freezing after dPAG inactivation and a loss of defensive responses after mSC muscimol inactivation. b, Summary quantification of the effect of muscimol infusion on threat-evoked defensive behaviour probability in the dPAG (left; N=7, P=0.0001 for escape, and P=0.00025 for freezing, U-tests) and mSC (right; N=10, P=0.00021 for escape, and P=0.051 for freezing, U-tests). c, Top, images of bilateral muscimol infusion in the amygdala (left) and visual cortex area V1 (right). Respective speed traces during threatening visual stimulus presentation (bottom) show that mice still engage in escape behaviour, but with reduced vigour. d, Summary quantification for escape probability (left) and vigour (right) after amygdala and V1 acute inactivation (amygdala: N=4, P=0.37 for probability, U-test; P=0.01 for vigour, two-tailed t-test; V1: N=4, P=0.5 for probability, U-test; P=0.01 for vigour, two-tailed t-test). e, Example speed traces showing that vehicle infusion in the mSC and dPAG does not change threat-evoked escape probability, and respective summary quantification. f, Infusion of mSC and dPAG with vehicle does not affect escape probability (mSC; N=5, P=0.21, U-test; dPAG; N=5, P=0.21, U-test). g, Infusion of mSC and dPAG with muscimol or vehicle does not affect running speed during exploratory behaviour (mSC: P=0.8 for vehicle, P=0.22 for muscimol; dPAG: P=0.28 for vehicle, P=0.75 for muscimol, paired t-tests). h, Profile of exploratory behaviour for behavioural sessions lasting at least 40 min, after injection of vehicle or muscimol in the mSC and dPAG. The displacement over time for all conditions is not significantly different than the profile for multiple trials of visual threat stimulation in control conditions (dashed black line, same data shown in Extended Data Fig. 5e; P>0.1 for all comparisons with control, two-tailed t-test). Thin lines show individual mice and thick lines show the dataset mean. Box-whisker plots show median, IQR and range.
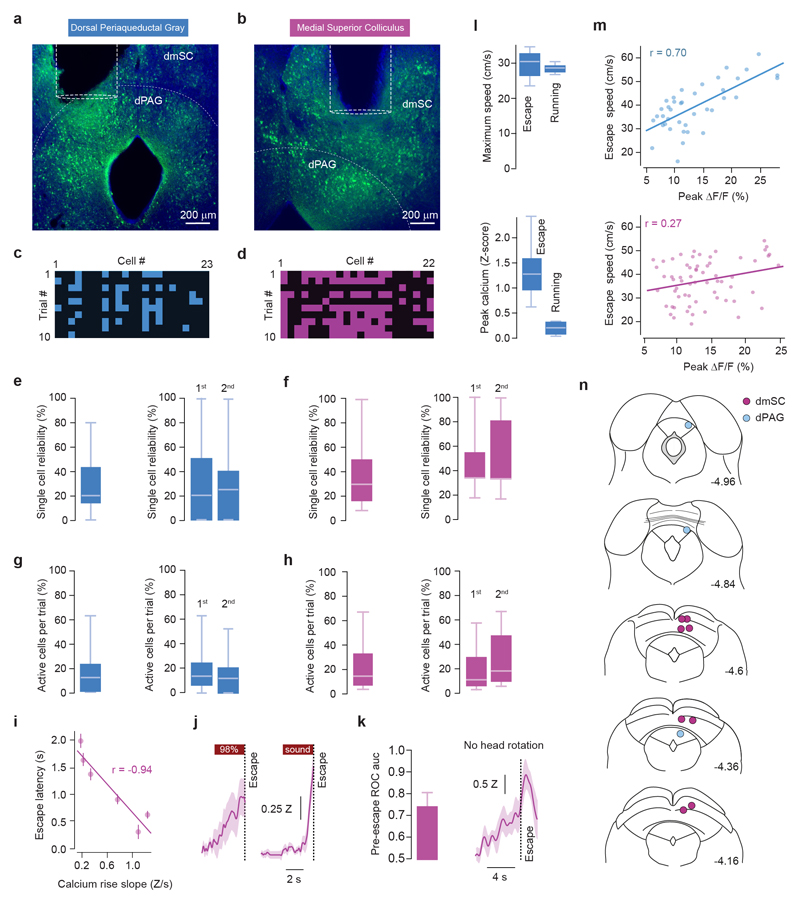
Extended Data Figure 4. The reliability and fraction of active cells is stable over multiple trials of calcium imaging, activity in the dmSC does not reflect head rotation and rises with different slopes, and dPAG activity is specific to escape.
a,b, Example images of GCaMP6s expression in VGluT2+ cells (green), with schematic showing GRIN lens placement in the dPAG and dmSC. c-d, Raster plots showing active (colour squares) and non-active cells (black squares) in a single field-of-view (FOV) imaged over multiple trials. A total of 8 FOVs were imaged in the dPAG with a mean of 18 cells per FOV (range = [7,30]) and 11 trials per FOV; and in the dmSC, 11 FOVs were imaged with a mean of 20 cells per FOV (range = [7,31]) and 20 trials per FOV. There was a mean of 7 escape-responding cells per dPAG FOV and 16 escape-responding cells per dmSC FOV. e,f, Reliability of escape-responding cells showing a response over multiple trials for all trials (left) and for the first and second half of trials separately (right). Mean reliability across all trials was 28±3% for dPAG and 35±3% for dmSC, and stable over multiple trials (P=0.44 for dPAG, P=0.11 for dmSC, comparison between the two groups of trials, U-test). g,h, Fraction of all cells in a FOV that were active on each trial for all trials (left) and for the first and second half of trials separately (right). The active fraction across all trials was 14±3% for dPAG and 23±6% for dmSC, and stable over multiple trials (P=0.21 for dPAG, P=0.08 for dmSC, comparison between the two groups of trials, U-test). i, Correlation between the rise slope of the population activity and escape latency (n=75 trials, P=0.0048, Pearson’s r). j, Average population calcium signal in the dmSC for escape trials in response to 98% contrast spots and sound stimuli. The slope of the signal rise is steeper for sound-evoked escape. k, Left, ROC auc for the dmSC signal before spontaneous escape onset after conditioning (auc at escape onset = 0.74, significantly above chance 2.1s before escape, N=57 trials). Right, average population calcium signal in the dmSC during threat-evoked escape trials where the mouse was already facing the shelter and thus did not rotate the head (N=5 trials). l, Summary quantification of dPAG population calcium signals during threat-evoked escape and spontaneous foraging running bouts of similar speed (top; N=6 escape trials and N=6 running bouts, speed not significantly different, P=0.64, t-test), showing that activity increase in the dPAG is specific for escape (bottom; P=0.0018, t-test). Shaded areas show SEM, box-whisker plots show median, IQR and range. m, Correlation between the population activity of dPAG (top; n=39 trials, P=6.7x10⁻⁷, Pearson’s r) and dmSC (bottom; n=64 trials, P=0.04, Pearson’s r) and escape speed. Each data point is a single trial. n, Placement of GRIN lenses in the dmSC (magenta circles) and dPAG (blue circles), coordinates are in mm and from bregma. Mouse brain images reproduced with permission from Elsevier46. Box-whisker plots show median, IQR and range.
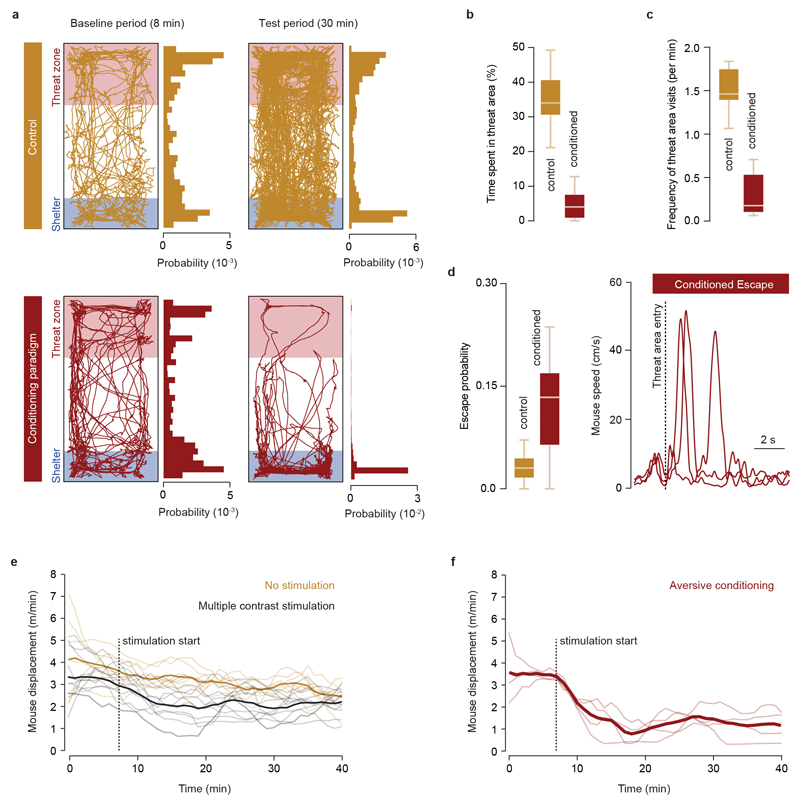
Extended Data Figure 5. Repeated high-contrast visual stimulation causes place aversion, reduction in exploration and spontaneous escape.
a, Traces and probability distributions for the location of two example animals during free exploration (top), and before and after a high contrast visual stimulation conditioning paradigm (bottom), showing avoidance of the threat area after conditioning (bottom right). b, Time spent in the threat area decreases with aversive conditioning (35.1±3.5% for naïve animals vs 5.1±2.0% after conditioning, N=7 mice, P=2.2x10⁻⁵, two-tailed t-test). c, The frequency of visits to the threat area by the animals decreases significantly after conditioning (1.51±0.10 visits/min for naïve animals vs 0.30±0.12 after conditioning, N=7 mice, P=1x10⁻⁴, two-tailed t-test). d, Summary quantification of spontaneous escape probability (left) and single trial speed traces from three animals (right) showing spontaneous escape after conditioning (Pspontaneous escape 3.2±0.8% for naïve animals, N=7, and 12.2±2% after conditioning, N=13 mice; P=0.004, two-tailed t-test). e, Profile of exploratory behaviour during behavioural sessions of multiple contrast stimulation (black, data taken from the animals that generated the dataset for Fig. 1) with no stimulation for comparison (orange). Exploration decays over time and the decay is accelerated by visual stimulation, but the two curves are not significantly different over time (2.4±0.3 m/min at 40 min for control vs 2.0±0.3 with visual stimulation, P=0.16, two-tailed t-test). f, Same quantification as in E for sessions of aversive conditioning. Aversive conditioning significantly reduces exploratory behaviour (1.2±0.3 m/min after conditioning, P=0.018 vs no stimulation and P=0.039 vs multiple contrast stimulation, two-tailed t-test). Thin lines show individual mice monitored for 40 min and thick lines show the dataset mean. Box-whisker plots show median, IQR and range.
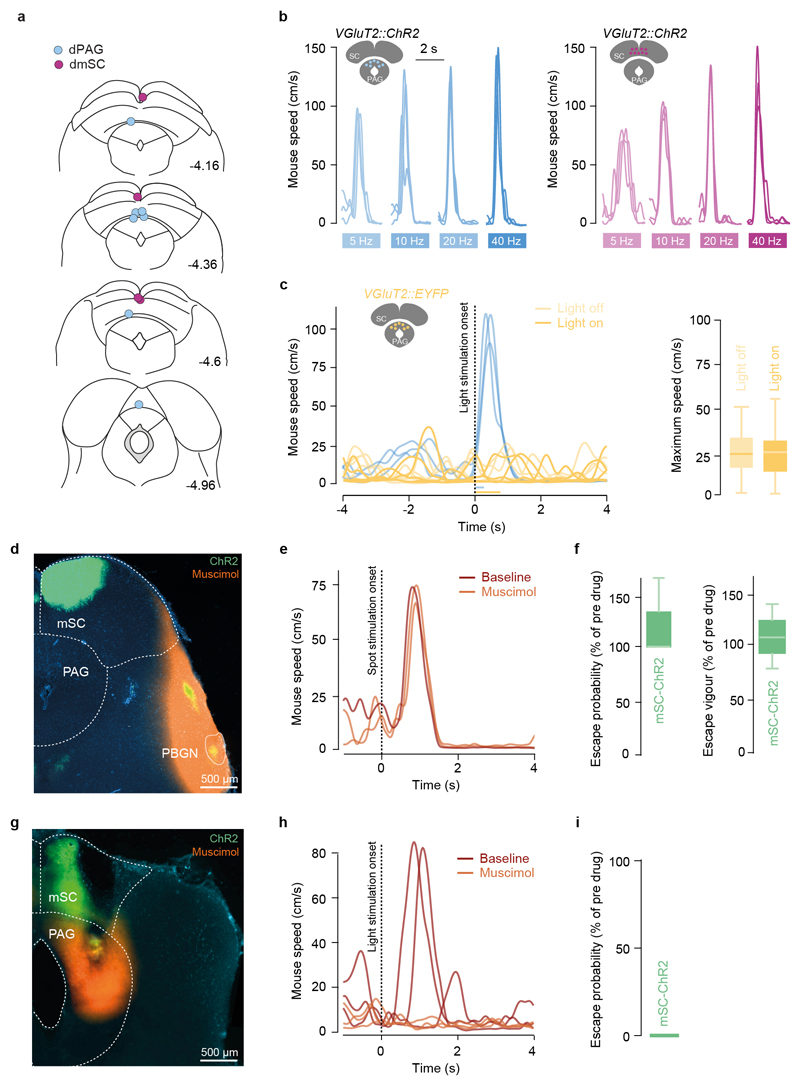
Extended Data Figure 6. Optogenetic activation of dPAG and mSC elicits escape over a range of frequencies, and mSC VGluT2::ChR2-evoked escape is abolished by inactivating the PAG, but not the PBGN.
a, Optic fibre placements for ChR2 stimulation in the dmSC (magenta circles) and dPAG (blue circles), coordinates are in mm and from bregma. Mouse brain images reproduced with permission from Elsevier46. b, Example speed traces for dPAG (left) and mSC (right) ChR2 stimulation at different frequencies (10 pulses) and high light intensities, showing robust escape behaviour for 5 to 40Hz stimulation. c, Left, speed traces for 473nm light stimulation (40Hz, 30 pulses) of one mouse expressing EYFP in the dPAG (dark green), showing no change in running speed. Light green traces show similar speed profiles for the same mouse entering the stimulation area with light off. Blue dashed traces are from a different animal expressing ChR2 in the dPAG (40Hz, 10 pulses), for comparison. Right, summary data for EYFP control stimulation in dPAG (running speed not significantly different between laser on and off, N=236 trials from 3 animals, P=0.48, U-test). Box-whisker plots show median, IQR and range. d, Image showing expression of ChR2-EYFP in the mSC (green) with projections to the PBGN (yellow) and muscimol infusion (orange). e, Speed traces for spot-evoked escape responses from one mouse before and after acute PBGN inactivation. f, Summary data for escape probability and vigour during mSC optogenetic stimulation and PBGN acute inactivation, showing no difference (N=3 animals, P=0.80 for probability; P=0.70 for vigour, U-test). g, Image showing expression of ChR2-EYFP in the mSC (green) and muscimol infusion in the PAG (orange). h, Speed traces and summary data (i) showing that mSC ChR2-evoked escape is abolished by PAG acute inactivation (N=3 animals, P=0.0297 for probability, U-test). Box-whisker plots show median, IQR and range.
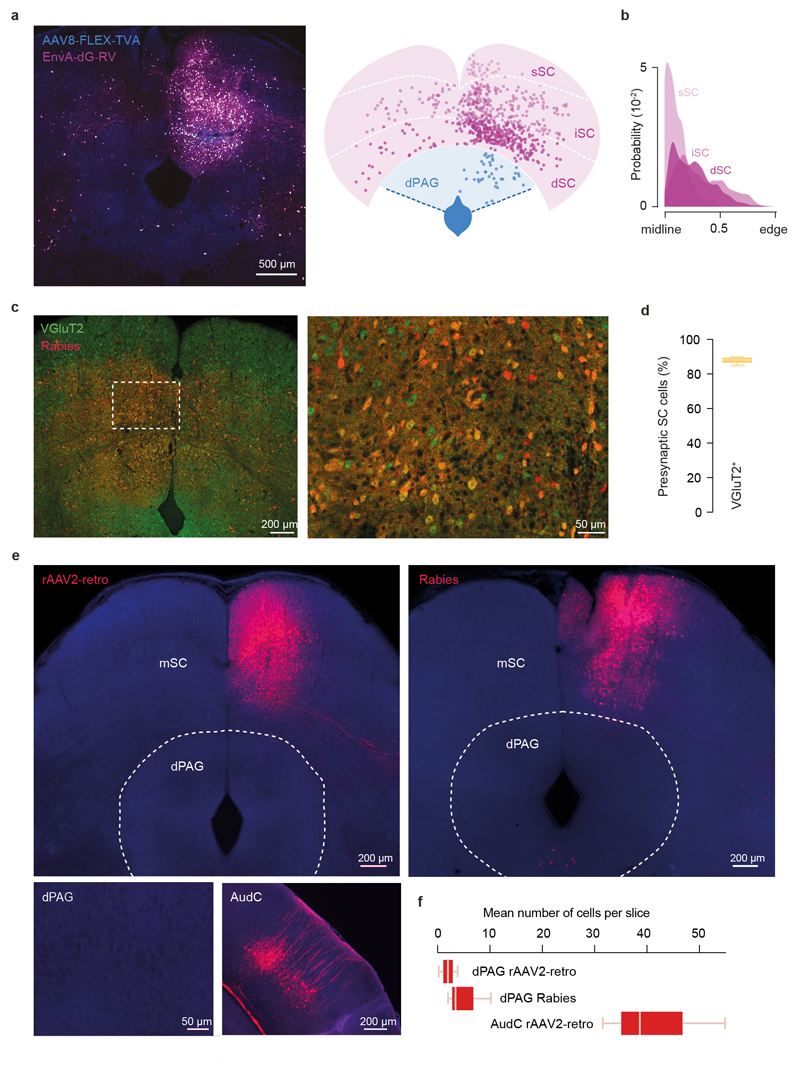
Extended Data Figure 7. dPAG neurons receive input from mainly excitatory cells in the SC and do not project back to the SC.
a, Image showing starter dPAG VGlut2+ cells expressing both TVA-GFP and RV-mCherry and presynaptic cells expressing RV-mCherry only (left), and corresponding schematic (right) illustrating the position of starter dPAG (blue) and presynaptic SC cells (pink) across deep, intermediate and superficial SC layers (same as shown in Fig. 4a). b, Kernel density estimation curves for the axial position of presynaptic SC cells for each layer (82.9±2.6% of 1770 cells are located within the medial bisection of ipsilateral SC, N=3 mice). c, Image showing presynaptic cells in the mSC infected with rabies virus (red) from starter neurons in the dPAG of a VGluT2::EYFP mouse (left). Box indicates area magnified shown on the right. Yellow cells are VGluT2+ mSC presynaptic neurons. d, Summary quantification of the percentage of presynaptic cells in the mSC that express VGluT2+ (mean=87.9±1.0%, N=4). e, Image showing injection of rAAV2-retro in the mSC (left) and no retrogradely labelled cells in the dPAG (bottom, left), while retrograde labelling is present in the auditory cortex for comparison (bottom, right). Similarly, rabies virus injected in the mSC shows a lack of presynaptic cells in the dPAG (right), suggesting a predominantly feed-forward connectivity arrangement between the mSC and dPAG (note however that it cannot be excluded that both rAAV2-retro and rabies display selective tropism that prevents labelling of dPAG neurons). f, Summary quantification for retrogradely labelled cells in the dPAG and auditory cortex after mSC rAAV2-retro (N=3) or rabies infection (N=3). Box-whisker plots show median, IQR and range.
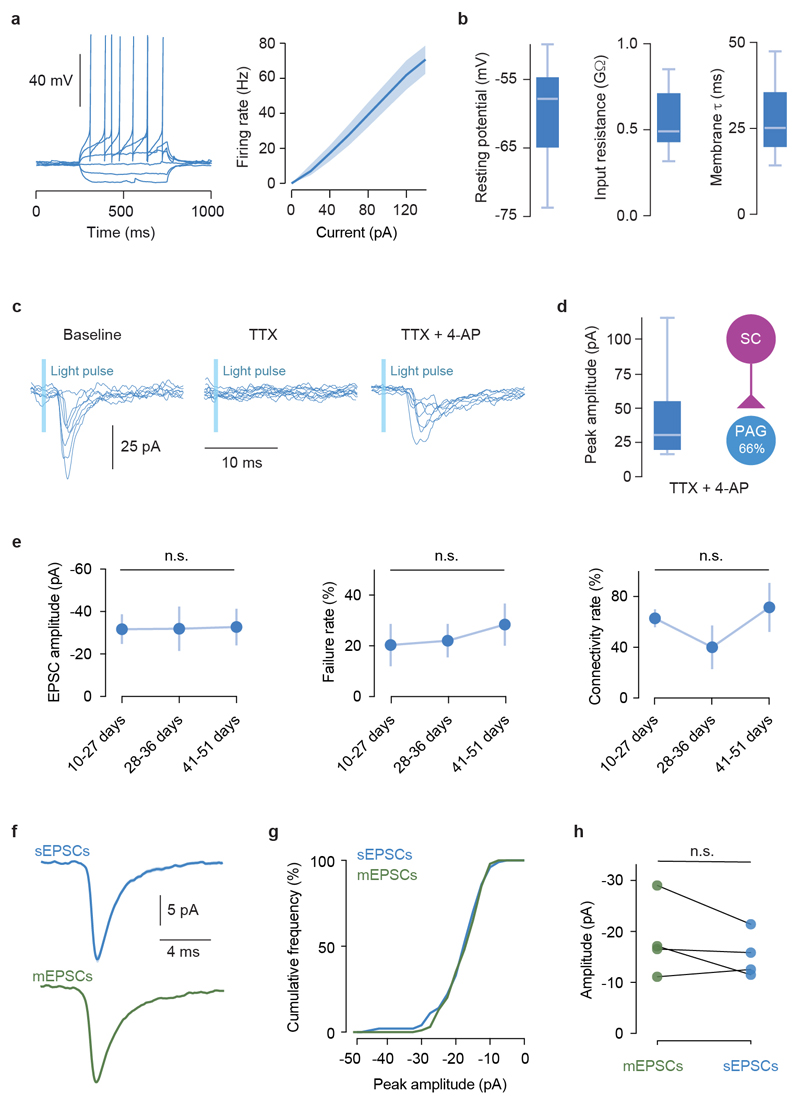
Extended Data Figure 8. Biophysical properties of excitatory dPAG neurons and synaptic properties of the dmSC-dPAG excitatory connection.
a, Example trace of current step injections in a VGluT2+ dPAG cell (left) and summary current-frequency relationship (right, shaded area is SEM). b, Summary quantification of resting membrane potential (mean=-61.4±2.15), input resistance (mean=0.55±0.05GΩ) and membrane time constant (mean=28.3±3ms) for VGluT2+ dPAG cells (n=14, N=7). c, Example current traces for one dPAG VGluT2+ cell showing optogenetically-evoked EPSCs from the dmSC (left) that are blocked by TTX (middle) and recovered by 4-AP (right), confirming the presence of a monosynaptic connection. d, Summary data for peak dmSC-dPAG EPSC amplitudes and connectivity rate in the presence of TTX and 4-AP. Box-whisker plot shows median, IQR and range. e, Summary data showing that the properties of the dmSC-dPAG connection do not change with number of days after viral transfection of ChR2, and remain weak and unreliable (N=15, P=0.78, 0.51 and 0.33 for amplitude, failure rate and connectivity rate, respectively, Kruskal-Wallis test). Plots show mean and SEM. f, Average waveforms for sEPSCs and mESPCs (recorded in TTX) in one cell, and respective cumulative histogram for peak amplitudes g, Peak amplitude of sEPSCs and mEPSCs is not significantly different (n=4 cells, P=0.18, 0.79, 0.9 and 0.36 respectively, Kolmogorov-Smirnov test for 100 events in each condition per cell). Box-whisker plots show median, IQR and range.
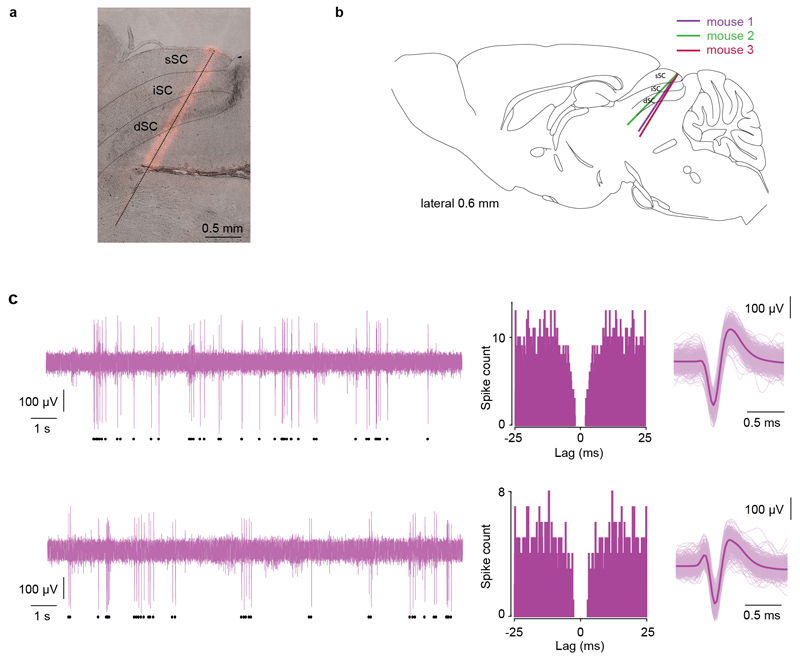
Extended Data Figure 9. Silicon probe anatomical placement and examples of dmSC single units.
a, Example image showing the track left by one probe stained with DiI, superimposed on a bright-field image of a 30μm sagittal slice. b, Schematic illustrating the probe track in each animal (sagittal section, 0.6mm lateral to the midline). Mouse brain image reproduced with permission from Elsevier46c, Two examples of dmSC single units (top and bottom). Left, raw voltage trace from the channel with the strongest signal for the unit of interest (black symbols below indicate all spikes detected for the unit). Middle, auto-correlogram of spike times calculated in bins of 1/30ms. Right, superimposed action potential waveforms chosen randomly from the whole recording (light colour) and average waveform (dark colour).
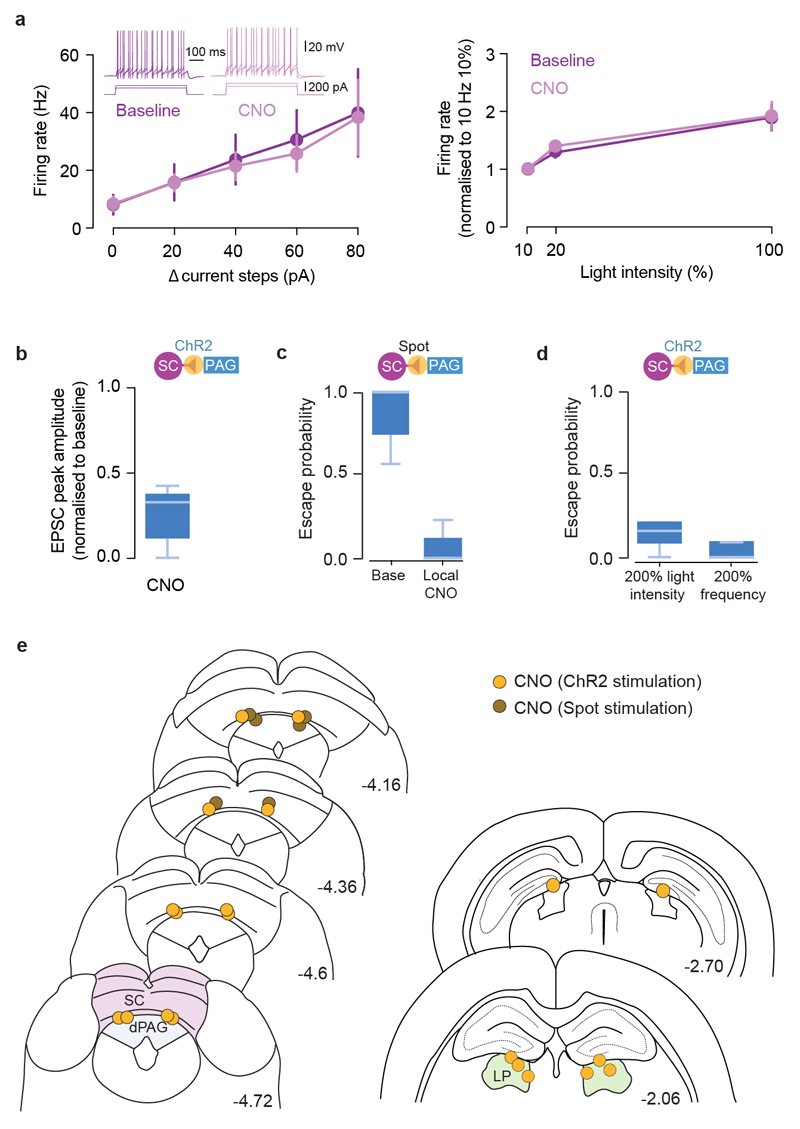
Extended Data Figure 10. Controls and cannulae placements for chemogenetic inactivation experiments.
a, Summary in vitro data for hM4D-neurexin/ChR2-expressing VGluT2+ dmSC neurons before (baseline) and after CNO application (CNO), showing no effect of CNO on action potential firing in response to current injection (left, N=6 cells, P=0.8738 for main effect of CNO, 2-way repeated measured ANOVA; inset shows example traces to two current steps) or to 473nm light-evoked ChR2 activation (right, N=9 cells, P=0.7006 for main effect of CNO, 2-way repeated measured ANOVA). Error bars are SEM. b, CNO application reduces dmSC-dPAG excitatory synaptic transmission by 71±7% (N=10 cells, P=6.19x10⁻⁶, two-tailed t-test between baseline and CNO). c, Disrupting mSC-dPAG synapses with CNO microinfusion in behaving animals blocks visually-evoked escape behaviour (N=3 mice, P=0.036, U-test). d, Doubling the intensity or frequency of mSC stimulation while locally blocking mSC-dPAG synapses is not sufficient to rescue escape behaviour (N=5 mice, P=0.11 for intensity, U-test; P=0.42 for frequency, U-test; both comparisons against escape probability after local block in baseline conditions shown in Fig. 4l). e, Cannula placements for local inactivation experiments with CNO at the SC-PAG synapse (left panel) and at the SC-LP synapse (right panel). The tip of the internal cannulae is indicated by yellow circles (for experiments with optogenetic stimulation of dmSC VGluT2+ cells) and brown circles (for experiments with visual stimulation). Coordinates are in mm and from bregma. Mouse brain images reproduced with permission from Elsevier46. Box-whisker plots show median, IQR and range.
Supplementary Material
Supplementary Information is available in the online version of the paper.
Acknowledgments
This work was funded by a Wellcome Trust Henry Dale Fellowship (098400/Z/12/Z), Medical Research Council (MRC) grant MC-UP-1201/1, Wellcome Trust/Gatsby Charitable Foundation SWC Fellowship (T.B.), MRC PhD Studentship (D.E., R.V.), Boehringer Ingelheim Fonds PhD fellowship (R.V.), DFG fellowship (A.V.S, S.R.), Marie Skłodowska-Curie Individual Fellowship (706136) and EMBO Long Term Fellowship (Y.L). We thank P. Latham and members of the Branco lab for discussions, S. Sternson, P. Dayan, T. Margrie and T. Mrsic-Flogel for comments on the manuscript, S. Sternson, S. Wiegert, T. Oertner, T. Margrie for gifts of viral vectors, P. Iordanidou, T. Okbinoglu, L. Jin, the LMB and SWC Biological Research Facility and FabLabs for technical support, D. Campagner, T. Harris and N. Steinmetz for help with silicon probe recordings, K. Betsios for programming the data acquisition software.
Footnotes
Author contributions
D.A.E, A.V.S, R.V. and S.R. performed behavioural and optogenetic experiments. T.B; theoretical modelling, D.A.E; calcium imaging, A.V.S and T.B.; in vitro electrophysiology, Y.L and R.V; single-unit recordings, D.A.E and A.V.S; chemogenetic experiments, A.V.S; rabies tracing. All authors analysed data and contributed to the experimental design. T.B. conceived the project and wrote the manuscript, with critical input from D.E and A.V.S.
Author Information Reprints and permissions information is available at www.nature.com/reprints.
The authors declare no competing financial interests.
References
- 1.Ydenberg RC, Dill LM. The economics of fleeing from predators. Adv Study Behav. 1986;16:229–249. [Google Scholar]
- 2.De Franceschi G, Vivattanasarn T, Saleem AB, Solomon SG. Vision guides selection of freeze or flight defense strategies in mice. Curr Biol. 2016;26:2150–2154. doi: 10.1016/j.cub.2016.06.006. [DOI] [PubMed] [Google Scholar]
- 3.Yilmaz M, Meister M. Rapid innate defensive responses of mice to looming visual stimuli. Curr Biol. 2013;23:2011–2015. doi: 10.1016/j.cub.2013.08.015. [DOI] [PMC free article] [PubMed] [Google Scholar]
- 4.Kunwar PS, et al. Ventromedial hypothalamic neurons control a defensive emotion state. Elife. 2015;4 doi: 10.7554/eLife.06633. [DOI] [PMC free article] [PubMed] [Google Scholar]
- 5.Shang C, et al. A parvalbumin-positive excitatory visual pathway to trigger fear responses in mice. Science. 2015;348:1472–1477. doi: 10.1126/science.aaa8694. [DOI] [PubMed] [Google Scholar]
- 6.Wang L, Chen IZ, Lin D. Collateral pathways from the ventromedial hypothalamus mediate defensive behaviors. Neuron. 2015;85:1344–1358. doi: 10.1016/j.neuron.2014.12.025. [DOI] [PMC free article] [PubMed] [Google Scholar]
- 7.Wei P, et al. Processing of visually evoked innate fear by a non-canonical thalamic pathway. Nat Commun. 2015;6 doi: 10.1038/ncomms7756. 6756. [DOI] [PMC free article] [PubMed] [Google Scholar]
- 8.Xiong XR, et al. Auditory cortex controls sound-driven innate defense behaviour through corticofugal projections to inferior colliculus. Nat Commun. 2015;6 doi: 10.1038/ncomms8224. 7224. [DOI] [PMC free article] [PubMed] [Google Scholar]
- 9.Vale R, Evans DA, Branco T. Rapid spatial learning controls instinctive defensive behavior in mice. Curr Biol. 2017;27:1342–1349. doi: 10.1016/j.cub.2017.03.031. [DOI] [PMC free article] [PubMed] [Google Scholar]
- 10.Gross CT, Canteras NS. The many paths to fear. Nat Rev Neurosci. 2012;13:651–658. doi: 10.1038/nrn3301. [DOI] [PubMed] [Google Scholar]
- 11.Blanchard RJ, Blanchard DC, Rodgers J, Weiss SM. The characterization and modelling of antipredator defensive behavior. Neurosci Biobehav Rev. 1990;14:463–472. doi: 10.1016/s0149-7634(05)80069-7. [DOI] [PubMed] [Google Scholar]
- 12.Gold J, Shadlen M. The neural basis of decision making. Annu Rev Neurosci. 2007;30:535–574. doi: 10.1146/annurev.neuro.29.051605.113038. [DOI] [PubMed] [Google Scholar]
- 13.Carandini M, Churchland AK. Probing perceptual decisions in rodents. Nat Neurosci. 2013;16:824–831. doi: 10.1038/nn.3410. [DOI] [PMC free article] [PubMed] [Google Scholar]
- 14.Dean P, Redgrave P, Westby GWM. Event or emergency? Two response systems in the mammalian superior colliculus. Trends Neurosci. 1989;12:137–147. doi: 10.1016/0166-2236(89)90052-0. [DOI] [PubMed] [Google Scholar]
- 15.Deng H, Xiao X, Wang Z. Periaqueductal gray neuronal activities underlie different aspects of defensive behaviors. J Neurosci. 2016;36:7580–7588. doi: 10.1523/JNEUROSCI.4425-15.2016. [DOI] [PMC free article] [PubMed] [Google Scholar]
- 16.Fotowat H, Gabbiani F. Collision detection as a model for sensory-motor integration. Annu Rev Neurosci. 2011;34:1–19. doi: 10.1146/annurev-neuro-061010-113632. [DOI] [PubMed] [Google Scholar]
- 17.Shea-Brown E, Gilzenrat MS, Cohen JD. Optimization of decision making in multilayer networks: the role of locus coeruleus. Neural Comput. 2008;20:2863–2894. doi: 10.1162/neco.2008.03-07-487. [DOI] [PubMed] [Google Scholar]
- 18.Silva BA, et al. Independent hypothalamic circuits for social and predator fear. Nat Neurosci. 2013;16:1731–1733. doi: 10.1038/nn.3573. [DOI] [PMC free article] [PubMed] [Google Scholar]
- 19.Tovote P, et al. Midbrain circuits for defensive behaviour. Nature. 2016;534:206–212. doi: 10.1038/nature17996. [DOI] [PubMed] [Google Scholar]
- 20.Wietek J, et al. An improved chloride-conducting channelrhodopsin for light-induced inhibition of neuronal activity in vivo. Sci Rep. 2015;5 doi: 10.1038/srep14807. 14807. [DOI] [PMC free article] [PubMed] [Google Scholar]
- 21.Pettit DL, Helms MC, Lee P, Augustine GJ, Hall WC. Local excitatory circuits in the intermediate gray layer of the superior colliculus. J Neurophysiol. 1999;81:1424–1427. doi: 10.1152/jn.1999.81.3.1424. [DOI] [PubMed] [Google Scholar]
- 22.Gale SD, Murphy GJ. Active dendritic properties and local inhibitory input enable selectivity for object motion in mouse superior colliculus neurons. J Neurosci. 2016;36:9111–9123. doi: 10.1523/JNEUROSCI.0645-16.2016. [DOI] [PMC free article] [PubMed] [Google Scholar]
- 23.Zhao X, Liu M, Cang J. Visual cortex modulates the magnitude but not the selectivity of looming-evoked responses in the superior colliculus of awake mice. Neuron. 2014;84:202–213. doi: 10.1016/j.neuron.2014.08.037. [DOI] [PMC free article] [PubMed] [Google Scholar]
- 24.Stachniak TJ, Ghosh A, Sternson SM. Chemogenetic synaptic silencing of neural circuits localizes a hypothalamus→midbrain pathway for feeding behavior. Neuron. 2014;82:797–808. doi: 10.1016/j.neuron.2014.04.008. [DOI] [PMC free article] [PubMed] [Google Scholar]
- 25.Schiller PH, Schiller HP. Comprehensive Physiology. John Wiley & Sons, Inc.; 2011. [Google Scholar]
- 26.Felsen G, Mainen ZF. Midbrain contributions to sensorimotor decision making. J Neurophysiol. 2012;108:135–147. doi: 10.1152/jn.01181.2011. [DOI] [PMC free article] [PubMed] [Google Scholar]
- 27.Cohen JD, Castro-Alamancos MA. Neural correlates of active avoidance behavior in superior colliculus. J Neurosci. 2010;30:8502–8511. doi: 10.1523/JNEUROSCI.1497-10.2010. [DOI] [PMC free article] [PubMed] [Google Scholar]
- 28.Horwitz GD, Batista AP, Newsome WT. Representation of an abstract perceptual decision in macaque superior colliculus. J Neurophysiol. 2004;91:2281–2296. doi: 10.1152/jn.00872.2003. [DOI] [PubMed] [Google Scholar]
- 29.Vong L, et al. Leptin action on GABAergic neurons prevents obesity and reduces inhibitory tone to POMC neurons. Neuron. 2011;71:142–154. doi: 10.1016/j.neuron.2011.05.028. [DOI] [PMC free article] [PubMed] [Google Scholar]
- 30.Vélez-Fort M, et al. The stimulus selectivity and connectivity of layer six principal cells reveals cortical microcircuits underlying visual processing. Neuron. 2014;83:1431–1443. doi: 10.1016/j.neuron.2014.08.001. [DOI] [PMC free article] [PubMed] [Google Scholar]
- 31.Vélez-Fort M, et al. A circuit for integration of head- and visual-motion signals in layer 6 of mouse primary visual cortex. Neuron. 2018;83:179–1191. doi: 10.1016/j.neuron.2018.02.023. [DOI] [PMC free article] [PubMed] [Google Scholar]
- 32.Tervo DGR, et al. A designer AAV variant permits efficient retrograde access to projection neurons. Neuron. 2016;92:372–382. doi: 10.1016/j.neuron.2016.09.021. [DOI] [PMC free article] [PubMed] [Google Scholar]
- 33.Mongeau R, Miller GA, Chiang E, Anderson DJ. Neural correlates of competing fear behaviors evoked by an innately aversive stimulus. J Neurosci. 2003;23:3855–3868. doi: 10.1523/JNEUROSCI.23-09-03855.2003. [DOI] [PMC free article] [PubMed] [Google Scholar]
- 34.Resulaj A, Kiani R, Wolpert DM, Shadlen MN. Changes of mind in decision-making. Nature. 2009;461:263–266. doi: 10.1038/nature08275. [DOI] [PMC free article] [PubMed] [Google Scholar]
- 35.Ghosh KK, et al. Miniaturized integration of a fluorescence microscope. Nat Methods. 2011;8:871–878. doi: 10.1038/nmeth.1694. [DOI] [PMC free article] [PubMed] [Google Scholar]
- 36.Guizar-Sicairos M, Thurman ST, Fienup JR. Efficient subpixel image registration algorithms. Opt Lett. 2008;33:156–158. doi: 10.1364/ol.33.000156. [DOI] [PubMed] [Google Scholar]
- 37.Aravanis AM, et al. An optical neural interface: in vivo control of rodent motor cortex with integrated fiberoptic and optogenetic technology. J Neural Eng. 2007;4:S143–156. doi: 10.1088/1741-2560/4/3/S02. [DOI] [PubMed] [Google Scholar]
- 38.Huber D, et al. Sparse optical microstimulation in barrel cortex drives learned behaviour in freely moving mice. Nature. 2008;451:61–64. doi: 10.1038/nature06445. [DOI] [PMC free article] [PubMed] [Google Scholar]
- 39.Isaacson JS, Walmsley B. Counting quanta: direct measurements of transmitter release at a central synapse. Neuron. 1995;15:875–884. doi: 10.1016/0896-6273(95)90178-7. [DOI] [PubMed] [Google Scholar]
- 40.Del Castillo J, Katz B. Quantal components of the end-plate potential. J Physiol. 1954;124:560–573. doi: 10.1113/jphysiol.1954.sp005129. [DOI] [PMC free article] [PubMed] [Google Scholar]
- 41.Jun JJ, et al. Fully integrated silicon probes for high-density recording of neural activity. Nature. 2017;551:232–236. doi: 10.1038/nature24636. [DOI] [PMC free article] [PubMed] [Google Scholar]
- 42.Jun JJ, et al. Real-time spike sorting platform for high-density extracellular probes with ground-truth validation and drift correction. bioRxiv. 2017 101030. [Google Scholar]
- 43.Wall NR, Wickersham IR, Cetin A, De La Parra M, Callaway EM. Monosynaptic circuit tracing in vivo through Cre-dependent targeting and complementation of modified rabies virus. Proc Natl Acad Sci. 2010;107:21848–21853. doi: 10.1073/pnas.1011756107. [DOI] [PMC free article] [PubMed] [Google Scholar]
- 44.Wickersham IR, et al. Monosynaptic restriction of transsynaptic tracing from single, genetically targeted neurons. Neuron. 2007;53:639–647. doi: 10.1016/j.neuron.2007.01.033. [DOI] [PMC free article] [PubMed] [Google Scholar]
- 45.Franklin TB, et al. Prefrontal cortical control of a brainstem social behavior circuit. Nat Neurosci. 2017;20:260–270. doi: 10.1038/nn.4470. [DOI] [PMC free article] [PubMed] [Google Scholar]
- 46.Paxinos G, Franklin K. The mouse brain in stereotaxic coordinates. 3rd Edition. Academic Press; 2008. [Google Scholar]
Associated Data
This section collects any data citations, data availability statements, or supplementary materials included in this article.


