. 2018 Oct 11;7:e37960. doi: 10.7554/eLife.37960

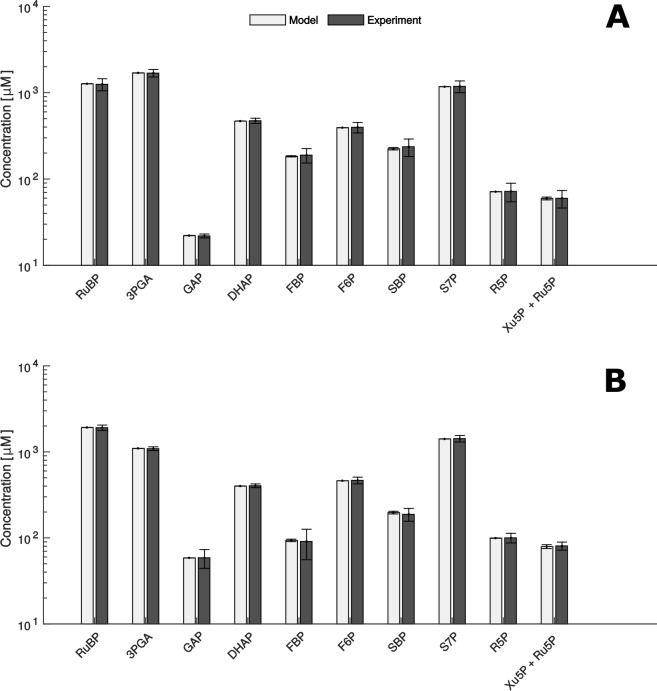
Figure 5. Comparison of metabolite data determined experimentally (Experiment) and by mathematical modelling (Model) under HC (A) and LC* (B) conditions.

(A + B) Modelled data is shown as white bars (n = 1,000 ± SD) and the SD-values are too small to be seen. Experimentally, metabolites were measured by HPLC-MS/MS as already shown in Figure 2 (n = 4 ± SD) (grey bars).

Figure 5.

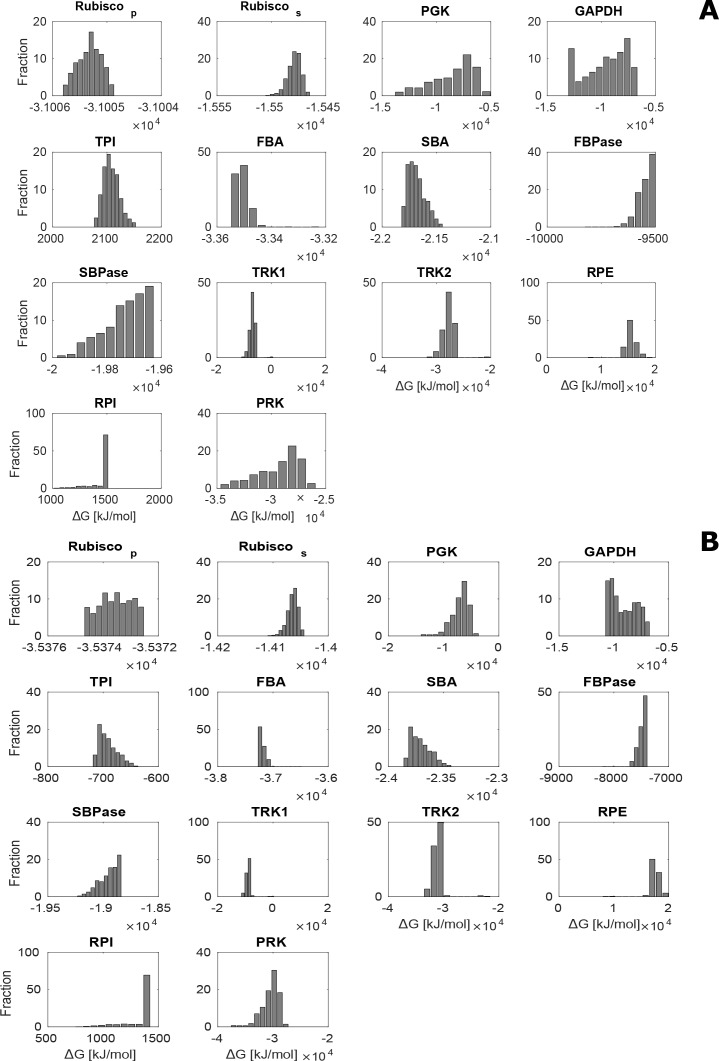
Figure 5—figure supplement 1. Distribution of estimated ΔG values for CBC metabolites over 1000 sampled steady-state flux distributions under no-CCM (HC; A) and CCM-induced (LC*; B) conditions.

Figure 5—figure supplement 1.

The estimated ΔG was negative for all enzymes except RPE and RPI for which ΔG>0. In addition, TRK was found to be the only enzyme operating in both directions.