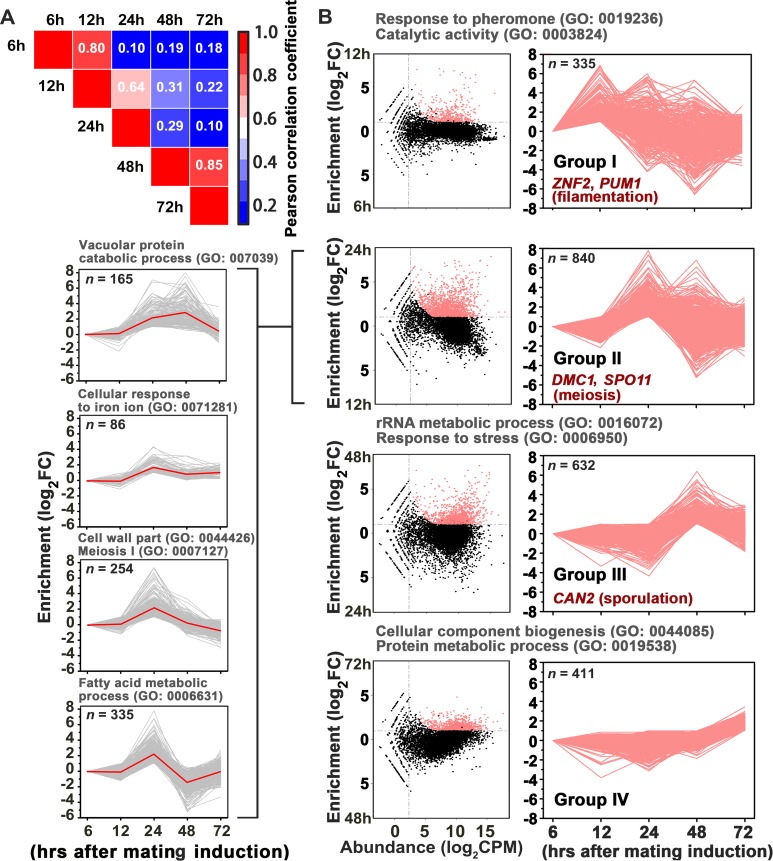
Figure 3. Gene network specifically orchestrating basidial maturation and meiosis during unisexual mating.
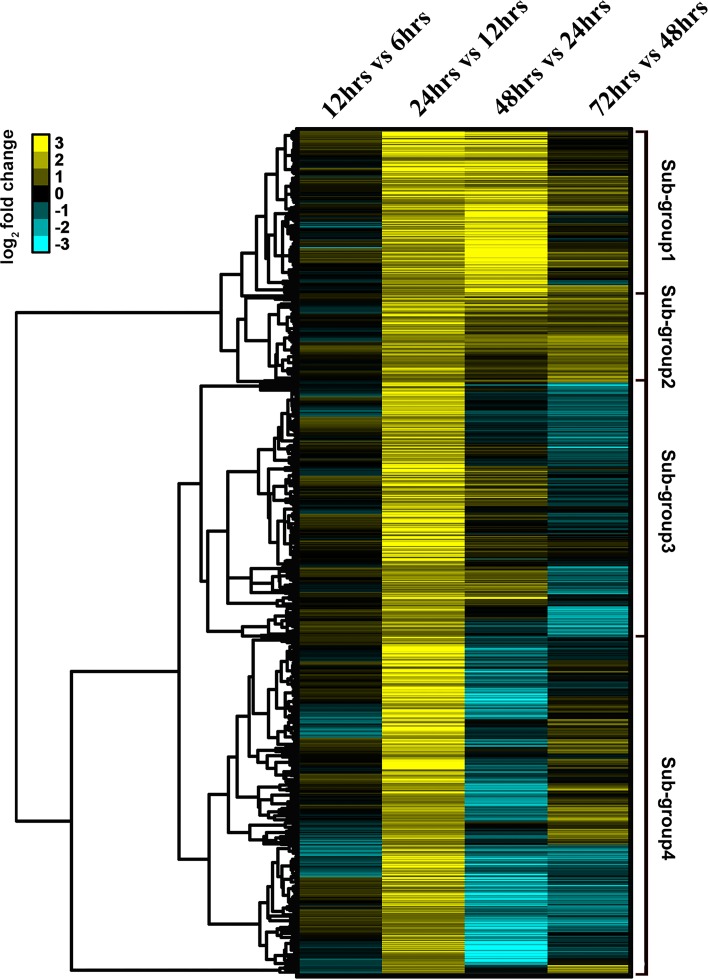
(A) Pairwise correlation of normalized TPM between RNA-seq samples obtained at five various time points after unisexual activation (6 hr, 12 hr, 24 hr, 48 hr and 72 hr). Pearson correlation coefficient was calculated using the R package ranges from no correlation (dark blue) to a perfect correlation (red). (B) Line plots show transcriptional induction profiles of genes in each pattern group. For each gene, the normalized expression levels at five time points throughout unisexual development are shown with a pink line (right). Pink dots indicate genes with significant induction during mating differentiation (CPM: count per million reads, FC: fold change). For each group, the representative genes, which play roles in various phases during sexual reproduction, are indicated (right). For each pattern from group II genes (left), the average expression levels at five time points across all genes with the pattern are shown with a red line. Tree cluster of group II genes was plotted using Cluster 3.0.


