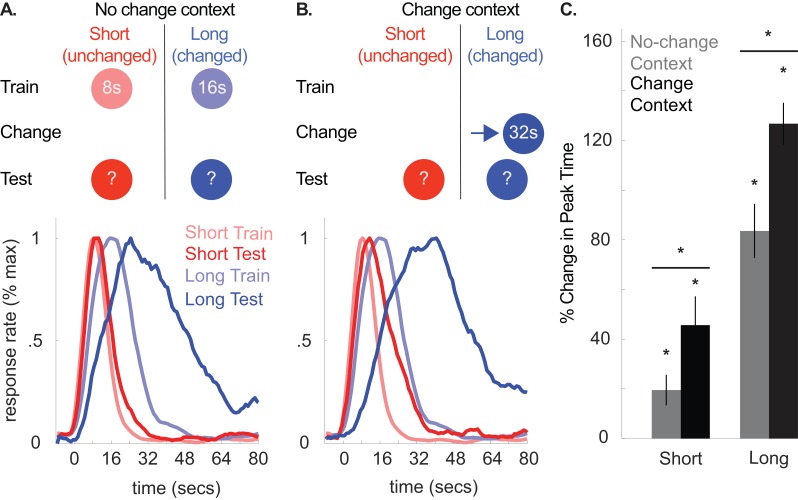
Figure 7. Top panels of (A) and (B) illustrate the design used in either context during Experiment 5 (n = 20).
Panels below each schematic show corresponding normalized response rates during training and during testing in either context. (C) shows percent change in peak time in either context during testing, relative to initial training (±SEM). Stars indicate significance.

