Abstract
Background:
MRI has been used to visualize radiofrequency (RF) ablation lesions but the relationship between volumes that enhance in acute MRI and the chronic lesion size is unknown.
Objectives:
The main goal was to use non-contrast (native) T1 weighted (T1w) MRI and late gadolinium enhancement (LGE) MRI to visualize lesions acutely and chronically and correlate the acute area of enhancement with chronic lesion size in histology.
Methods:
In a canine (n=9) model RF ablation lesions were created in both ventricles. Native T1w MRI and LGE-MRI were acquired acutely after the ablation procedure. After 8 weeks, another set of RF ablations was performed and the MRI study was repeated. Volume and depth of enhancement in native T1w MRI and LGEMRI acquired after the initial ablation procedure were correlated with chronic lesion volume and depth in histology.
Results:
33 lesions were analyzed. Native T1w MRI visualized the acute lesions but not the chronic lesions. LGE-MRI showed both acute and chronic lesions. Acute native T1w MRI volume (average of 102.1±48.5mm3) and depth (4.9±1.2 mm) correlated well with chronic histological volume (105.9±51.8mm3) and depth (4.8±1.3mm) with R2 of 0.881, p<0.001 and 0.874, p<0.001 respectively. Acute LGE MRI had significantly higher volume of enhancement of 499.7±214.4mm3 (p< 0.001) and depth of 7.5±1.8mm (p<0.001) compared to chronic histological lesion volume and depth.
Conclusion:
Native T1w MRI acquired acutely after RF ablation is a good predictor of chronic lesion size. Acute LGE-MRI significantly overestimates chronic lesion size.
Keywords: catheter ablation, non-contrast MRI, LGE MRI, lesion visualization, cardiac magnetic resonance image
Introduction
Radiofrequency (RF) ablation has become a standard approach to treat cardiac arrhythmias; however, it suffers from high recurrence, in part because of ineffective lesion creation. [1, 2] Lesions cannot be visualized using current fluoroscopy based ablation systems and hence it is not possible to discriminate areas that will result in permanent scar from areas that have undergone reversible changes due to edema. Edema appears quickly during RF ablation and can resolve within days of the procedure, allowing reconnection of areas that should remain electrically isolated. [3, 4] Isolation can arise temporarily despite the presence of gaps in ablation lesions because the gap areas have undergone reversible tissue changes from heating. [5] To identify such changes in tissue and evaluate lesion formation, late gadolinium enhancement MRI (LGE-MRI) has been used acutely and chronically after RF and cryo ablation procedures. However, it is difficult to rely on acute LGE-MRI to accurately predict the size of chronic lesions due to spatially and temporally nonuniform enhancement of ablated areas observed in acute LGE-MRI. [6, 7] [8]
A potential application of MRI is to guide ablation procedure in real time, which has the promise to provide acute feedback needed for successful lesion delivery. [9, 10] To be effective, acute MRI methods must also predict reliably the size of the resulting chronic lesions. [11] LGE-MRI can partially provide such information, but due to severe restrictions on contrast administration this contrast enhanced imaging technique has been used only at the end of the procedure. [12] More promising are MRI techniques that rely on intrinsic tissue contrast and are thus repeatable throughout a procedure. Heating of myocardium by RF energy changes its intrinsic T1 and T2 relaxation times. Native (intrinsic) T1 and T2 tissue contrasts have been used to acutely image RF ablation lesions. [6, 13, 14] It has been demonstrated that T2-weighted (T2w) MRI mainly visualizes edema, which is a poor predictor of chronic lesion formation and chronic lesion dimensions. [15] Accuracy of native T1-weighted (T1w) MRI in predicting chronic lesions is unknown. [12, 13] Here we study the capability of native T1w MRI to visualize acute RF ablations and evaluate its ability to predict chronic lesion size once the acute edema is resolved and the scar formation is complete. We also looked at the chronicity of changes in the native T1w enhancement by acquiring T1w MRI acutely, 1 and 8 weeks’ post-ablation.
Methods
For this study, we used a canine model (n=9). The study conformed to the Guide for the Care and Use of Laboratory Animals and was approved by the Institutional Animal Care and Use Committee (IACUC). The animals were sedated using Propofol and then intubated with deep sedation maintained using Isoflurane (1–3%) throughout the study including the ablation procedures and the MRI study. Right and left femoral vein access was obtained percutaneously. An 8.5Fr (St. Jude Medical, USA) sheath was placed in the right femoral vein and an 11 Fr sheath was placed in the left femoral vein. An intra-cardiac echocardiogram (ICE) catheter (Siemens, USA) was advanced to the right atrium to visualize the inter-atrial septum. Under fluoroscopy and ICE guidance a transseptal puncture was performed and the 8.5 Fr sheath was advanced to the left atrium. Through the left atrial sheath an irrigated force sensing catheter (Thermocool, SmartTouch, Biosense Webster, USA) was advanced to the left ventricle. After creating fast anatomical map (FAM) of the chamber, discrete ablations were performed in the left ventricle under power control mode using 25 to 40 W of power for 30 seconds with a contact force of 10 to 40 grams. The locations of ablation lesions were also marked on the FAM for later comparison with imaging. The catheter was then pulled out of the left ventricle and advanced into the right ventricle and one or two similar ablations were performed in the right ventricle. After removing the catheters and pulling the sheaths away from the heart, the animal was moved to the 3 Tesla MRI scanner (Verio, Siemens Healthcare, Erlangen, Germany) to carry out the MRI study as detailed below.
MR imaging was initiated within an hour of completing the ablation procedure. After the initial MRI study, each animal was recovered and a week later underwent a repeat MRI study to access native T1w enhancement. Two months post initial ablation the animals underwent a repeat ablation procedure, in which acute RF lesions were created in the ventricles following the same procedure as described above. The initial FAM and the location of the lesions in the prior MRIs were used to guide the repeat ablation procedure to prevent creating overlapping lesions. The initial set of ablation lesions are referred to as chronic lesions and the latter as acute. After a final MRI session immediately post repeat ablation, animals were euthanized under anesthesia. The heart was explanted for gross pathological and histological assessment.
Imaging Protocol
MR imaging was performed on 3 Tesla clinical MR scanners (Verio and Trio, Siemens Healthcare, Erlangen, Germany) acutely after the initial ablation (Acute MRI), a week later and then again after the second ablation procedure 8 weeks later (Chronic MRI). Each imaging study included native T1w and T2w MRI scans followed by contrast administration, and LGE MRI scan.
Native T1w MRI:
T1w images of whole heart were acquired using 3D respiratory navigated, ECG triggered, saturation recovery prepared GRE pulse sequence. Typical scan parameters were repetition time (TR)=3.1 ms, echo time (TE)=1.4 ms, flip angle of 10 degrees, spatial resolution=1.25×1.25×2.5 mm, and inversion time (TI)= 350–400 ms. Saturation pulse was applied every heart beat and fat suppression was applied immediately before data acquisition. The data acquisition was limited to 15% of cardiac cycle and was performed every heart beat during mid-diastolic phase of cardiac cycle.
Native T2w MRI:
T2w images of whole heart were acquired using respiratory navigated, ECG triggered, double inversion prepared 2D turbo/fast spin echo pulse sequence with TR=3 cardiac cycles, TE=81 ms, echo train length=21, SPAIR fat suppression, in-plane resolution of 1.25×1.25 mm, and contiguous 2D slices without gap with slice thickness of 4 mm.
LGE-MRI:
Contrast (0.15 mmol/kg of Gd-BOPTA, Multihance, Bracco Diagnostic Inc., Princeton, NJ, USA) was injected and 3D LGE-MRI of whole heart was acquired approximately 30 minutes after the injection. 3D LGE was acquired using respiratory navigated, ECG triggered, inversion recovery prepared 3D GRE pulse sequence with TR/TE = 3.1/1.4 ms, flip angle = 14 degrees, spatial resolution = 1.25×1.25×2.5 mm, and TI = 270–350 ms. Fat saturation was performed immediately before data acquisition that was limited to 15% of cardiac cycle and was performed every heart beat during mid-diastolic phase of cardiac cycle.
Data Analysis
MRI:
Seg3D (Scientific and Computing Institute, University of Utah) software was used to calculate lesion volume from native T1w and LGE MRI. Acute T2w MRI was not quantitatively analyzed because enhanced regions of neighboring lesions in T2w MRI overlapped in many cases. The 1 and 8 weeks’ post ablation T1w MRI was not also analyzed quantitatively as there was no clearly observed enhancement in these scans.
The area of T1w enhancement for each lesion was manually segmented for each slice covering the lesion. Slice enhancement volume was calculated as a product of the slice enhancement area and the slice thickness. Total enhancement volume for the lesion was calculated by summing up slice enhancement volumes for all the slices covering the lesion. Similarly, the volume of enhancement was calculated for LGEMRI acquired both acutely and chronically (the 2-month terminal MRI scan). Volume of micro-vasculature obstruction (MVO) observed in LGE-MRI of acute lesions was included in enhancement volume for the corresponding acute lesions. Measurement of lesion depth in native T1w and LGE MRI was performed by measuring the maximum lesion extent perpendicular to the endocardial surface after reviewing all the slices covering the lesion.
Histological assessment:
After the heart was fixed in formaldehyde, it was cut in 2 to 3 mm thick slices and the acute and the chronic lesions were captured in high-resolution scaled images of both sides of all the slices. The images were imported in Photoshop (Adobe Inc.) and quantitative analysis of the chronic lesions was performed. The surface area of the lesions on each side of the slice was estimated using the free hand lasso tool. To calculate the volume of the lesion per slice the average surface area between the two surfaces was multiplied by the slice thickness. For the slices that had lesions visible only on one side of the slice, the depth of the lesion in that slice was determined by cutting through the slice. The volume of the lesion for this end slice was calculated assuming a conical shape of the lesion using the area and the depth in that slice. To calculate the total histological volume of any lesion we added the volume per slice for all the slices covering the lesion. The slices were also cut perpendicular to the surface to determine the depth of each lesion.
Statistical Analysis:
A linear regression model was used to calculate the correlation between the native T1w MRI and LGE-MRI volume and depth with the pathological lesion volume and depth. Paired t-test was used to test the difference between acute and chronic LGE-MRI volumes.
Results
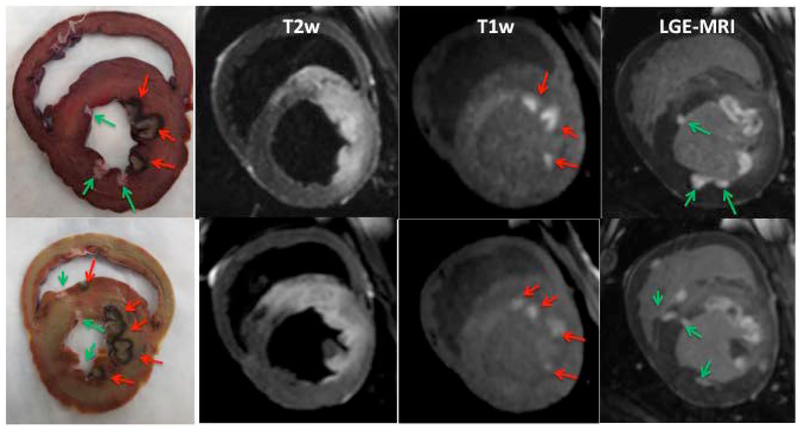
We have successfully implemented a native T1w MRI technique for acute visualization of cardiac RF ablation lesions. The technique was validated in 9 animals. Figure 1 shows correlation of the gross pathological samples from two animals with the native T1w and T2w images as well as LGE-MRI acquired after the second ablation. The native T1w and T2w image demonstrate enhancement only in the area of acute lesions and not for the chronic lesions. The acute lesions are visualized as discrete hyper-intense regions in T1w image. The individual acute lesions cannot be discriminated in T2w image because edema extends far beyond the ablation regions. The LGE images show both the acute and the chronic lesions with the acute lesions having a MVO (non-enhanced) area in the center of the lesions.
Figure 1:
Comparison between pathology samples from 2 animals and the corresponding T2w, T1w and LGE images acquired after the repeat ablation procedure. The pathology clearly demonstrates acute and chronic RF lesions. Red arrows indicate acute lesions and green arrows mark the chronic lesions. Acute lesions consist of lesion core and surrounding hemorrhage ring. Enhancement in native T1w and T2w images is only observed in the area of acute lesions. T2w enhancement extends far beyond the ablation regions. In T1w images, the acute lesions are visualized as discrete hyper-intense regions with shape and size similar to lesion cores observed in the pathology. The LGE-MRI shows a much larger area of enhancement for acute lesions as compared to chronic lesions.
We quantitatively evaluated 33 lesions detected by acute and chronic LGE MRI and histology. From these 33 lesions, 29 lesions were clearly visualized by native T1w MRI. Four small lesions that did not have obvious enhancement in acute T1w MRI were excluded from analysis. Table 1 presents the mean lesion volume and depth from MRI and histology data. These lesion characteristics were similar for histology and acute T1w MRI: volume - 105.9±51.8 mm3 vs. 102.1±48.5 mm3 with p = 0.267; depth - 4.8±1.3 mm vs. 4.9±1.2 mm with p= 0.313. However, the mean histological volume and depth were significantly different (p < 0.0001) than these lesion characteristics from acute LGE MRI.
Table 1.
Lesion volume and depth from pathology and MRI studies.
| Pathology (n=29) | Native T1w MRI (n=29) | Pathology (n=33) | Acute LGE MRI (n=33) | Chronic LGE MRI (n=33) | |
|---|---|---|---|---|---|
| Volume, mm3 | 105.9±51.8 | 102.1±48.5 | 99.1±52.1 | 499.7±214.4* | 143.33±83.5* |
| Depth, mm | 4.8±1.3 | 4.9±1.2 | 4.6±1.3 | 7.5±1.8* | 4.5±1.4 |
T1w – T1-weighted, LGE - late gadolinium enhancement,
- statistically different than the corresponding measurements from pathology
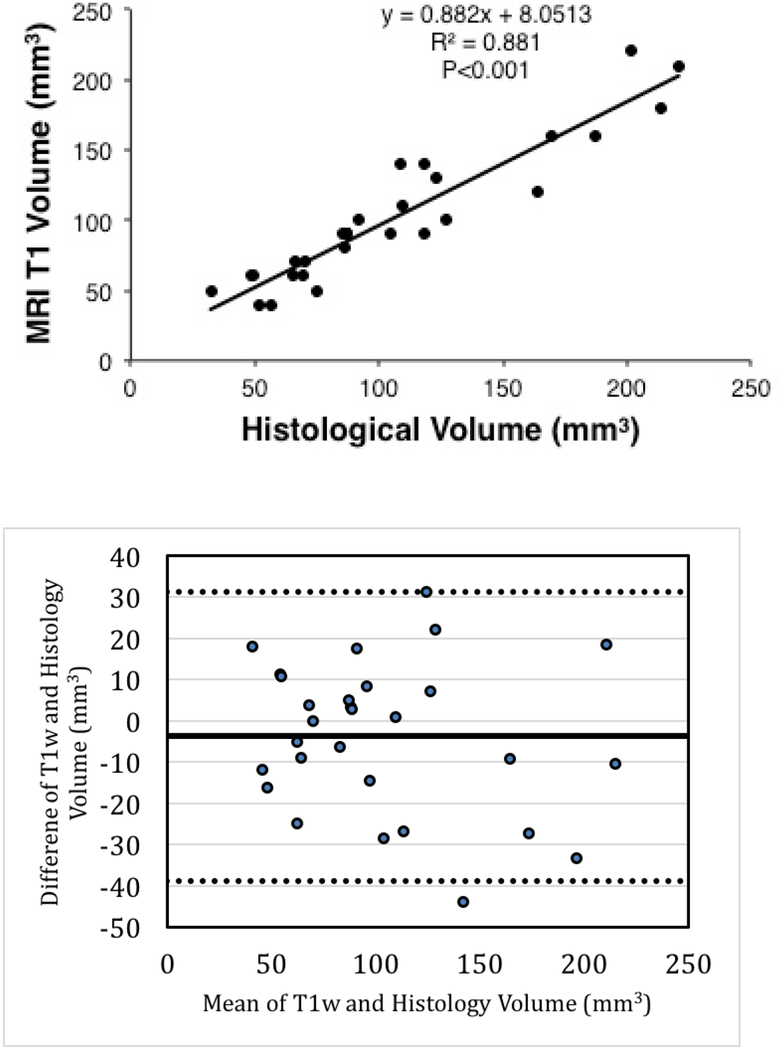
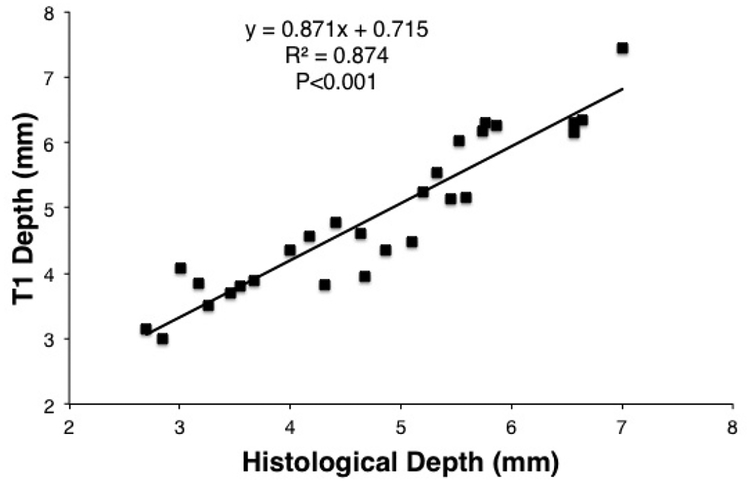
The acute native T1w images accurately predicted the chronic lesion volumes with a slope of 0.88 (Figure 2) and a correlation coefficient of 0.939, p<0.001. The depth measurement for these lesions in acute T1w MRI was also highly correlated (R=0.935, p<0.001) with chronic histological lesion depth (Figure 3).
Figure 2:
The top panel - Correlation of enhancement volume in acute T1w MRI with histological lesion volume. The bottom panel - Bland-Altman plot for T1w enhancement and histological volumes.
Figure 3:
Correlation of lesion depth in acute native T1w MRI with histological lesion depth.
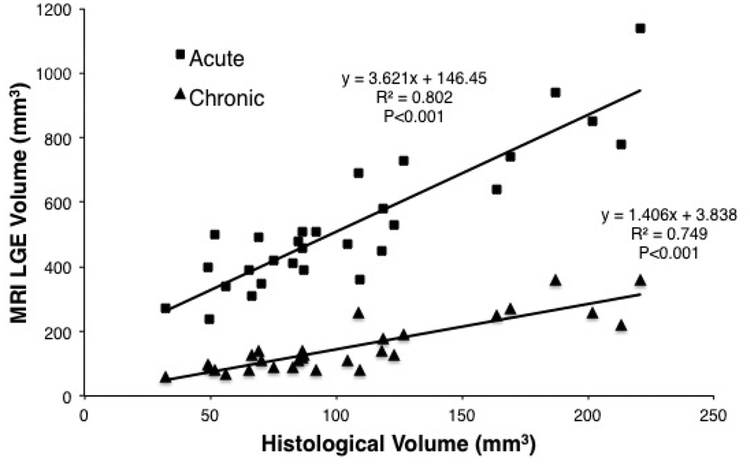
The acute LGE-MRI overestimated the chronic lesion histological volume by a factor of 3.6 (Figure 4). The chronic lesion LGE-MRI agreed better with the chronic lesion histological volume with a slope of 1.4 (Figure 4). The acute LGE-MRI scans were acquired 31:31±7:50 mins after contrast injection and the enhanced area volume was 499.7±214.4 mm3 and depth was 7.5±1.8 mm. For the chronic lesion LGE-MRI scans the mean delay after contrast injection was 31:41±5:19 mins. The mean volume of enhancement was 143.33±83.5 mm3 and depth of 4.5±1.4 mm. The difference in volume and depth between acute and chronic lesion volumes in LGE-MRI was statistically significant (p<0.001).
Figure 4:
Correlation of enhancement volume in acute and chronic LGE-MRI with histological lesion volume. The acute LGE-MRI drastically over estimates the lesion volume with a factor of 3.6. Chronic LGE-MRI is a better predictor of lesion volume with a factor of 1.4.
There were four small lesions that did not have obvious enhancement in acute T1w MRI. The mean histological volume and depth for these lesions were 49.46±13.05 mm3 and 3.45±0.79 mm, respectively. These lesions were significantly smaller than the lesions detected by acute T1w MRI (p < 0.0001).
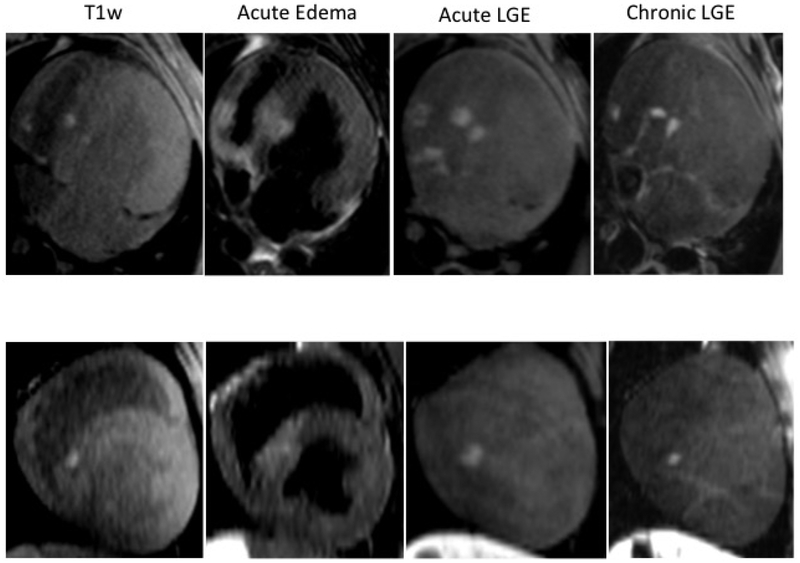
The comparison between the acute native T1w, T2w and LGE-MRI images acquired immediately after lesion placement and chronic LGE-MRI images acquired 8 weeks after ablation is shown in Figure 5. The area of acute edema (enhancement in T2w) is much larger than the area of enhancement in native T1w or acute and chronic LGEMRI. Severe discrepancy in enhancement areas between acute T2w MRI and chronic LGE-MRI indicates that T2w MRI cannot be used to predict chronic lesion dimensions. The area of enhancement in the chronic LGE-MRI is noticeably smaller than that in the acute LGE-MRI. The native T1w MRI showed pronounced enhancement only acutely after the ablation procedure and acute T1w enhancement correlate well with enhancement in the chronic LGE-MRI.
Figure 5.
Representative examples of RF lesion visualization by acute T1w, T2w, LGE-MRI and chronic LGE-MRI. Enhancement regions in the acute T1w are similar to the corresponding enhancement regions in the chronic LGE-MRI. Acute T2w imaging shows much larger areas of enhancement as does the acute LGE-MRI as compared to the acute T1w or the chronic LGE-MRI.
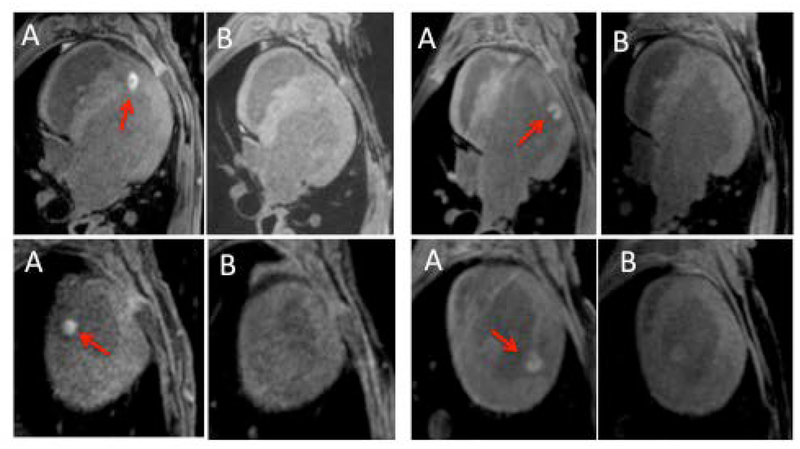
To study how visibility of RF lesions in native T1w MRI changes with the time after ablation, we compared T1w images acquire acutely and 1 week after the ablation procedure. We found that lesion visibility in native T1w MRI is drastically reduced just a week after the lesion delivery (Figure 6).
Figure 6.
Native T1w MRI acquired (A) acutely and (B) 1 week after ablation procedure in 4 animals. No obvious enhancement was observed in the T1w scans acquired a week after the ablation.
Discussion
In this study we have demonstrated that a native T1w MRI acquired acutely after cardiac RF ablation can be used to accurately predicts chronic lesion size. The accuracy of T1w imaging technique in predicting chronic lesions is significantly better than the traditional LGE-MRI that is routinely used to visualize acute and chronic ablation lesions.
The traditional LGE-MRI has numerous limitations that lowers the accuracy of acute scans in predicting chronic lesion size. The spatial and time varying wash-in and wash-out kinetics of gadolinium-based contrast in ablated regions results in LGEMRI images having a central area of necrosis, also referred to as the MVO region, that can take up to an hour or longer to fully enhance. [7, 8, 16] In addition to the MVO region, the edema region surrounding the lesion core enhances earlier right after contrast administration and continues to have higher image intensity than normal myocardium up to 10 minutes after contrast injection. [8] Hence the delay between contrast administration and image acquisition can severely affect the area that enhances in acute LGE-MRI. Our results demonstrate that LGE images acquired about 30 minutes after injection overestimated the chronic lesion size by almost a factor of four. More recently, it was shown that the MVO region in acute LGE-MRI acquired at 26.1 minutes after contrast administration is a good predictor of chronic ventricular lesions. [8] The acute T1w MRI with intrinsic contrast enhancement of ablated regions does not have that time dependency. Additionally, the traditional LGE-MRI visualizes both acute and chronic RF lesions. Whereas, the native T1w imaging technique only visualizes acute lesions. This feature of T1w technique is important for imaging patients after repeat ablation procedure when information about acute lesions is required.
Using intrinsic T1w contrast to visualize RF lesions has been reported before but it has been restricted to looking at acute tissue changes as it was done in an acute model. [13] More recently, native T1w imaging has been reported up to three weeks out, but none of the studies have reported relationship between volumes that enhance in acute T1w MRI and the chronic lesion from histology. [14] Using an acute model has inherent limitations of not being able to separate reversible edematous changes with non-reversible tissue injury.
It has been proposed that this native T1w enhancement is due to heating related transformation of hemoglobin iron into ferric iron in the lesion core. [13] Ferric iron behaves similarly to gadolinium-based MRI contrast by shorting T1 relaxation time of the lesion core. MVO severely slows down wash-out the ferric iron from the lesion core resulting in enhancement of ablated regions in native T1w MRI acquired acutely after RF ablation. As shown in Figure 6, enhancement was drastically reduced in T1w images acquired a week after ablation. This could be due to either wash-out of the ferric iron from the lesion core or transformation of the ferric iron into hemosiderin. Our results indicate that reduction of T1 relaxation time of RF ablated myocardium has transient nature and T1w enhancement mainly resolves over a span of few days. This is still too short a time interval for complete remodeling of this area and replacement with collagen indicating that this process is completed early in the remodeling process. A recent study has reported seeing T1w enhancement up to 3 weeks. [14] That work was done in a swine model and it is possible that in that model it takes longer for the acute changes including local free iron to be washed out or scavenged by inflammatory cells. [14] Even in that study the authors recognize that when injured tissue is replaced by scar there should be no-enhancement on native T1w images and postulate that the remodeling might take longer in that model. It is also possible that the area of the necrotic core in that lesion was much larger due to higher power and force used for ablation and hence took longer for some of the acute changes to resolve.
Now that we have shown that native T1w MRI predicts chronic lesions size this technique may prove to be useful for real time MRI electrophysiology (EP) ablation systems. There has been a systematic development of such systems guided by the need to visualize ablation related tissue changes in real time. [12, 17] There are numerous other advantages to a real time MRI system in addition to seeing tissue changes in real time like validating tip-tissue contact, being able to determine the exact location of lesion formation, be able to do substrate assessment and the obvious one being the lack of ionizing radiation. All the real time systems that have been reported so far have used the traditional LGE or T2w MRI to identify ablation related tissue changes. When using such a real time MRI system the ability to use LGE-MRI is limited to assess acute changes to only a few passes as contrast can be only administrated a few times during the ablation procedure, whereas with the native T1wimaging there is no such a limitation. Moreover, acute T2w MRI, in our experience results in area of enhancement that is quite large as shown in Figure 1 and easily overlaps neighboring lesions.
Four small lesions detected by histology and LGE-MRI were not clearly observed in native T1w MRI. This limitation was caused by lower contrast between ablated myocardium and blood pool in the used T1w technique than that in LGE-MRI. Further optimization of scan parameters for native T1w technique is required to improve sensitivity of the T1w technique for detection of small RF lesions.
Acknowledgments
This work was supported in part by a Biosense Webster research grant to University of Utah, with Ravi Ranjan as the PI. Ravi Ranjan is also supported by NIH grant K23HL115084. Seg3D software development was supported by the National Institute of General Medical Sciences of the NIH grant P41 GM103545–18.
Nassir Marrouche reports ownership interest in Marrek, Inc. and Cardiac Designs; research grants from Biosense Webster, Medtronic, St Jude Medical, Boston Scientific; consultant to Biotronik, Preventice.
Ravi Ranjan reports research grants from St. Jude Medical, Medtronic, Boston Scientific and Biosense Webster; consultant to St. Jude Medical and Medtronic.
Abbreviations list:
- AF
atrial fibrillation
- FAM
fast anatomical map
- GRE
gradient recalled echo
- ICE
intra-cardiac echocardiogram
- LGE MRI
late gadolinium enhancement magnetic resonance imaging
- MVO
micro-vasculature obstruction
- RF
radiofrequency
- SPAIR
spectral attenuated inversion recovery
- T1w
T1 weighted
- T2w
T2 weighted
- TE
echo time
- TI
inversion time
- TR
repetition time
Footnotes
Publisher's Disclaimer: This article has been accepted for publication and undergone full peer review but has not been through the copyediting, typesetting, pagination and proofreading process, which may lead to differences between this version and the Version of Record. Please cite this article as doi: 10.1111/jce.13709.
Eugene Kholmovski reports equity interest in Marrek Inc; consultant to Marrek Inc.
Other authors: No disclosures.
References
- 1.Parmar BR, Jarrett TR, Burgon NS, Kholmovski EG, Akoum NW, Hu N, Macleod RS, Marrouche NF, Ranjan R. Comparison of left atrial area marked ablated in electroanatomical maps with scar in MRI. J Cardiovasc Electrophysiol, 2014. 25(5): p. 457–63. [DOI] [PMC free article] [PubMed] [Google Scholar]
- 2.Parmar BR, Jarrett TR, Kholmovski EG, Hu N, Parker D, MacLeod RS, Marrouche NF, Ranjan R. Poor scar formation after ablation is associated with atrial fibrillation recurrence. Journal of interventional cardiac electrophysiology: an international journal of arrhythmias and pacing, 2015. 44(3): p. 247–256. [DOI] [PMC free article] [PubMed] [Google Scholar]
- 3.Ouyang F, Antz M, Ernst S, Hachiya H, Mavrakis H, Deger FT, Schaumann A, Chun J, Falk P, Hennig D, Liu X, Bänsch D, Kuck KH. Recovered pulmonary vein conduction as a dominant factor for recurrent atrial tachyarrhythmias after complete circular isolation of the pulmonary veins: lessons from double Lasso technique. Circulation, 2005. 111(2): p. 127–135. [DOI] [PubMed] [Google Scholar]
- 4.Cheema A, Dong J, Dalal D, Marine JE, Henrikson CA, Spragg D, Cheng A, Nazarian S, Bilchick KC, Almasry I, Sinha S, Scherr D, Halperin H, Berger R, Calkins H Incidence and time course of early recovery of pulmonary vein conduction after catheter ablation of atrial fibrillation. J Cardiovasc Electrophysiol, 2007. 18(4): p. 387–391. [DOI] [PubMed] [Google Scholar]
- 5.Ranjan R, Kato R, Zviman MM, Dickfeld TM, Roguin A, Berger RD, Tomaselli GF, Halperin HR. Gaps in the Ablation Line as a Potential Cause of Recovery from Electrical Isolation and their Visualization using MRI. Circ Arrhythm Electrophysiol, 2011. 4: p. 279–286. [DOI] [PMC free article] [PubMed] [Google Scholar]
- 6.Dickfeld T, Kato R, Zviman M, Nazarian S, Dong J, Ashikaga H, Lardo AC, Berger RD, Calkins H, Halperin H. Characterization of acute and subacute radiofrequency ablation lesions with nonenhanced magnetic resonance imaging. Heart Rhythm, 2007. 4(2): p. 208–214. [DOI] [PMC free article] [PubMed] [Google Scholar]
- 7.Dickfeld T, Kato R, Zviman M, Lai S, Meininger G, Lardo AC, Roguin A, Blumke D, Berger R, Calkins H, Halperin H. Characterization of radiofrequency ablation lesions with gadolinium-enhanced cardiovascular magnetic resonance imaging. J Am Coll Cardiol, 2006. 47(2): p. 370–378. [DOI] [PMC free article] [PubMed] [Google Scholar]
- 8.Ghafoori E, Kholmovski EG, Thomas S, Silvernagel J, Angel N, Hu N, Dosdall DJ, MacLeod R, Ranjan R. Characterization of Gadolinium Contrast Enhancement of Radiofrequency Ablation Lesions in Predicting Edema and Chronic Lesion Size. Circ Arrhythm Electrophysiol, 2017. 10(11). [DOI] [PMC free article] [PubMed] [Google Scholar]
- 9.Bhagirath P, van der Graaf M, Karim R, Rhode K, Piorkowski C, Razavi R, Schwitter J, Götte M. Interventional cardiac magnetic resonance imaging in electrophysiology: advances toward clinical translation. Circ Arrhythm Electrophysiol, 2015. 8(1): p. 203–11. [DOI] [PubMed] [Google Scholar]
- 10.Kholmovski EG, Coulombe N, Silvernagel J, Angel N, Parker D, Macleod R, Marrouche N, Ranjan R. Real-Time MRI-Guided Cardiac Cryo-Ablation: A Feasibility Study. J Cardiovasc Electrophysiol, 2016. 27(5): p. 602–8. [DOI] [PMC free article] [PubMed] [Google Scholar]
- 11.Vergara GR, Vijayakumar S, Kholmovski EG, Blauer JJ, Guttman MA, Gloschat C, Payne G, Vij K, Akoum NW, Daccarett M, McGann CJ, Macleod RS, Marrouche NF. Real-time magnetic resonance imaging-guided radiofrequency atrial ablation and visualization of lesion formation at 3 Tesla. Heart Rhythm, 2011. 8(2): p. 295–303. [DOI] [PMC free article] [PubMed] [Google Scholar]
- 12.Ranjan R, Kholmovski EG, Blauer J, Vijayakumar S, Volland NA, Salama ME, Parker DL, MacLeod R, Marrouche NF. Identification and acute targeting of gaps in atrial ablation lesion sets using a real-time magnetic resonance imaging system. Circ Arrhythm Electrophysiol, 2012. 5(6): p.1130–5. [DOI] [PMC free article] [PubMed] [Google Scholar]
- 13.Celik H, Ramanan V, Barry J, Ghate S, Leber V, Oduneye S, Gu Y, Jamali M, Ghugre N, Stainsby JA, Shurrab M, Crystal E, Wright GA. Intrinsic contrast for characterization of acute radiofrequency ablation lesions. Circ Arrhythm Electrophysiol, 2014. 7(4): p. 718–27. [DOI] [PubMed] [Google Scholar]
- 14.Guttman MA, Tao S, Fink S, Kolandaivelu A, Halperin HR, Herzka DA. Non-contrast-enhanced T1 -weighted MRI of myocardial radiofrequency ablation lesions. Magn Reson Med, 2017. [DOI] [PMC free article] [PubMed] [Google Scholar]
- 15.Knowles BR, Caulfield D, Cooklin M, Rinaldi CA, Gill J, Bostock J, Razavi R, Schaeffter T, Rhode KS. 3-D visualization of acute RF ablation lesions using MRI for the simultaneous determination of the patterns of necrosis and edema. IEEE Trans Biomed Eng, 2010. 57(6): p. 1467–75. [DOI] [PubMed] [Google Scholar]
- 16.McGann C, Kholmovski E, Blauer J, Vijayakumar S, Haslam T, Cates J, DiBella E, Burgon N, Wilson B, Alexander A, Prastawa M, Daccarett M, Vergara G, Akoum N, Parker D, MacLeod R, Marrouche N Dark regions of no-reflow on late gadolinium enhancement magnetic resonance imaging result in scar formation after atrial fibrillation ablation. J Am Coll Cardiol, 2011. 58(2): p. 177–185. [DOI] [PMC free article] [PubMed] [Google Scholar]
- 17.Nazarian S, Kolandaivelu A, Zviman MM, Meininger GR, Kato R, Susil RC, Roguin A, Dickfeld TL, Ashikaga H, Calkins H, Berger RD, Bluemke DA, Lardo AC, Halperin HR. Feasibility of real-time magnetic resonance imaging for catheter guidance in electrophysiology studies. Circulation, 2008. 118(3): p. 223–9. [DOI] [PMC free article] [PubMed] [Google Scholar]


