Abstract
Magnetic Resonance Elastography (MRE) detects induced periodic motions in biological tissues allowing maps of tissue mechanical properties to be derived. In-vivo MRE is commonly performed at frequencies of 30–100 Hz using external actuation, however, using cerebro-vascular pulsation at 1 Hz as a form of intrinsic actuation (IA-MRE) eliminates the need for external motion sources and simplifies data acquisition. In this study a hydraulic actuation system was developed to drive 1 Hz motions in gelatin as a tool for investigating the performance limits of IA-MRE image reconstruction under controlled conditions. Quantitative flow (QFLOW) MR techniques were used to phase encode 1 Hz motions as a function of gradient direction using 3D or 4D acquisition; 4D acquisition was twice as fast and yielded comparable motion field and concomitant image reconstruction results provided the motion signal was sufficiently strong. Per voxel motion noise floor corresponded to a displacement amplitude of about 20–30 microns. Signal to noise ratio (SNR) was 94 ± 17 for 3D and dropped to 69 ± 10 for the faster 4D acquisition, but yielded octahedral shear stress and shear modulus maps of high quality that differed by only about 20 % on average. QFLOW measurements in gel phantoms were improved significantly by adding Mn(II) to mimic relaxation rates found in brain. Overall, the hydraulic 1 Hz actuation system when coupled with 4D sequence acquisition produced a fast reliable approach for future IA-MRE phantom evaluation and contrast detail studies needed to benchmark imaging performance.
Keywords: elastography, 1 Hz imaging, stiffness maps, shear modulus
Graphical Abstract
1. Introduction
Many disease processes involve changes to the cellular microstructure, which often lead to alterations in the macroscale mechanical properties of tissue.[1] One example is breast cancer, which is commonly identified as a hard lump through manual palpation. The field of Elastography produces quantitative and spatially 5 resolved images of tissue mechanical properties, with potential applications in diagnosis and monitoring of disease. Ultrasound[2], MRI[3] and optical coherence tomography[4] have been used successfully to produce elastographic images. In general, a mechanical stimulus is applied to the tissue and the motion response is measured. Mechanical properties are then deduced from the measured motion data by fitting a relevant mechanical model.
Quasi-static ultrasound elastography applies compression and measures the resulting strain field to indicate soft (high strain) and hard (low strain) tissues.[5] Dynamic approaches have also been developed, where the shear wave propagation speed is measured and used to compute the local shear modulus. Magnetic resonance elastography (MRE) has typically required an external actuator to produce harmonic motion in the 30–100 Hz range, which is imaged with phase contrast sequences. MRE has been applied successfully to a variety of tissues including liver,[6] breast,[7, 8] heart,[9] pancreas[10] and brain.[11, 12] Several reviews are available on elastography imaging in general[13] and MRE imaging in particular[14], and provide detailed introductions to the subject.
The feasibility of intrinsic actuation MRE (IA-MRE) has been demonstrated in brain, during which intrinsic pulsations of tissue due to pressure variations over the cardiac cycle were measured with a retrospectively gated phase contrast sequence.[15] The resulting displacements were reconstructed with a poroelastic model of brain tissue to recover maps of the poroelastic shear modulus, [16] and hydraulic conductivity.[17] Repeatability of the global average shear modulus of 3–12% was reported in healthy subjects, and gray matter was found to be softer than white matter consistently with the majority of conventional MRE studies. However, the spatial accuracy of IA-MRE images was difficult to determine because independent mechanical property measurements in living tissue are challenging to obtain and have their own uncertainties. A controlled phantom system is a common approach to verify spatial accuracy of imaging systems, since phantoms can be constructed with known geometry and property contrast. In this study, a hydraulically driven 1 Hz IA-MRE actuation system is described for gelatin phantoms containing stiff inclusions. Gel motions were measured using clinical angiography flow sequences that utilize bipolar gradients oriented along different directions to quantify velocity.[18] For 3D sequences, velocities in each direction were measured sequentially while for 4D sequences velocities in all three directions were encoded simultaneously. Using multiple gradient directions to encode MRE data faster and more accurately is an active area of current research.[19] The 4D method used here is quite similar to those used for retrospectively gated 4D-flow cardiac imaging.[20, 18, 21] Motion maps were converted into spatially accurate images of the shear modulus as another demonstration of the quality of the measured motion fields. The actuation system reported here appears to be the first published approach for conducting low frequency (∼1 Hz) MRE phantom studies in a controlled environment, and comparisons of the concomitant 3D and 4D sequences provide new recommendations for IA-MRE acquisitions.
2. Experimental Methods
2.1. Actuation
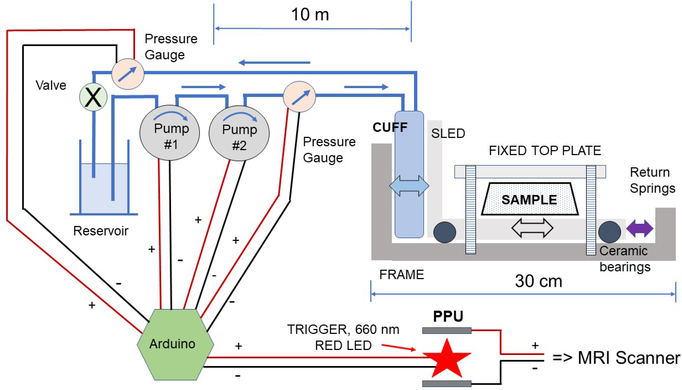
Figure 1 shows a block diagram of the low frequency (∼1 Hz) actuation system. Component parts resident within the bore of the magnet were chosen to be non-metallic. The basic design consisted of a movable sled constructed using 7/8” acrylic stock for machining the actuation frame, 4 nylon rods for machining plastic bearing bushings, nylon screws, 4 ceramic roller blade racing bearings (VXB, 608 full ceramic ZrO2/PTFE skate bearings), 5 resin composite non-metallic springs (1.3 N/mm, Lee Spring, color code violet) and a 45 blood pressure cuff (child size 9) that acted as a hydraulically inflatable bladder. The non-magnetic sled was connected to the fluid pumping system located outside the scanner room through a waveguide using 60 feet of 1/4” inner diameter mesh reinforced Tygon tubing to provide inflow and outflow piping. The working fluid was water with 10 mM added Mn(II) to suppress stray MR signal. Conventional parts were used to construct the driving manifold and included two 5 PSI automotive analog pressure gauges (5V), two small centrifugal pumps (Bayite, solar hot water, 12V DC, 3 m head, 2.1 gpm), 4” PVC pipe with end caps and PVC cement to make the reservoir, an Arduino UNO controller, Arduino motor shield, and a pressure driven LED output signal. The MRI scanner was triggered using a short (30 ms) light pulse, from a red LED (Adafruit, λmax = 660 nm) located inside the PPU (peripheral pulse unit or pulse oximeter). Effective triggering required an opaque plastic shroud around the LED, careful positioning of the LED relative to the 55 PPU detector, and an RF filter to prevent zipper artifacts.
Figure 1:
Schematic of the actuator design based on a mobile horizontal sled with a stationary top plate.
2.2. Arduino Control
An Arduino Uno with a motor shield, independent power supply, and laptop interface was used to drive the actuator. The LED output was set to Pin 10, and additional resistance (330 Ω) was added externally, thereby leaving the pins needed for the motor shield available. The motor shield input power pin from the Arduino was terminated in order to connect the motor shield to an external power supply. Timings were set by an internal call to the system clock so that the control loop could be executed in 1–2 ms, independently of the state of the LED output. Shift registers were added to record the A/D output from the pressure gauges over the last 15 cycles, and included internal averaging for each measurement. A least squares algorithm calculated the best fit slope within the current shift register. The slopes determined whether fluid pressure was rising, falling or staying steady. If rising, the Arduino triggered the 660 nm LED (30 ms on) which in turn triggered the PPU and the MR scanner. In order to avoid multiple triggering, an estimate of the frequency focused the algorithm on the next instance when rising edge detection was needed. The Arduino also drove both small centrifugal pumps simultaneously with a 500 ms on/500 ms off duty cycle independently of pressure detection and calculation of a rising edge trigger. The median value of the pressure shift register(s) and the current state of the trigger signal drove the Arduino Serial Plotter as a heads up display.
2.3. Phantom Construction and Properties
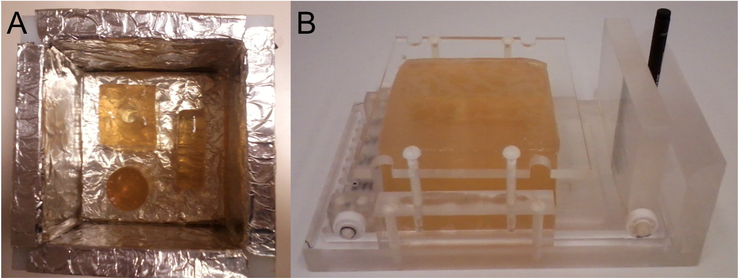
Knox gelatin was weighed into plastic tubs (240 mL), along with an aqueous solution of 50–100 uM Mn(II)Cl2.4H2O to match relaxation rates in biological tissues more closely, and to reduce residual mag-netization artifacts. Tubs were stirred and heated in a 1.4 kW microwave oven using 30–45 second heating bursts, until a final temperature of 70–75◦C was obtained. Tubs were cooled on the benchtop to 28–32◦C if dilute, and 38–42◦C if concentrated, prior to pouring. Temperatures greater than 30◦C tended to redissolve gelatin inclusions already set, so higher concentrations were poured first, set in the refrigerator (minimum of 1 hr), and then lower concentrations were added later as shown in Figure 2A.
Figure 2:
Gelatin phantom preparation and actuation. (A) Stiff inclusions were prepared first, then embedded in a soft matrix. A thin bottom layer of preset gelatin of intermediate stiffness was present beneath the inclusions. (B) Actuator loaded with a phantom. The black spacer acts as a scale marker and holds the plastic springs compressed prior to inserting a hydraulically driven blood pressure cuff.
Construction of large phantoms used foil-lined plastic molds allowing the gelatin to be removed from the mold easily. For smaller inclusions, copper or brass pipe sections were used, and the gel was released by heating the mold briefly with warm tap water. Adding stiff or intermediate top and bottom layers to the phantoms dramatically improved lifetime under mechanical stress, and simplified handling considerably. Each phantom was used once in a 4–7 hour experiment that resulted in the acquisition of multiple data sets. Figure 2B shows a completed phantom loaded into the actuator, prior to an MRE data acquisition experiment. The actuation system when loaded with a phantom was placed inside the head coil with it’s long axis aligned in the FH direction (i.e., parallel with the B0 field, see Fig 3, far right). Figure 3 provides schematics of the gelatin phantoms used in this paper. Typical phantoms had overall dimensions of ∼ 120 × 120 × 80 mm3. Furthermore, the actuator-driven velocity of the gel (∼ 2 mm/s) is much less than the shear velocity (1–3 m/s).
Figure 3:
Phantoms were constructed from the wt% gelatin concentrations shown with varying amounts of Mn(II) added to yield physiological relaxation rates. Slice directions, slice locations, and the patient centered LPH coordinate system are indicated. The axial orientation shows the stiffer layers used to improve phantom strength. Typical uncompressed phantom dimensions were ∼ 120×120×80 mm3
2.4. MRE Data Acquisition
MRE data acquisition employed the Philips QFLOW (quantitative flow) sequence on a 3T Philips Achieva scanner using a 32 channel head coil. The base sequence was FFE (Fast Field Echo), a coherent gradient echo. The flip angle was small, 15 degrees, to support short TR/TE settings. For 3D acquisition TR/TE was 14/12 ms, for 4D acquisition TR/TE was 18/16 ms. Retrospective gating[21] with PPU triggering encoded 16 cardiac phases with the lowest possible value of the phase contrast (PC) encoding factor (venc) of 1 cm/s in these phantoms to reject/alias fast fluid motions and focus on slower (∼1 Hz) movements. Large cubic voxels (3×3×3 mm3) were used to boost signal to noise. Small matrix sizes (e.g. 64 × 44) were used to decrease acquisition time. A typical coronal FOV (Field of View) was 192×132×72 mm3. Reference images were acquired using identical FOV, voxel sizes, acquisition matrix, center coordinates, and foldover direction with standard T2 or T1 weighted sequences, e.g., T2W-TSE (T2 Weighted-Turbo Spin Echo). Both 3D and 4D IA-MRE acquisitions were performed: 3D acquisition used single echo, quantitative flow, flow compensation, with PC velocity encode directions acquired one at a time, e.g., RL (right-left), then FH (head-foot), then AP (anterior-posterior) to yield 3 data sets with common coordinates. These data were reconstructed in real time on the scanner using default parameters. 4D acquisition used single echo, flow compensation, and RF spoiling of the residual magnetization: 4D data were processed on the scanner using delayed reconstruction to extract individual gradient directions from the composite data set. Motion data were exported in PARREC format, and parsed into Matlab for further processing.
2.5. Motion Data Experiments
Push Waveform(s)/Displacements.
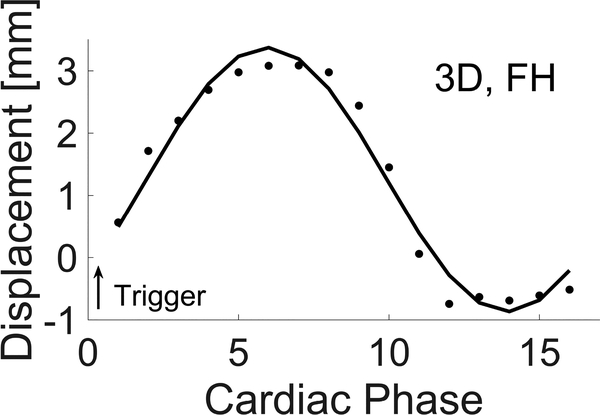
The system shown in Figure 1 incorporated rigid copper pipe in the upstream section, so that driving the pumps with a square wave duty cycle (500 ms on, 500 ms off) yielded a square wave response at the upstream pressure gauge used to pulse the LED which triggered the PPU. The maximum upstream pressure, achieved with the two small pumps in series was ∼ 6 psi. After passing 115 through 10 m of compliant tubing, the compliant blood pressure cuff, and another 10 m of compliant tubing to the open escape valve, the pressure profile was rounded substantially (see Fig 4) and rendered a fair approximation to a sinusoid. The maximum downstream pressure near the exit valve was < 0.25 psi. This amount of fluid pressure was sufficient to generate motions in the 1–2 mm range at the driving plate of the phantom system as measured primarily by MRE, but also confirmed qualitatively using a standard CINE sequence to estimate locations of the moving edge(s).
Figure 4:
Single sinusoid fit (solid line) to raw 3D QFlow displacement data averaged over a small ROI in image slice 23 (of 24, see Fig 3, middle graphic) near the moving push plate. The motion encode direction is FH, i.e. along the push plate motion direction. The fit is derived from the fourier coefficients. Trigger position is also shown relative to the 16 cardiac phases (data intervals) that were acquired.
Motion Components.
The phantom system enabled detailed analyses of factors contributing to signal, noise and bias in IA-MRE data. The IA-MRE sequence collected 16 equispaced ‘snapshots’ of the periodic motion field through retrospective gating. Fourier transformation of the velocity data across the phase offsets produced voxel-by-voxel maps of the complex-valued motion amplitude at each frequency. In an ideal linear system, 1 Hz input yields a 1 Hz response. In practice, the driving and response waveforms were not perfectly sinusoidal. Accordingly, non-primary driving frequency motion components were investigated.
No Motion Experiment.
The soft inclusion in Phantom 1 (see Fig. 3) was found to be mobile, and thus, a good probe of gradient induced motions. Phantom 1 was measured without external push, using 3D and 4D acquisitions. Measurements were then repeated with a 70 kg weight on the table and head coil to attenuate gradient induced motions (GIMs).
Mn(II) Experiments.
Phantom 1 was investigated with and without added Mn(II) to probe effects of remnant magnetization in light of the short cycle times for both 3D and 4D acquisition.
Signal to Noise Ratio (SNR) Experiments.
Variations in signal strength and intensity with respect to spatial location (x,y,z) and total elapsed acquisition time (t) were investigated with both 3D and 4D acquisition.
We used raw magnitude data to assess overall SNR behavior of the 3D and 4D sequences from a single acquisition. An array of small (3×3 voxel) ROIs was constructed near the (x,y) center of the phantom within the central 15 slices (z). The total number of ROI’s was (7×3×15 = 315). The SNR at each individual ROI was calculated using mean/standard deviation for the 9 voxels, then the 315 ROIs were averaged to yield an average SNR. A similar approach was used to assess the variance in motion amplitudes derived from QFlow velocity data. Three regions of interest (ROIs) were chosen that spanned small in-plane areas within a fixed slice. These ROIs were located within homogeneous regions of a single coronal cross-section near the bottom push plate where induced motions were largest, and in-plane motions were expected to have low spatial variation. The push plate moved in the FH direction. After Fourier transformation of the velocity data to yield motion amplitudes, mean motion amplitudes ± standard deviations were calculated for the three ROI locations and three gradient encoding directions (see section 3.1.3 on 1st Order Motions).
2.6. Gradient Directions
QFLOW applies bipolar gradients[18] to encode motion dependent phase differences. Those gradients have specific directions which need to be preserved during data export and subsequent model-based image reconstruction. A directional flow phantom, not shown here, was constructed for confirming gradient direc-tions. Calculations used coordinate axes x = FH, y = RL and z = AP for coronal acquisitions, with the detailed signs along each direction determined by the flow phantom results.
2.7. Strains and Strain Images
Measured MRE velocities were integrated in the Fourier domain and filtered to recover the 1 Hz displacement components in the response signal. Strains were derived from the measured motions using partial derivatives along the various combinations of gradient directions (3 in all) relative to image directions (3 in all) for a total of 9 partial derivatives. Individual derivatives were combined according to the Cauchy infinitesimal strain matrix to yield a total of six unique strains: ϵxx,ϵyy,ϵzz,ϵxy,ϵxz,ϵyz. Maps of octahedral shear strain (OSS) [22], s, which is the maximum shear strain in any plane for a 3D state of strain and defined by
| (1) |
were calculated as another measure of motion data quality, especially as it relates to MRE image reconstruction [22].
2.8. MRE Image Reconstruction
Mechanical properties were recovered from the measured displacements using a nonlinear inversion (NLI) algorithm as an additional demonstration of the quality of the motion data acquired with the low frequency actuation system.[23, 24] NLI iteratively updates a discretized description of the property distribution in a heterogeneous finite element model by minimizing differences between model displacements and motion measurements. In this study, viscoelastic governing equations were used as the model representation of the Figure 3 gelatin phantoms and are defined by
| (2) |
Here, u is the displacement field, μ is the shear modulus, ν is the poisson ratio, ρ is the density, ω is the frequency, and T is the transpose operator. At low frequencies (∼1 Hz), the right-hand-side of equation 2 becomes sufficiently small that the shear modulus can only be determined relative to a non-unique scalar multiplier. A useful workaround is to set the lower bound of shear modulus to the approximate value of the softest material in the phantom (usually the background) thereby normalizing the relative shear modulus appropriately. Here, the lower bound of the shear modulus was set to 200 Pa.
3. Results
3.1. Motion Characteristics
3.1.1. Frequency Components
Measured velocities were converted into displacements by integrating the data in the Fourier transform domain. Figure 4 shows the trigger positioning and an overlay of a pure 1 Hz sinusoid on the raw MRE displacement data in the push plate motion direction (FH) measured in a small image ROI near the plate, itself. Cardiac phase, see Figure 4, refers to the number of data intervals collected across each cardiac (or pump) cycle. Multiple pump cycles are used to construct a single data set. Table 1 reports normalized fourier coefficients for these data.
Table 1:
Fourier coefficients describing motions for a small ROI in slice 23 of 24, near the push plate
| Fourier Coefficients | |||
|---|---|---|---|
| Motion Order | Real | Imaginary | Abs Val |
| 0th (DC) | 1.2537 | 0 | 1.2537 |
| 1st (1 Hz) | −0.3802 | −0.9894 | 1.0599 |
| 2nd (2 Hz) | 0.0981 | 0.0019 | 0.0981 |
| 3rd (3 Hz) | −0.1067 | −0.0767 | 0.1315 |
| 4th (4 Hz) | 0.0382 | −0.0715 | 0.0811 |
3.1.2. Zeroth Order Motions
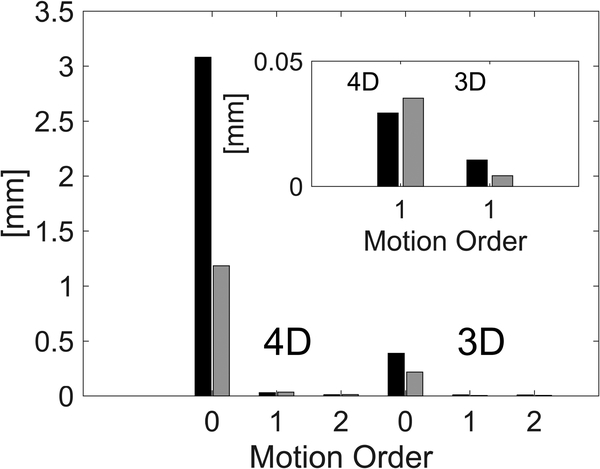
Zeroth order motion components in the Fourier transformed IA-MRE signal were inconsistent with periodic phantom actuation, and in this case, resulted primarily from Gradient Induced Motions (GIMs). Figure 5 shows results from a bias experiment using Phantom 1 with no external actuation. Stabilizing the table and head coil with a 70 kg weight reduced the zeroth order components significantly (see Figure 5, main plot) 190 confirming their source as primarily from GIMs. GIM bleed-through into 1st and 2nd order components (Figure 5, plot inset) was larger for 4D acquisition. Overall, GIM effects appeared largely in the zeroth order motion component and are acceptably small in 1st and 2nd order harmonic motions. This result also provides an estimate of the first order motion noise floor as being in the 10–30 μm range. GIMs have been recognized and used previously as a driving source for MRE experiments.[25]
Figure 5:
RMS signal intensities for 3D versus 4D acquisition of Phantom 1 with no external actuation. Inset shows magnification of the 1st order residuals which are small. KEY: Black, sample is unrestrained. Gray, table and head coil are weighted.
3.1.3. First Order Motions
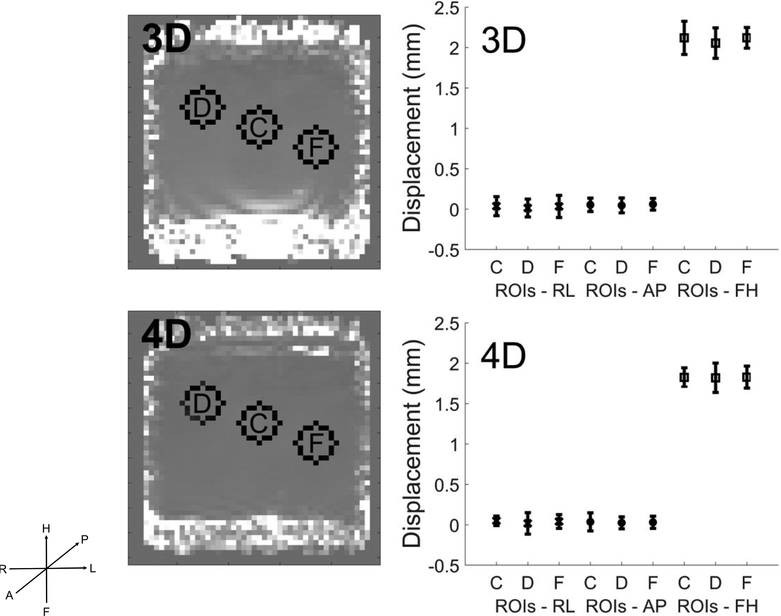
Hydraulic actuation was implemented as a square wave at the pumps, which was then filtered by passing through compliant tubing and a compliant blood pressure cuff, so deviations from single-frequency sinusoid motion are expected. Second and higher order components arising from push imperfections represented ∼7 % of the total motion within the middle slices. Figure 7 shows first order motion signal in each of three 200 directions averaged spatially over ROIs within a single coronal cross-section (slice 23/24) near the bottom actuation plate. Much larger signal intensities occurred along the push direction, FH, as expected, and similar noise levels were found in each of the 3 directions.
Figure 7:
ROI regions (C, D, F) for Phantom 2 in a coronal slice (23 of 24, see Fig 3, middle graphic) near the bottom actuation plate (left) and spatially averaged means and standard deviations of 1st order motion signals (right) for 3D and 4D acquisitions. FH is the actuation and dominant motion direction as expected. Comparisons here were made at ∼ constant acquisition time, which is one complete IA-MRE sequence for 3D (3083 sec), and two complete sequences for 4D (2732 sec).
Little flexibility exists in selecting TR and TE for either the 3D or 4D sequences; therefore, very little optimization of SNR through changes in TR and TE was possible. The 3D acquisition is actually a slice selective sequence whereas its 4D counterpart is a volume selective sequence so the relaxation effects are quite different and the trade-off between the number of spins contributing to the signal and relaxation losses was not explored for either sequence. We did change the flip angle to optimize SNR. The raw magnitude image based SNR for the 3D sequence was 94 ± 17. SNR of the 4D sequence when exploiting its faster acquisition dropped to 69 ± 10.
3.2. Strains
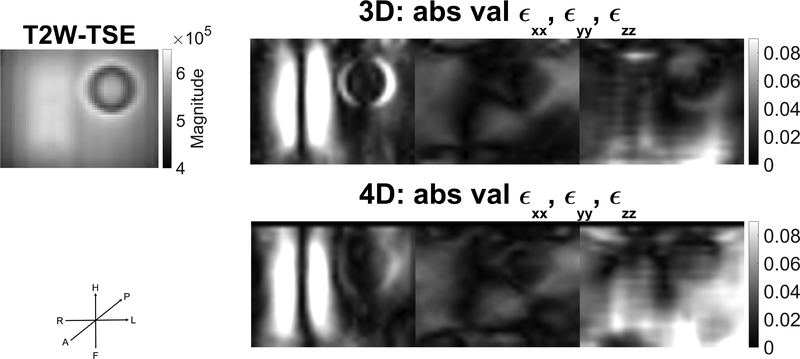
Despite the push originating primarily along one direction (FH in the patient coordinate scheme), both 3D and 4D acquisitions yield appreciable ϵxx,ϵyy,ϵzz, strain components as illustrated in Figure 8, indicating that displacements occur in all three directions and are captured, accordingly, in each case.
Figure 8:
Comparison of ϵxx,ϵyy,ϵzz strain components between 3D and 4D acquisition for slice 16 of 24 (see Fig 3, middle graphic). Push is primarily along a single direction, FH, in the LPH coordinate system. Although strains are greatest for the xx component, appreciable strains are also present in the yy and zz components. A T2W-TSE image of the same slice is shown for comparison. See section 2.6 for a short discussion of x,y,z coordinates relative to LPH coordinates.
3.3. OSS Maps
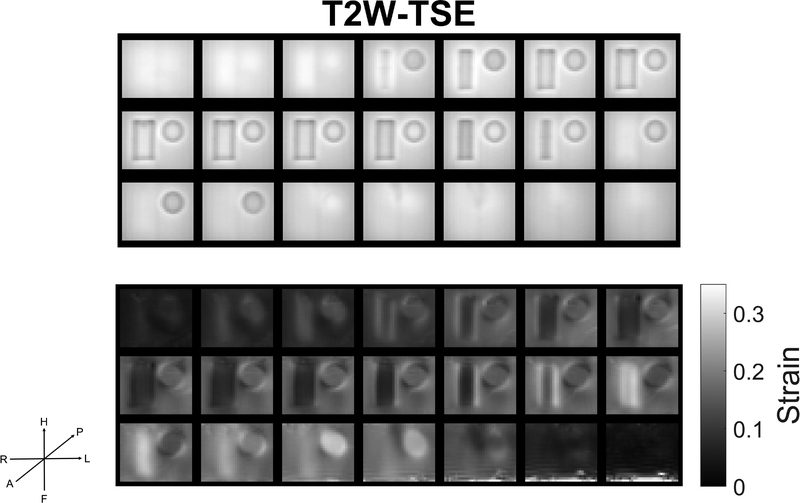
Figure 9 shows an OSS map for Phantom 2. A T2W-TSE image acquisition is included as a reference to identify locations of the inclusions. As expected, the stiff inclusions result in lower strains relative to the soft background material. Areas of high strain around the inclusions are the expected stress concentrations at interfaces of stiff inclusions embedded in a soft background. The 3D and 4D sequences gave similar but not identical OSS maps. Average RMSA % voxel-by-voxel differences between 3D and 4D OSS maps were 220 19.0 % in the middle 15 slices which are more remote to top/bottom edge effects and 29.8 % in the six slices near the top and bottom (i.e. near the shear and fixed plates) where sequence related artifacts were more prominent.
Figure 9:
Top: T2W-TSE image of Phantom 2. Bottom: Calculated OSS (Octahedral Shear Strain) map for Phantom 2 with 3D acquisition. Inclusions are generally more evident in the OSS maps than in the raw motion maps. High strain areas surrounding the inclusions correspond to expected stress concentrations. Actuation rate is 60 bpm (1 Hz). Number of Scan Averages (NSA) =3. Total acquisition time is 9248 secs
3.4. Shear Modulus Reconstructions
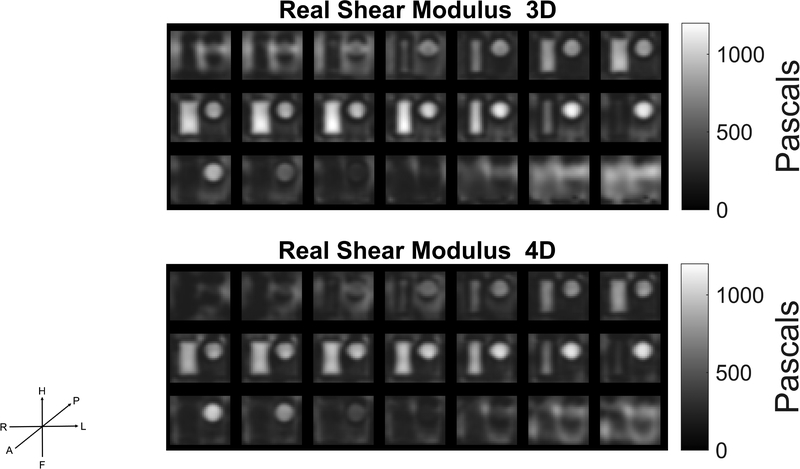
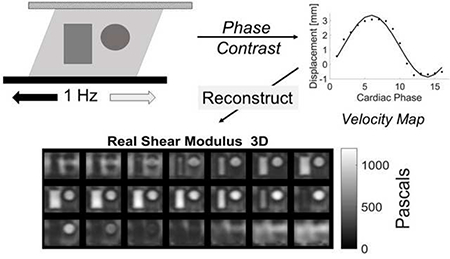
Figure 10 presents shear modulus maps recovered with viscoelastic NLI from 3D and 4D data acquired in Phantom 2 actuated at 1Hz. Both 3D and 4D sequences showed a rapid dropoff in shear modulus starting at about 1 cm from the edges of the phantom due to motion noise from air susceptibility effects. Figure 10 employs a mask prior to reconstruction to reject phantom edges from the calculation. Very similar results to those found by OSS were evident in shear modulus reconstruction. The 3D and 4D derived real shear modulus reconstructions had average RMS % voxel-by-voxel differences of 19.9 % in the middle 15 slices where sequence related differences are less evident and by 36.3% in the six slices near the top and bottom where the two sequences (i.e. 3D and 4D) process image-related artifacts differently.
Figure 10:
Real shear modulus maps for Phantom 2 (see fig 5) actuated at 1 Hz using 3D or 4D acquisition. Image is based solely on stiffness, not relaxation. Top: 3D acquisition Bottom: 4D Acquisition. Voxel size 3 mm × 3mm × 3mm, total slices = 24 (21 shown), NSA = 1, 3D acquire time = 3083 secs, 4D acquire time = 1366 secs.
4. Discussion
This work presents a low frequency (∼1 Hz) actuation system and corresponding acquisition sequences sufficient for performing controlled phantom studies at intrinsic actuation frequencies (∼1 Hz). Accordingly, stable periodic motions were recorded over long time periods with the computer controlled hydraulic pumping system which enabled retrospective gating to measure time dependent motion amplitudes at each voxel location. The MR scanner was triggered successfully at the PPU using an LED pulse whenever the rising edge of fluid pressure was detected in the hydraulic system.
Both 3D and 4D imaging sequences were employed successfully to give comparable shear modulus images, see Figure 10. 4D has a clear advantage in terms of imaging time (∼2.25× faster than 3D), which makes it the preferred choice for in vivo imaging, when fast sequences are desirable, although 4D requires a heavier gradient duty cycle and generates more acoustic noise than sequential 3D acquisition. The 3D imaging sequence produced an average raw magnitude image derived SNR of 94 ± 17, while the 4D sequence yielded a magnitude derived SNR of 69 ± 10.
Experiments with no motion revealed a constant motion component caused by gradient effects; however, the impact on the fundamental frequency of interest was small, on the order of 30μm, and can safely be ignored in practice. QFLOW required short TR/short TE acquisition which can lead to imperfect spoiling. Mn(II) doping of phantom materials mitigated artifacts resulting from remnant magnetization and incomplete RF spoiling (by adding 50–100 uM Mn(II) in gel phantoms to yield relaxation rates similar to those found in brain).
Both 3D and 4D acquisitions were vulnerable to susceptibility artifacts particularly at the air/phantom interface which necessitated the use of larger phantoms to exclude these artifacts from the fields of view of embedded inclusions. Figure 7 suggests greater sensitivity to susceptibility artifacts for 3D acquisition, as evidenced by the brighter wave-like artifacts near the bottom of the images in the 3D relative to the 4D motion data. Susceptibility artifacts were avoided by masking out the edges and excluding slices near the top and bottom plastic plates to generate shear modulus reconstructions.
Both 3D and 4D acquisition produced repeatable motion measurements, with comparable accuracy for small and large motions, as illustrated in Figure 7. At 1 Hz in hydraulically actuated gelatin phantoms, differential motion on the order of 1–2 mm between the top and bottom surfaces yielded sufficient strain for recovery of accurate mechanical property images, as evidenced by the corresponding OSS maps, Figure 9.
Gelatin is a relatively simple material with which to fabricate complex phantoms and amenable to the Mn(II) doping required to control relaxation time. However, the mechanical stiffness of gelatin is a strong function of not only the gelatin concentration, but also of factors that are more difficult to control experimentally including cooling rate, aging, phantom temperature and stress history.[26, 27, 28]
5. Conclusions
We have demonstrated effective 1 Hz MRE imaging in gelatin phantoms using hydraulic actuation and standard QFLOW motion encoding. Maximum motion magnitudes in the range of 1–2 mm achieved effective 1 Hz MRE, and larger phantoms served to minimize susceptibility artifacts. Although mechanical properties are independent of T1 and T2 relaxation rates, spoiling for the phase contrast sequence degraded relatively 270quickly outside the physiologic range of T1 and T2 values. The motion noise floor was approximately 20–30 μm. Gel phantoms provided a controllable set of mechanical properties for evaluating image reconstruction performance at 1 Hz in future studies.
Figure 6:
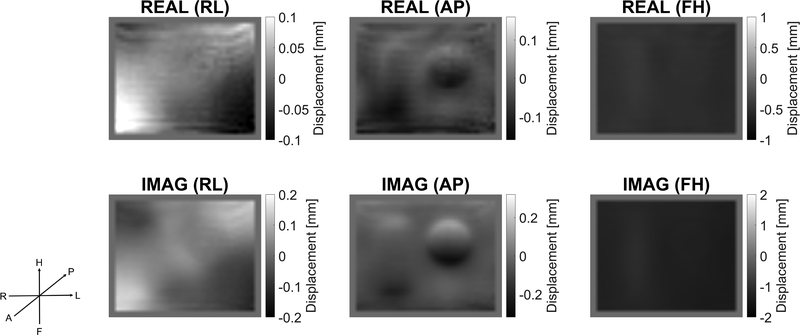
Displacement data after Fourier filtering to yield the 1 Hz response signal. Displacement directions are shown in the LPH coordinate system. Note that the scale of the displacements is largest in the push direction, FH, and smaller in the other directions. Slice is 16 (of 24, see Fig 3, middle graphic).
Highlights.
1 Hz motions correspond to heart driven motions in the body
Standard flow quantitation methods can also measure 1 Hz motions in gels/tissues
Non Linear Inversion methods convert 1 Hz velocity maps into high resolution maps of real shear modulus in gels/tissues
3D and 4D flow quantitation methods both work, but 4D is faster
6. Acknowledgements
Authors wish to acknowledge financial support from NIH/NIBIB, Grant/Award Number: R01EB018230, and from NIH/NIAAA, Grant/Award Number: R01AA023684.
Footnotes
Publisher's Disclaimer: This is a PDF file of an unedited manuscript that has been accepted for publication. As a service to our customers we are providing this early version of the manuscript. The manuscript will undergo copyediting, typesetting, and review of the resulting proof before it is published in its final citable form. Please note that during the production process errors may be discovered which could affect the content, and all legal disclaimers that apply to the journal pertain.
References
- [1].Kumar S, Weaver VM, Mechanics, malignancy, and metastasis: the force journey of a tumor cell, Cancer and Metastasis Reviews 28 (1–2) (2009) 113–127. [DOI] [PMC free article] [PubMed] [Google Scholar]
- [2].Ophir J, Cespedes I, Ponnekanti H, Yazdi Y, Li X, Elastography: a quantitative method for imaging the elasticity of biological tissues, Ultrasonic imaging 13 (2) (1991) 111–134. [DOI] [PubMed] [Google Scholar]
- [3].Muthupillai R, Lomas DJ, Rossman PJ, Greenleaf JF, Manduca A, Ehman RL, Magnetic resonance elastography by direct visualization of propagating acoustic strain waves, Science 269 (29 Sept) (1995) 1854–1857. [DOI] [PubMed] [Google Scholar]
- [4].Khalil AS, Chan RC, Chau AH, Bouma BE, Mofrad MRK, Tissue elasticity estimation with optical coherence elastography: toward mechanical characterization of in vivo soft tissue, Annals of biomedical engineering 33 (11) (2005) 1631–1639. [DOI] [PubMed] [Google Scholar]
- [5].Konofagou E, Ophir J, A new elastographic method for estimation and imaging of lateral displacements, lateral strains, corrected axial strains and poissons ratios in tissues, Ultrasound in Medicine and Biology 24 (8) (1998) 1183–1199. [DOI] [PubMed] [Google Scholar]
- [6].Chen J, Yin DM, Glaser KJ, Talwalkar JA, Ehman RL, Mr elastography of liver disease: State of the art, Appl Radiol 42 (4) (2013) 5–12. [PMC free article] [PubMed] [Google Scholar]
- [7].Sinkus R, Tanter M, Xydeas T, Catheline S, Bercoff J, Fink M, Viscoelastic shear properties of in vivo breast lesions measured by mr elastography, Mag Res Imaging 23 (2005) 159–165. doi: 10.1016/j.mri.2004.11.060. [DOI] [PubMed] [Google Scholar]
- [8].Sinkus R, Siegmann K, Xydeas T, Tanter M, Claussen C, Fink M, Mr elastography of breast lesions: Understanding the solid/liquid duality can improve the specificity of contrast-enhanced mr mammography, Mag Res Med 58 (2007) 1135–1144. doi: 10.1002/mrm.21404. [DOI] [PubMed] [Google Scholar]
- [9].Khan S, Fakhouri F, Majeed W, Kolipaka A, Cardiovascular magnetic resonance elastography. a review, NMR Biomed (2017) e3853–e3872 doi: 10.1002/nbm3853. [DOI] [PMC free article] [PubMed] [Google Scholar]
- [10].Kolipaka A, Schroeder S, Mo X, Shah Z, Hart PA, Conwell DL, Magnetic resonance elastography of the pancreas. measurement reproducibility and relationship with age, Mag Res Imaging 42 (2017) 1–7. doi: 10.1016/j.mri.2017.04.015. [DOI] [PMC free article] [PubMed] [Google Scholar]
- [11].Hiscox LV, Johnson CL, Barnhill E, McGarry MDJ, Huston J, van Beek EJR, Starr JM, Roberts N, Magnetic resonance elastography (mre) of the human brain. technique, findings and clinical applications, Phys Med Biol 61 (2016) R401–R437. [DOI] [PubMed] [Google Scholar]
- [12].Barnhill E, Hollis L, Sack I, Braun J, Hoskins PR, Pankaj P, Brown C, van Beek EJ, Roberts N, High-resolution mechanical imaging of the human brain by three-dimensional multifrequency magnetic resonance elastography at 7t, NeuroImage 90 (2014) 308–314. doi: 10.1016/j.media.2016.05.012. [DOI] [PubMed] [Google Scholar]
- [13].Sarvazyan A, Hall TJ, Urban MW, Fatemi M, Aglyamov SR, Garra BS, An overview of 310 elastography an emerging branch of medical imaging, Curr Med Imaging Rev 7 (4) (2011) 255–282. [DOI] [PMC free article] [PubMed] [Google Scholar]
- [14].Mariappan YK, Glaser KJ, Ehman RL, Magnetic resonance elastography: A review, Clin Anat 23 (5) (2010) 497–511. [DOI] [PMC free article] [PubMed] [Google Scholar]
- [15].Weaver JB, Pattison AJ, McGarry MD, Perreard IM, Swienckowski JG, Eskeya CJ, Lollis SS, Paulsen KD, Brain mechanical property measurement using mre with intrinsic activation, Phys Med Biol 57 (22) (2012) 7275–7287. doi: 10.1088/0031-9155/57/22/7275. [DOI] [PMC free article] [PubMed] [Google Scholar]
- [16].Perrin˜ez PR, Kennedy FE, Van Houten EE, Weaver JB, Paulsen KD, Magnetic resonance poroelastography: an algorithm for estimating the mechanical properties of fluid-saturated soft tissues, IEEE transactions on medical imaging 29 (3) (2010) 746–755. [DOI] [PMC free article] [PubMed] [Google Scholar]
- [17].Pattison AJ, McGarry M, Weaver JB, Paulsen KD, Spatially-resolved hydraulic conductivity estimation via poroelastic magnetic resonance elastography, IEEE transactions on medical imaging 33 (6) (2014) 1373–1380. [DOI] [PMC free article] [PubMed] [Google Scholar]
- [18].Pelc NJ, Bernstein MA, Shimakawa A, Glover GH, Encoding strategies for three-direction phasecontrast mr imaging of flow, J Mag Res Imaging 1 (1991) 405–413. [DOI] [PubMed] [Google Scholar]
- [19].Klatt D, Johnson CL, Magin RL, Simultaneous, multidirectional acquisition of displacement fields in magnetic resonance elastography of the in vivo human brain, J. Mag Reson. Imaging 42 (2) (2015) 297–304. doi:doi: 10.1002/jmri.24806. [DOI] [PMC free article] [PubMed] [Google Scholar]
- [20].Markl M, Chan FP, Alley MT, Wedding KL, Draney MT, Elkins CJ, Parker DW, Wicker R, Taylor CA, Herfkens RJ, Pelc NJ, Time-resolved three-dimensional phase-contrast mri, J Mag Res Imaging 17 (2003) 499–506. [DOI] [PubMed] [Google Scholar]
- [21].Wigstrom L, Sjoqvist L, Wranne B, Temporally resolved 3d phase-contrast imaging, Mag Res Med 36 (1996) 800–803. [DOI] [PubMed] [Google Scholar]
- [22].McGarry MDJ, VanHouten EEW, Perrinez PR, Pattison AJ, Weaver JB, Paulsen KD, An octahedral shear strain based measure of snr for 3d mr elastography, Phys Med Biol 56 (13) (2011) N153–N164. doi: 10.1088/0031-9155/56/13/N02. [DOI] [PMC free article] [PubMed] [Google Scholar]
- [23].Van Houten EE, Miga MI, Weaver JB, Kennedy FE, Paulsen KD, Three-dimensional subzonebased reconstruction algorithm for mr elastography, Magnetic Resonance in Medicine 45 (5) (2001) 827–837. [DOI] [PubMed] [Google Scholar]
- [24].McGarry M, Van Houten E, Johnson C, Georgiadis J, Sutton B, Weaver J, Paulsen K, Multiresolution mr elastography using nonlinear inversion, Medical physics 39 (10) (2012) 6388–6396. [DOI] [PMC free article] [PubMed] [Google Scholar]
- [25].Gallichan D, Robson MD, Bartsch A, Miller KL, Tremr: Table-resonance elastography with mr, Mag Res Med 62 (2009) 815–821. doi: 10.1002/mrm.22046. [DOI] [PubMed] [Google Scholar]
- [26].Gelatin manufacturers institute of america, gelatin handbook; (2012) 1–25. [Google Scholar]
- [27].Djabourov M, Leblond J, Papon P, Gelation of aqueous gelatin solutions. i. structural investigation., J de Physique 49 (2) (1988) 319–332. [Google Scholar]
- [28].Parker NG, Povey MJW, Ultrasonic study of the gelation of gelatin: Phase diagram, hysteresis and kinetics, Food Hydrocolloids 26 (1) (2012) 99–107. doi: 10.1016/j.foodhyd.2011.04.016. [DOI] [Google Scholar]


