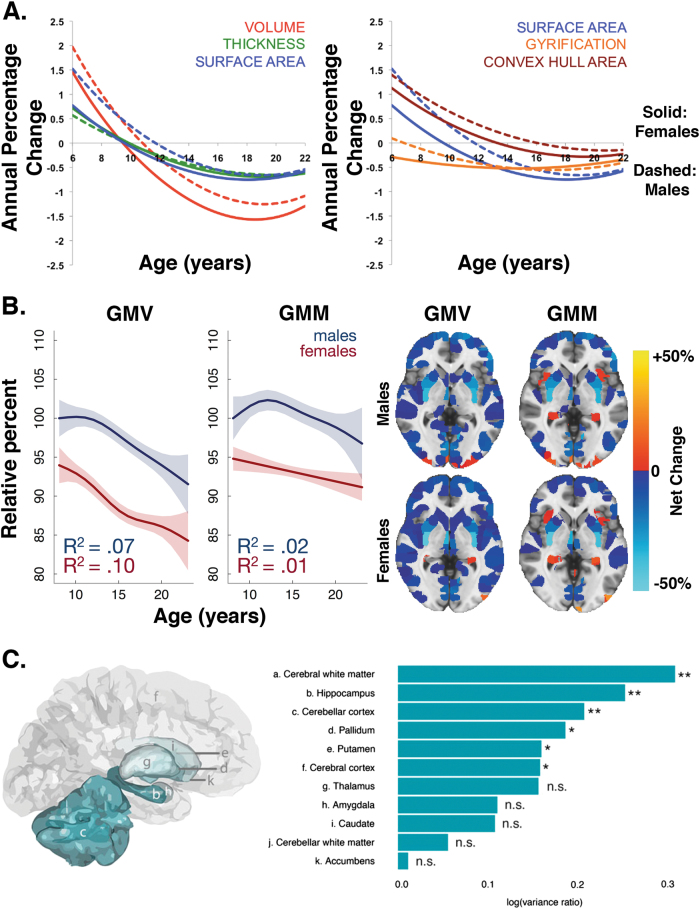
Fig. 1.
Female youth generally show smaller volumes than male youth (uncorrected for total brain size) while males show greater variability in brain volumes than females. a Sex differences in cortical volumes depend on the complex interaction between cortical thickness, convex hull area, and gyrification (adapted with permission from ref. [27]). b Male youth show greater gray matter volume (GMV) and gray matter mass (GMM) than female youth, where GMM = GMV × GMD. Brain maps indicate the percentage net change explained by sex (adapted with permission from ref. [21]). c Males show greater brain volume variance than females across multiple structures (adapted with permission from ref. [48])

