

Abstract
Key points
Inhibitory neuromuscular transmission (NMT) was compared in the internal anal sphincter (IAS) and rectum of the Cynomolgus monkey, an animal with high gene sequence identity to humans.
Nitrergic NMT was present in both muscles while purinergic NMT was limited to the rectum and VIPergic NMT to the IAS. The profile for monkey IAS more closely resembles humans than rodents.
In both muscles, SK3 channels were localized to PDGFRα+ cells that were closely associated with nNOS+/VIP+ nerves. Gene expression levels of P2RY subtypes were the same in IAS and rectum while KCNN expression levels were very similar.
SK3 channel activation and inhibition caused faster/greater changes in contractile activity in rectum than IAS. P2Y1 receptor activation inhibited contraction in rectum while increasing contraction in IAS.
The absence of purinergic NMT in the IAS may be due to poor coupling between P2Y1 receptors and SK3 channels on PDGFRα+ cells.
Abstract
Inhibitory neuromuscular transmission (NMT) was compared in the internal anal sphincter (IAS) and rectum of the Cynomolgus monkey, an animal with a high gene sequence identity to humans. Electrical field stimulation produced nitric oxide synthase (NOS)‐dependent contractile inhibition in both muscles whereas P2Y1‐dependent purinergic NMT was restricted to rectum. An additional NOS‐independent, α‐chymotrypsin‐sensitive component was identified in the IAS consistent with vasoactive intestinal peptide‐ergic (VIPergic) NMT. Microelectrode recordings revealed slow NOS‐dependent inhibitory junction potentials (IJPs) in both muscles and fast P2Y1‐dependent IJPs in rectum. The basis for the difference in purinergic NMT was investigated. PDGFRα+/SK3+ cells were closely aligned with nNOS+/VIP+ neurons in both muscles. Gene expression of P2RY was the same in IAS and rectum (P2RY1>>P2RY2‐14) while KCNN3 expression was 32% greater in rectum. The SK channel inhibitor apamin doubled contractile activity in rectum while having minimal effect in the IAS. Contractile inhibition elicited with the SK channel agonist CyPPA was five times faster in rectum than in the IAS. The P2Y1 receptor agonist MRS2365 inhibited contraction in rectum but increased contraction in the IAS. In conclusion, both the IAS and the rectum have nitrergic NMT whereas purinergic NMT is limited to rectum and VIPergic NMT to the IAS. The profile in monkey IAS more closely resembles that of humans than rodents. The lack of purinergic NMT in the IAS cannot be attributed to the absence of PDGFRα+ cells, P2Y1 receptors or SK3 channels. Rather, it appears to be due to poor coupling between P2Y1 receptors and SK3 channels on PDGFRα+ cells.
Keywords: PDGFRα+ cells, calcium‐activated potassium channels, P2Y1 receptors, enteric, gastrointestinal
Key points
Inhibitory neuromuscular transmission (NMT) was compared in the internal anal sphincter (IAS) and rectum of the Cynomolgus monkey, an animal with high gene sequence identity to humans.
Nitrergic NMT was present in both muscles while purinergic NMT was limited to the rectum and VIPergic NMT to the IAS. The profile for monkey IAS more closely resembles humans than rodents.
In both muscles, SK3 channels were localized to PDGFRα+ cells that were closely associated with nNOS+/VIP+ nerves. Gene expression levels of P2RY subtypes were the same in IAS and rectum while KCNN expression levels were very similar.
SK3 channel activation and inhibition caused faster/greater changes in contractile activity in rectum than IAS. P2Y1 receptor activation inhibited contraction in rectum while increasing contraction in IAS.
The absence of purinergic NMT in the IAS may be due to poor coupling between P2Y1 receptors and SK3 channels on PDGFRα+ cells.
Introduction
Enteric inhibitory motor neurons initiate relaxation of the internal anal sphincter (IAS) during defecation to permit evacuation of faecal contents (Cheeney et al. 2012; Rattan, 2005). Studies of inhibitory neuromuscular transmission (NMT) in the IAS of mouse, rabbit, rat and guinea‐pig have identified nitrergic, purinergic and vasoactive intestinal peptide‐ergic (VIPergic) NMT (Biancani et al. 1985; Rae & Muir, 1996; De Luca et al. 1999; Opazo et al. 2011; Duffy et al. 2012; Keef et al. 2013; Cobine et al. 2014). However, to date there are no equivalent studies that have systematically examined inhibitory NMT in the IAS of a primate species. Previous studies of excitatory NMT in canine and Cynomolgus monkey have revealed that excitatory motor innervation shifts from extrinsic sympathetic in the IAS to enteric cholinergic in rectum (Tichenor et al. 2002; Cobine et al. 2010). The present study examined whether there are also significant differences in the nature of inhibitory NMT in the IAS and rectum of the Cynomolgus monkey, an animal with high gene sequence identity to humans.
Historically, inhibitory NMT in the gastrointestinal (GI) tract was defined by the types of neurotransmitters not involved in transmission [i.e. non‐adrenergic, non‐cholinergic (NANC) transmission]. The first substance identified as a NANC neurotransmitter was ATP, giving rise to the term ‘purinergic NMT’ (Burnstock et al. 1970). Since then additional purines including β‐NAD, ADP ribose and Up4A have been identified as candidate purinergic neurotransmitters (Mutafova‐Yambolieva et al. 2007; Hwang et al. 2011; Durnin et al. 2012, 2014). In addition, our understanding of the pathway underlying purinergic NMT has progressed. Purines released from inhibitory motor neurons give rise to activation of P2Y1 receptors (Gallego et al. 2006, 2016) located on a unique population of fibroblast‐like cells that are closely associated with inhibitory motor neurons (Horiguchi & Komuro, 2000; Cobine et al. 2011; Kurahashi et al. 2011). These cells highly express the receptor tyrosine kinase, platelet‐derived growth factor receptor alpha (PDGFRα), hence the name ‘PDGFRα+ cells’. Release of purines from neurons leads to activation of P2Y1 receptors on PDGFRα+ cells followed by calcium release from the endoplasmic reticulum and activation of small conductance calcium‐activated potassium (SK3) channels. The current generated by this action spreads to adjacent smooth muscle cells via gap junctions resulting in hyperpolarization, inhibition of voltage‐dependent calcium channels and contractile inhibition (Kurahashi et al. 2011, 2012, 2014; Baker et al. 2013; Sanders et al. 2014). The inhibitory junction potential (IJP) generated via purinergic NMT is referred to as a ‘fast’ IJP because its time course is more rapid than that initiated by other NANC neurotransmitters (Xue et al. 1999). Numerous studies have characterized the electrical events underlying purinergic NMT in the rodent IAS (Rae & Muir, 1996; McDonnell et al. 2008; Opazo et al. 2011; Duffy et al. 2012). However, the one study undertaken on the human IAS suggests that purinergic NMT is absent (O'Kelly et al. 1993). The present study therefore included a systematic comparison of purinergic NMT in the IAS and rectum of the Cynomolgus monkey, a primate species closely related to humans.
In 1989 an additional NANC neurotransmitter was identified, i.e. the free radical nitric oxide (NO) (Gillespie et al. 1989; Li & Rand, 1989). Since then NO has increasingly become recognized as a key molecule contributing to inhibitory NMT in the GI tract, including the monkey and human IAS (O'Kelly et al. 1993; Cobine et al. 2010) and rectum (Cobine et al. 2010). In 1996, intramuscular interstitial cells of Cajal (ICC‐IM) were shown to play an important role in mediating nitrergic NMT in the GI tract (Burns et al. 1996; Ward & Sanders, 2006) and we have previously identified ICC‐IM in the monkey IAS and rectum (Cobine et al. 2010).
Finally, a third ultraslow neural pathway has been identified which is peptidergic. We have shown that the ultraslow inhibitory neural pathway in the mouse IAS is VIPergic because it is absent from a VIP knockout mouse (Keef et al. 2013). Prior to this, a number of studies suggested that VIPergic NMT was present in the IAS of various species. VIP anti‐serum and antagonists of VIP have been shown to reduce electrical field stimulation (EFS)‐induced relaxations in rabbit and murine IAS in vitro (Biancani et al. 1985; Rattan et al. 2005; Keef et al. 2013). VIP has also been shown to reduce pressure in the opossum IAS in vivo, an effect that was reversed by VIP antagonists (Nurko & Rattan, 1988).
The present study identified nitrergic NMT in the monkey IAS and rectum whereas purinergic NMT was limited to rectum and VIPergic NMT to the IAS. The profile for the monkey IAS is closer to that of humans (O'Kelly et al. 1993) than rodents (Rae & Muir, 1996; McDonnell et al. 2008; Opazo et al. 2011; Duffy et al. 2012). Because it is not known why purinergic NMT is present in some GI muscles but not others, we compared the mediators of purinergic NMT in the monkey IAS and rectum to determine the extent to which each is present and functional. Our results suggest that purinergic NMT is absent from the IAS because of poor coupling between P2Y1 receptors and SK3 channels on PDGFRα+ cells.
Methods
Tissue preparation
The Cynomolgus monkeys used for these studies were housed and maintained at Charles River Laboratories, Preclinical Services, Reno, NV. Maintenance, euthanasia, tissue collection and experiments were performed in accordance with the National Institutes of Health Guide for the Care and Use of Laboratory Animals. The Institutional Animal Care and Use Committee (IACUC approval # I‐001358, Charles River Laboratories) ensured compliance with the United States Department of Agriculture, Public Health Service Office of Laboratory Animal Welfare Policy and the Animal Welfare act. Cynomolgus monkeys of either sex (2–8 years of age), weighing between 2.5 and 7.5 kg were killed at Charles River Laboratories. No monkeys were bred or killed specifically for the present study. The animals were initially sedated with ketamine (10 mg/kg), then administered 0.7 mL Beuthanasia‐D solution (pentobarbital sodium and phenytoin sodium) followed by exsanguination. Various tissue samples from three or four monkeys were provided to several laboratories within the Department of Physiology and Cell Biology at the University of Nevada, Reno, when Charles River Laboratories killed animals from their colony, i.e. at irregular intervals ranging between 1 and 6 months. Over the 11 years that experiments were ongoing for this study, data were collected from rectoanal tissues obtained from 124 monkeys. Approximately 7% of tissues obtained were excluded due to a lack of spontaneous contractile activity or a lack of response to the application of an agonist. The animal work in this publication complies with the Journal of Physiology animal ethics checklist (Grundy, 2015).
Tissues were obtained by first exposing the rectoanal region by sawing through the midline of the pelvic bone. Incisions were made on either side of the rectum and through the skin adjacent to the anus to allow removal of the last 6–12 cm portion of the GI tract which was placed in a plastic bag containing cold Krebs–Ringer bicarbonate solution (KRBS). KRBS solution had the following composition (in mM): NaCl 118.5, KCl 4.7, CaCl2 2.5, MgCl2 1.2, NaHCO3 23.8, KH2PO4 1.2, dextrose 11.0. This solution had a pH of 7.4 at 37°C when bubbled to equilibrium with 95% O2/5% CO2. The bag was sealed and subsequently transported on ice within 30 min to the University of Nevada, Reno. All adhering skeletal muscle, glands and mucosa were removed after pinning in a Sylgard elastomer‐coated dissecting dish. The monkey IAS is ∼8 mm in width (Cobine et al. 2010) and circular muscle strips were taken from the distal half of this muscle. Rectal muscle strips were cut parallel to the circular muscle layer at distances 3–4 cm proximal to the distal extremity of the GI tract. Experiments were either undertaken on freshly isolated muscles or muscles stored overnight in KRBS at 4°C.
Contractile experiments
Muscle strips (1.5 × 15 mm) were attached with sutures to a stable mount and to a Gould strain gauge and immersed in tissue baths containing 15 mL of oxygenated KRBS solution maintained at 37°C. An initial stretch of 0.5 g was applied to muscle strips. Experiments were undertaken after 1 h of equilibration. EFS was applied with a Grass S48 stimulator (15 V, 0.3 ms duration pulses). These stimulation parameters produced TTX‐ (1 μM) sensitive neural responses. The possible contribution of cholinergic and sympathetic nerves was eliminated by performing all nerve stimulation experiments in the presence of 1 μM atropine and 10 μM guanethidine. Experiments in which the contractile effects of exogenous agonists and antagonists were examined were performed in the presence of 1 μM atropine and 1 μM guanethidine. Additional neural blockers used are described in the Results.
Contraction analysis
Analysis of contractile experiments was carried out using AcqKnowledge 3.8 software (Biopac Systems, Inc., Goleta, CA, USA). The pattern of contractile activity in the IAS and rectum is complex and includes phasic as well as tonic components (see Fig. 1). To include all aspects of this contractile activity we therefore measured the mean contractile amplitude during a predefined period of time. Mean control amplitude was measured over sufficient time (∼2‐5 min) to include a representative sampling of full cycle rhythmic events. Mean contractile amplitude with EFS was determined either during the entire 60 s period of stimulation or during the initial 10 s of EFS.
Figure 1. Spontaneous contractile activity in the IAS and rectum and the effect of NOS and P2Y1 receptor blockade.
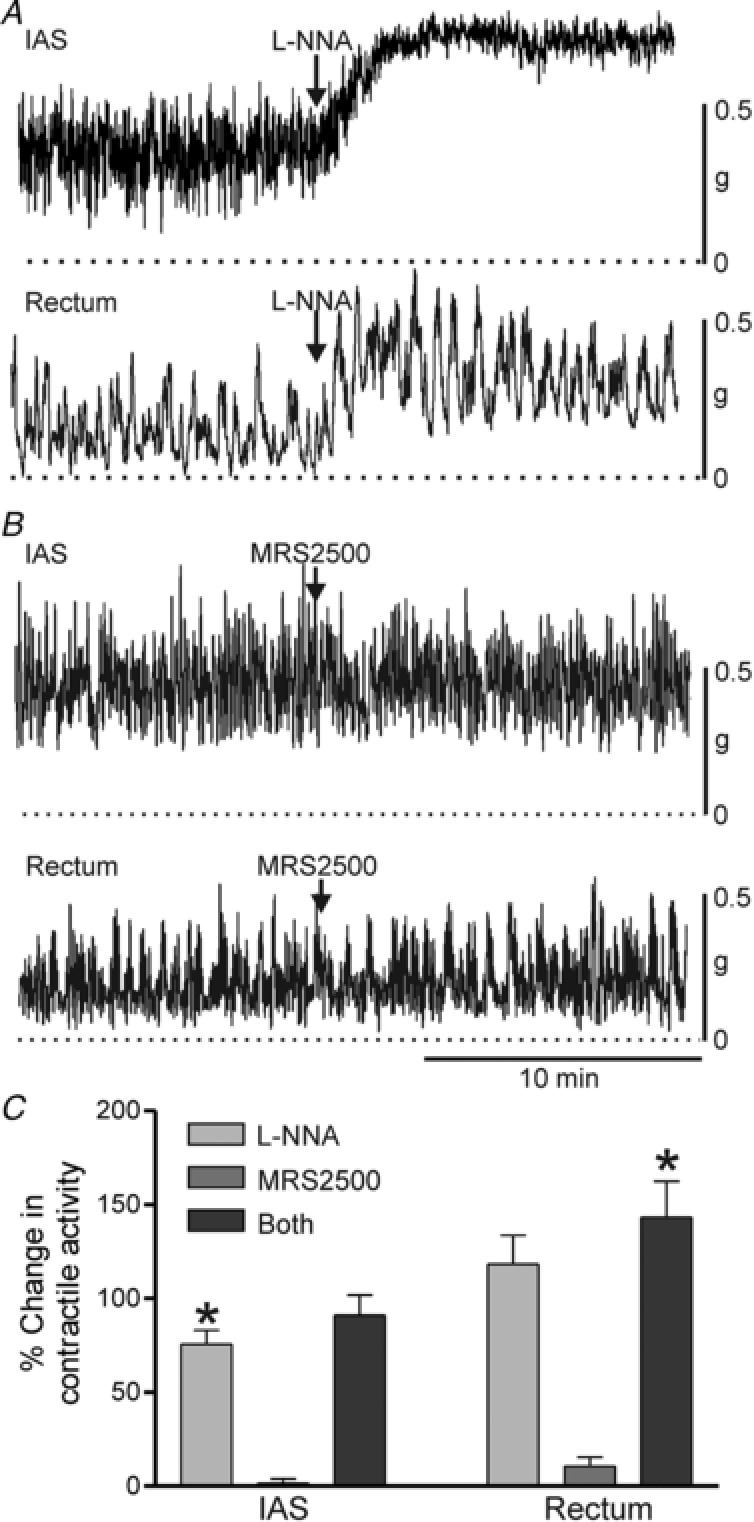
Sample traces showing contractile activity before and after NOS blockade with 100 μM l‐NNA (A) or P2Y1 receptor blockade with 1 μM MRS2500 (B) in the IAS (upper traces) and rectum (lower traces). C, bar graph summarizing the effects on contractile activity by blockade of one or both of these neural pathways. In both tissues, l‐NNA significantly (* P < 0.05) increased contractile activity (IAS, n = 16; rectum, n = 14) whereas MRS2500 (IAS, n = 5; rectum n = 5) did not (P > 0.05). The increase in contractile activity observed when both l‐NNA and MRS2500 (IAS, n = 5; rectum n = 9) were added together was not different (P > 0.05) from l‐NNA alone. Shown are mean values ± SD.
The response to apamin was evaluated by determining mean contractile amplitude during a 60 s period encompassing the peak response. The time course of contractile inhibition with CyPPA (cyclohexyl‐[2‐(3,5‐dimethyl‐pyrazol‐1‐yl)‐6‐methyl‐pyrimidin‐4‐yl]‐amine) in the absence of apamin was quantified by determining when mean contractile amplitude reached 50% of control contractile amplitude. The amount of contraction generated by CyPPA in the presence of apamin was quantified by determining the mean contractile amplitude for 60 s during the peak response. The contractile responses to MRS2365 and ADPβS (adenosine 5’‐[β‐thio]diphosphate) were quantified by determining the mean contractile response during the first 4 min following addition of the drug. For most experiments the mean contractile amplitude during an experimental intervention was normalized to the mean contractile amplitude measured immediately preceding it. This normalized value was then plotted in bar graphs as ‘% Change in contractile activity’. The absence of a change in contractile activity was designated as zero while increased activity was assigned a positive value and decreased activity a negative value.
The relationship between spontaneous contractile amplitude and maximum contraction was estimated by treating muscles with 100 μM N(ω)‐nitro‐l‐arginine (l‐NNA) followed by addition of 10 μM acetylcholine plus 60 mM KCl to the rectum or 10 μM noradrenaline (norepinephrine) plus 60 mM KCl to the IAS. Muscles were stimulated with different agonists because there are reciprocal gradients for adrenergic and muscarinic receptors from IAS to rectum (Tichenor et al. 2002). Because peak contraction with agonist plus KCl is not sustained, the peak spontaneous contractile amplitude was normalized to peak drug plus KCl‐induced amplitude. Zero active tension was determined at the end of the experiment with 10 μM sodium nitroprusside (SNP) and 1 μM nifedipine.
Intracellular measurements
Muscle strips were pinned, submucosal surface up, to the base of an electrophysiological chamber. Glass microelectrodes (filled with 3 M KCl; tip resistances ranging from 60 to 100 MΩ) were used to make intracellular impalements. Impalements were accepted upon the basis of a rapid drop in potential upon entering the cell and return of potential to near zero after removing the electrode from the cell. Membrane potential was measured with a high‐input impedance electrometer (WPI Duo 773) and outputs were displayed on an oscilloscope (Nicolet 3091) and PC. A data acquisition program (AcqKnowledge; Biopac Systems) was used to store and analyse data. Nerves were stimulated with platinum electrodes placed on either side of the preparation. Nerve stimulation experiments were carried out in the presence of 1 μM atropine and 10 μM guanethidine to eliminate any contribution from cholinergic and sympathetic nerves, respectively. Experiments were carried out in the presence of the L‐type calcium channel (CavL) antagonist nifedipine (1 μM) to maintain impalements. Slow waves were abolished under these conditions.
Analysis of intracellular measurements
Resting membrane potential was determined as the average value prior to nerve stimulation. The amplitude of the inhibitory junction potential (IJP) elicited with EFS was derived by subtracting resting membrane potential from peak hyperpolarization.
Statistical analysis
For both contractile and intracellular measurements, significant differences between groups were determined using one‐way ANOVA followed by a post hoc Dunn's or Tukey test. Data are expressed as mean ± SD and values were considered significantly different at P < 0.05. N values indicate the number of animals used.
Drugs
TTX, atropine sulphate, l‐NNA, noradrenaline, acetylcholine, ADPβS, apamin, guanethidine, α‐chymotrypsin, SNP and nifedipine were purchased from Millipore Sigma (St Louis, MO, USA). MRS2179, MRS2500, MRS2365, apamin and CyPPA were purchased from R&D Systems (Minneapolis, MN, USA). VIP was purchased from Bachem (Torrance, CA, USA).
Immunohistochemistry
Cryosections
Muscle preparations of the IAS and rectum were pinned taut in a dissecting dish using micro‐pins before fixing in ice‐cold 4% (w/v) paraformaldehyde solution for 30 min at 20°C. Tissues were then washed in 0.1 M PBS overnight at 4°C. Tissue preparations were dehydrated in graded sucrose solutions (5, 10, 15%, 15 min each; 20%, ∼16 h) before embedding in a 1:1 mixture of 20% sucrose and Tissue Tek OTC compound (Sakura Finetek, Torrance, CA, USA) and were subsequently frozen and stored at −80°C. Sections were cut parallel to the circular muscle layer at a thickness of 10–12 μm using a Leica CM 3050 cryostat (Leica Microsystems, Wetzlar, Germany). To reduce non‐specific antibody binding, tissues were incubated in bovine serum albumin (BSA; 1%, w/v; Sigma, 1 h at 20°C). Incubation with the first primary antibody (anti‐PDGFRα, anti‐Kit or anti‐VIP) was carried out for 12–24 h at 4°C. To achieve greater penetration during labelling, incubations of the tissue preparations with primary antibodies were carried out using Triton‐X 100 (0.5%; Sigma). Following 3–4 h washing with PBS, tissues were incubated with the appropriate secondary antibody for 1 h at 20°C (1:1000; Alexa Fluor, Molecular Probes, Eugene, OR, USA). Cryosections were washed for 4–6 h before repeating the process with the other primary antibody (anti‐nNOS or anti‐SK3). Negative controls, i.e. sections incubated without primary antisera, were examined to ensure specificity of fluorescence labelling. A list of the primary antibodies is given in Table 1.
Table 1.
Antibodies
| Primary antibody | Source | Host | Working dilution |
|---|---|---|---|
| Anti‐human PDGFRα | R&D Systems, Minneapolis, MN, USA | Goat | 1:100 |
| Anti‐human SCFR (Kit) | R&D Systems | Goat | 1:100 |
| Anti‐nNOS (used with anti‐Kit and anti‐PDGFRα) | Santa Cruz Biotechnology Inc., Dallas, TX, USA | Rabbit | 1:500 |
| Anti‐nNOS (used with anti‐VIP) | Gift from Dr Piers Emson, Molecular Science Group, Cambridge, UK | Sheep | 1:500 |
| Anti‐SK3 | Alomone Labs, Jerusalem, Israel | Rabbit | 1:500 |
| Anti‐VIP | Immunostar Antibodies, Hudson, WI, USA | Rabbit | 1:500 |
Imaging
Cryosections were examined using a Zeiss LSM 510 confocal microscope (Carl Zeiss, Thornwood, NY, USA). Final images of IAS and rectum generated using the confocal imaging system are digital composites of Z‐series of 0.5 μm optical sections through a depth of 4–11.5 μm. Final images were constructed using Zeiss LSM 5 Image Examiner Software, Adobe Photoshop CS5 and Corel Draw X4.
Gene expression
Whole tissue RT‐PCR and qPCR
Total RNA was isolated from whole circular muscle using TRIzol Reagent (Life Technologies, Carlsbad, CA, USA) following the manufacturer's protocol. qScript™ cDNA SuperMix (Quanta Biosciences, Gaithersburg, MD, USA) was used to synthesize first‐strand cDNA according to the manufacturer's instructions. GoTaq DNA Polymerase (Promega, Madison, WI, USA) was used to perform RT‐PCR with the gene‐specific primers listed in Table 2. Resulting PCR products were analysed on 2% agarose gels and visualized by ethidium bromide. Quantitative PCR (qPCR) was performed with the same primers as those used for RT‐PCR using Fast Sybr green chemistry on the 7900HT Fast Real‐time PCR System (Applied Biosystems, Foster City, CA, USA). Standard curves were generated by using regression analysis of the mean values of eight multiplex qPCRs for the log10 diluted cDNA. Unknown amounts of mRNA were plotted with respect to the standard curve for each set of primers providing transcriptional quantification of each gene relative to the endogenous glyceraldehyde‐3‐phosphate dehydrogenase (Gapdh) standard after log transformation of the corresponding raw data. qPCR analysis was run in duplicate for each tissue sample.
Table 2.
Primer sequences used for qPCR
| Gene name, forward and reverse primers | Primer sequence | Accession no. | Expected size (base pairs) |
|---|---|---|---|
|
|
NM_002046 | 185 |
|
|
XM_005555277 | 100 |
|
|
XM_005555272 | 139 |
|
|
XM_005541654 | 187 |
|
|
XM_005546151 | 138 |
|
|
XM_005579015 | 166 |
|
|
XM_005593850 | 137 |
|
|
XM_005579022 | 150 |
|
|
XM_005587927 | 151 |
|
|
XM_005587927 | 197 |
|
|
XM_005587927 | 100 |
|
|
XM_005546104 | 189 |
|
|
XM_005546107 | 185 |
|
|
XM_005546109 | 119 |
Results
Basal contractile activity in the IAS and rectum
Isolated strips of the monkey IAS and rectum began contracting spontaneously 15–30 min after submersion in an isolated tissue bath. The pattern of spontaneous contractions varied between muscles and could loosely be divided into four types: I, phasic activity without tone; II, phasic activity with some tone; III, predominantly tone with superimposed phasic activity; and IV, tone with very little phasic activity. Spontaneous contractile activity in rectum varied between patterns I and II whereas activity in the IAS varied between patterns II and III. The NOS inhibitor l‐NNA (100 μM) increased the amount of tone in both muscles. The response to l‐NNA differed in that phasic contractions were reduced in amplitude in the IAS but not in rectum (Fig. 1 A). In both muscles l‐NNA resulted in a significant increase in mean contractile activity (Fig. 1 C). In contrast to l‐NNA, the P2Y1 receptor antagonist MRS2500 did not modify the pattern or amplitude of contractile activity in either muscle (Fig. 1 B,C). Furthermore, the response to combined addition of MRS2500 plus l‐NNA was not different from l‐NNA alone (Fig. 1 C). Peak spontaneous contractile amplitude was less than 50% of maximum contraction in both muscles, i.e. 43.4 ± 3.3% (n = 8) for the IAS and 24.1 ± 2.2% (n = 13) for the rectum (see Methods for further details).
Modulation of contractile and electrical activity by stimulation of inhibitory motor neurons
Nerve induced inhibition of contraction
The contractile response to stimulation of inhibitory motor neurons with EFS was examined in isolated strips of the IAS and rectum. EFS (60 s, 1 or 5 Hz) reduced spontaneous contractions in both muscles with 5 Hz EFS reducing contractile activity by >80% (Fig. 2). The response to 5 Hz EFS in the IAS was significantly greater (P < 0.05) than for 1 Hz (Fig. 2 A) whereas in rectum responses to 1 and 5 Hz EFS were not different (Fig. 2 B). To examine the role of nitrergic NMT we tested the effect of the NOS inhibitor l‐NNA (100 μM). l‐NNA significantly (P < 0.05) reduced neural responses to 1 and 5 Hz EFS in the IAS (Fig. 2 A) whereas in rectum only the 1 Hz response was reduced (Fig. 2 B, P < 0.05). The time course of the IAS response to EFS in the presence of l‐NNA was slower. Whereas the first 10 s of EFS at 1 and 5 Hz significantly (P < 0.05) decreased contractile activity in the absence of l‐NNA (−49 ± 14.8% for 1 Hz and −69.0 ± 9.8% for 5 Hz, n = 15), in the presence of l‐NNA it did not (i.e. −1.2 ± 1.4% for 1 Hz and −7.3 ± 6.7% for 5 Hz, n = 13) (P > 0.05).
Figure 2. Contractile responses to stimulation of inhibitory motor neurons in the monkey IAS and rectum.
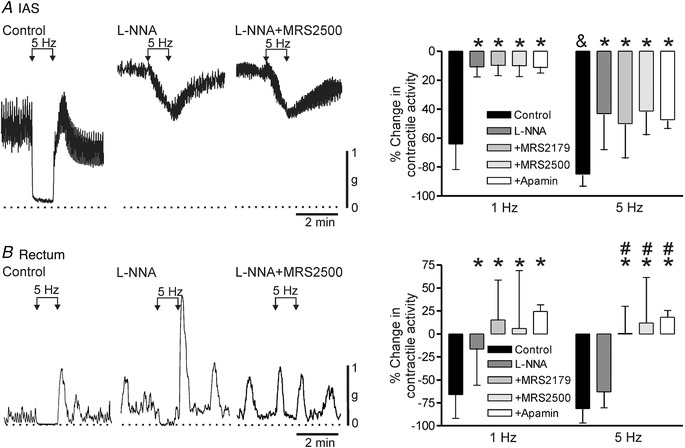
Sample traces show responses to 5 Hz EFS in the IAS (A) and rectum (B) under control conditions (left trace), in the presence of 100 μM l‐NNA (middle trace) and with combined l‐NNA plus 1 μM MRS2500 (right trace). l‐NNA and MRS2500 were added at least 20 min before EFS. The dotted lines indicate zero active contraction. A (right), bar graph plotting summary data for responses to 1 and 5 Hz EFS in IAS under control conditions (1 Hz, n = 15; 5 Hz, n = 15) in the presence of l‐NNA (1 Hz, n = 9; 5 Hz, n = 9) and with combined l‐NNA plus 10 μM MRS2179 (1 Hz, n = 7; 5 Hz, n = 7), 1 μM MRS2500 (1 Hz, n = 7; 5 Hz, n = 9) or apamin (1 Hz, n = 8; 5 Hz, n = 8). The response to 5 Hz EFS was significantly (& P < 0.05) greater than to 1 Hz EFS. l‐NNA significantly (* P < 0.05) reduced responses to 1 and 5 Hz EFS in the IAS. Responses in the presence of l‐NNA in combination with either MRS2179, MRS2500 or apamin were also significantly less than control (* P < 0.05) but not different from one another (P > 0.05). B (right), bar graph plotting summary data for responses to 1 and 5 Hz EFS in rectum under control conditions (1 Hz, n = 25; 5 Hz, n = 24) in the presence of l‐NNA (1 Hz, n = 22; 5 Hz, n = 24), with combined l‐NNA plus 10 μM MRS2179 (1 Hz, n = 10; 5 Hz, n = 9), 1 μM MRS2500 (1 Hz, n = 12; 5 Hz, n = 16) or apamin (1 Hz, n = 6; 5 Hz, n = 6). l‐NNA significantly (* P < 0.05) reduced the response to 1 Hz but not 5 Hz EFS in rectum. No further change in the 1 Hz response was noted when l‐NNA was combined with either MRS2179, MRS2500 or apamin. In contrast, with 5 Hz EFS the response with combined antagonists was significantly less than either control (* P < 0.05) or l‐NNA alone (# P < 0.05). Shown are mean values ± SD.
To examine the role of purinergic NMT we also tested the effects of several blockers of this pathway. In the IAS, neither P2Y1 receptor antagonists (i.e. MRS2179 at 10 μM or MRS2500 at 1 μM) nor the SK channel blocker apamin caused a further reduction in the NOS‐independent EFS‐induced response (Fig. 2 A) whereas NOS‐independent responses in rectum were abolished (Fig. 2 B).
A final series of experiments examined the possible role of VIPergic NMT in the IAS by testing α‐chymotrypsin, a proteolytic enzyme that preferentially cleaves peptides such as VIP at tyrosine residues (Mule & Serio, 2003). This approach was used because preliminary screening of VIP receptor antagonists including the one used in our previous study (i.e. VIP6‐28 at 30 μM; Keef et al. 2011) failed to reduce the response to a low concentration of exogenously applied VIP (i.e. 30 nM).
Under control conditions (i.e. nitrergic and purinergic NMT intact), α‐chymotrypsin (6 U/mL) did not significantly reduce the response to 5 Hz EFS for 60 s (Fig. 3 A,C). In contrast, when α‐chymotrypsin was tested in the presence of l‐NNA and MRS2500 it reduced the response by 60% (Fig. 3 B,C) providing evidence for VIPergic NMT. Finally, application of VIP (30 nM) caused >80% reduction in contractile activity in the IAS and rectum and this effect was greatly reduced or abolished by α‐chymotrypsin (Fig. 3 D).
Figure 3. Effect of α‐chymotrypsin on inhibitory NMT and on VIP in the absence and presence of NOS and P2Y1 blockade.
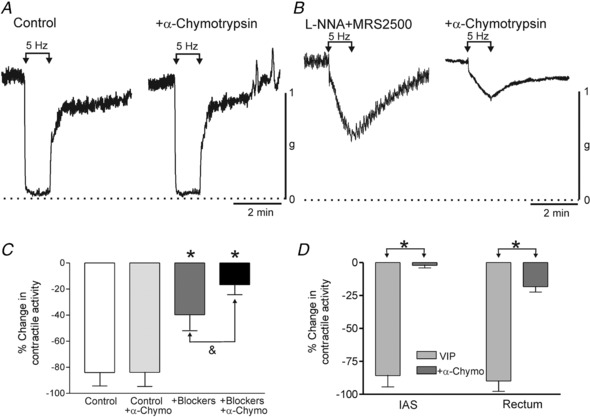
A, sample traces showing responses to 5 Hz EFS in the IAS under control conditions (NOS and P2Y1 blockers absent) ±α‐chymotrypsin (6 U/mL). Under these conditions α‐chymotrypsin did not reduce the 5 Hz EFS response (P > 0.05). B, sample traces showing responses to 5 Hz EFS in the IAS in the presence of l‐NNA (100 μM) and MRS2500 (1 μM) in the IAS. Under these conditions α‐chymotrypsin caused a 60% reduction in the response to 5 Hz EFS. C, bar graph plotting summary data for the change in contractile activity in response to 5 Hz EFS under the four conditions shown in A and B. α‐Chymotrypsin (n = 9) did not significantly reduce (P > 0.05) the control response to 5 Hz EFS (n = 9). As shown in Fig. 2, the response to 5 Hz EFS was significantly less (* P < 0.05) in the presence of blockers (l‐NNA and MRS2500, n = 5). Under these conditions, α‐chymotrypsin significantly reduced (& P < 0.05) the remaining response (n = 5). D, bar graph plotting summary data for the effect of 30 nM VIP on contractile activity in the rectum and IAS ±α‐chymotrypsin (l‐NNA and MRS2500 present throughout). VIP caused >80% contractile inhibition in both muscles (IAS, n = 7; rectum, n = 8) that was greatly reduced or abolished (* P < 0.05) by α‐chymotrypsin (IAS, n = 6; rectum, n = 5). Shown are mean values ± SD.
Neurally induced changes in membrane potential
The electrical events associated with EFS were examined with intracellular microelectrodes. Resting membrane potential was significantly (P < 0.05) less negative in the IAS (−42.4 ± 3.9 mV, n = 13) than in rectum (−49.2 ± 1.4 mV, n = 13). A single stimulus of EFS gave rise to an IJP that was smaller in amplitude in the IAS (13.8 ± 3.7 mV, n = 11; Fig. 4 A) than in rectum (24.3 ± 5.3 mV, n = 9; Fig. 4 B) and had a slower time to peak (1.41 ± 0.36 s, n = 11 IAS vs. 0.49 ± 0.05 s, n = 9 rectum). Repetitive EFS (1 Hz, 10 s) produced a small summation of IJPs in IAS (Fig. 4 A, 18.4 ± 3.1 mV, n = 4) whereas in rectum the first IJP in a train was always the largest (Fig. 4 B). The rectal fast IJP (single stimulus) was followed by a slower phase of repolarization. A distinct secondary hyperpolarization was noted when a brief train of EFS was applied (5 Hz, 1 s) while persistent hyperpolarization occurred between peak IJPs with longer stimulus trains (i.e. 1 Hz, 10 s; Fig. 4 B). l‐NNA (100 μM) significantly (P < 0.05) depolarized membrane potential in the IAS (−38.9 ± 3.2, n = 8) and abolished IJPs. l‐NNA also significantly depolarized rectum (−46.8 ± 2.1 mV, n = 9) and eliminated the slow component of the IJP at all frequencies tested. Peak IJP amplitude in rectum was unchanged in the presence of l‐NNA (24.4 ± 5.4 mV, n = 9). VIPergic NMT has previously been shown to produce an ultraslow IJP in the mouse IAS (Keef et al. 2013). However, because stimulus trains in the present study were limited to 10 s, there was insufficient time to characterize this ultraslow component.
Figure 4. Electrical responses to stimulation of inhibitory motor neurons in the monkey IAS and rectum.
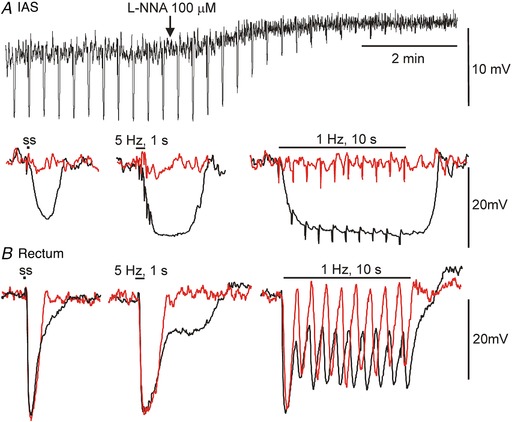
A, upper trace shows a slow sweep trace of inhibitory junction potentials (IJPs) elicited with single stimuli applied every 20 s to the IAS. l‐NNA (100 μM) caused a 4 mV depolarization and blocked IJPs. Lower trace shows faster sweep speed examples of IJPs elicited with a single stimulus (ss, left), 5 Hz, 1 s (middle) or 1 Hz, 10 s (right) under control conditions (black) and following addition of l‐NNA (red). B, sample traces at fast sweep speed showing composite IJPs elicited in rectum under control conditions (black) with the same stimulus protocols as in A. In the presence of l‐NNA (red) the slower component of hyperpolarization was abolished while peak IJP amplitude was unchanged.
To examine the role of purinergic NMT in rectum, single IJPs were elicited at 20 s intervals in the presence of l‐NNA (Fig. 5). MRS2179 (10 μM) and desensitization of P2Y receptors with the stable ADP analogue ADPβS (10 μM) each reduced IJP amplitude by >90%. These effects differed from one another in that MRS2179 did not change resting membrane potential (Fig. 5 A) whereas ADPβS caused a transient hyperpolarization that reversed to a small depolarization after ∼5 min (Fig. 5 B). MRS2179 (Fig. 5 A,C) and ADPβS (Fig. 5 B,C) also abolished fast IJPs elicited with multiple stimuli.
Figure 5. NOS‐independent inhibitory junction potentials (IJPs) in rectum are blocked by purinergic antagonists (L‐NNA 100 μM present throughout).
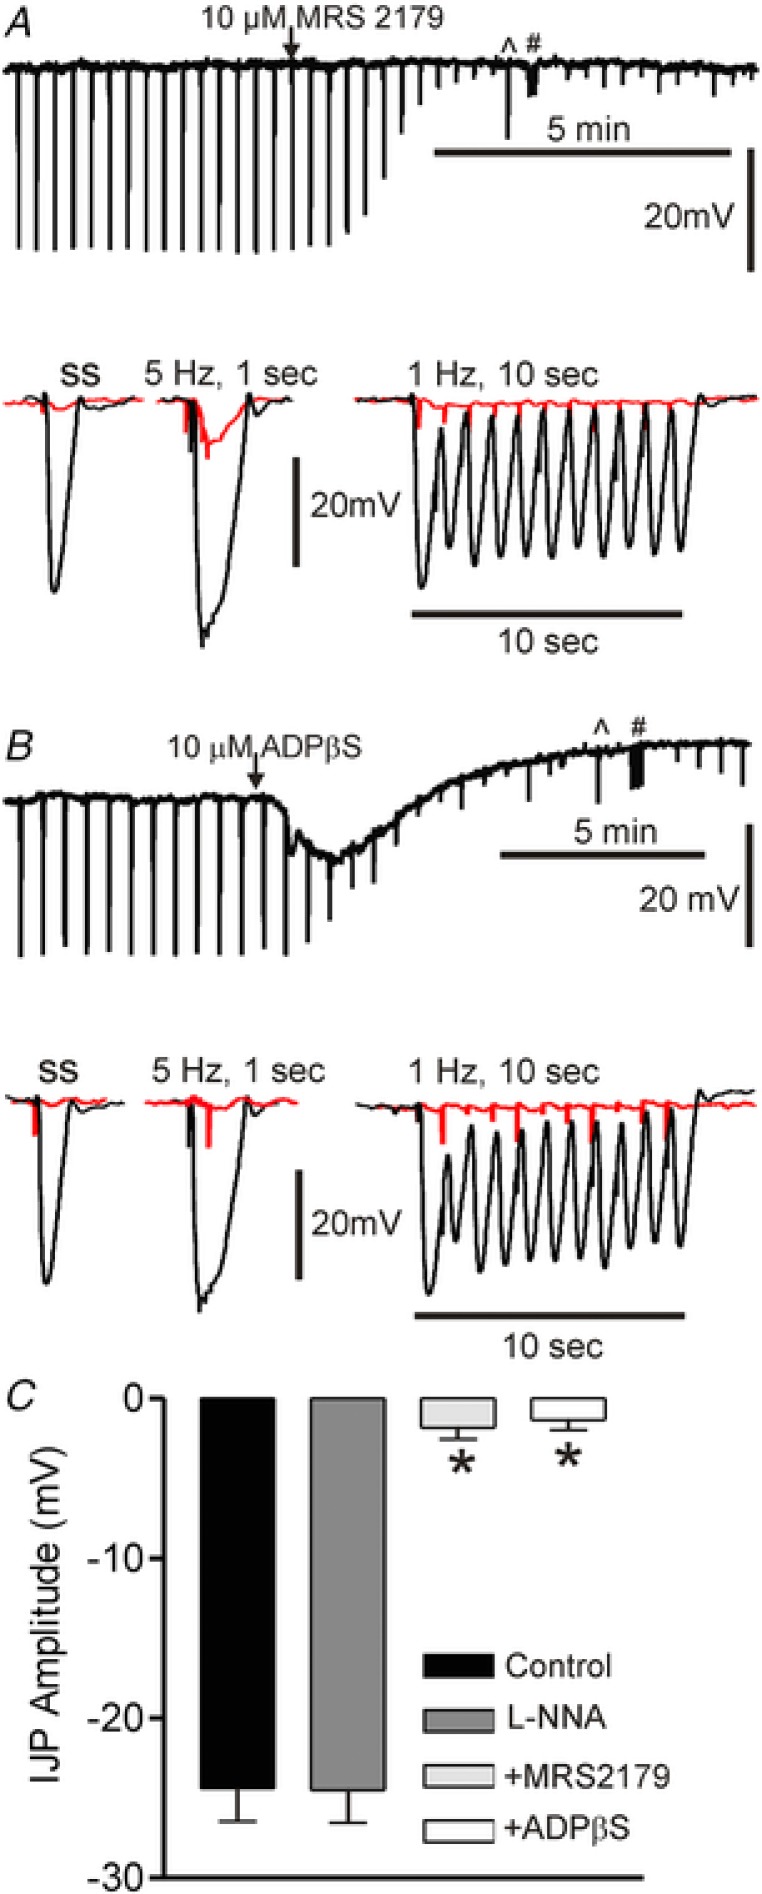
Upper traces in A and B show slow sweep speed recordings of IJPs elicited with single stimuli. ^ and # denote times at which the stimulus protocol was switched to 5 Hz for 1 s and 1 Hz for 10 s, respectively. At this sweep speed the downward deflections seen following blockade of the IJP are stimulus artifacts. Lower traces show IJPs at faster sweep speed in the absence (black) and presence (red) of purinergic antagonists. A, MRS2179 (10 μM) did not change membrane potential but blocked IJPs. B, ADPβS (10 μM) caused hyperpolarization followed by depolarization of membrane potential as well as blocking IJPs. C, bar graph summarizing IJP amplitude (single stimulus) under various conditions. Amplitude was not different in the absence (control, n = 9) or presence (n = 9) of l‐NNA (P > 0.05) but it was reduced by >90% (* P < 0.05) by either MRS2179 (n = 5) or ADPβS (n = 6). Shown are mean values ± SD.
To explore the role of potassium channels in the generation of IJPs, additional experiments were undertaken in which extracellular potassium concentration ([K+]o) was lowered from 5.9 mM to 1 mM in the IAS and rectum. Under these conditions there was a small (i.e. <5 mV) hyperpolarization of resting membrane potential in both muscles. The nitrergic IJP in the IAS was unchanged in the presence of low [K+]o (Fig. 6 A,C). However, low [K+]o had differing effects upon the components of the composite rectal IJP. Whereas the slow nitrergic component was unchanged in low [K+]o, the fast purinergic component was increased by ∼50% (Fig. 6 B,C). These data suggest that purinergic but not nitrergic IJPs are due to the opening of potassium channels.
Figure 6. Reduced extracellular potassium concentration ([K+]o) increases purinergic but not nitrergic IJP amplitude.
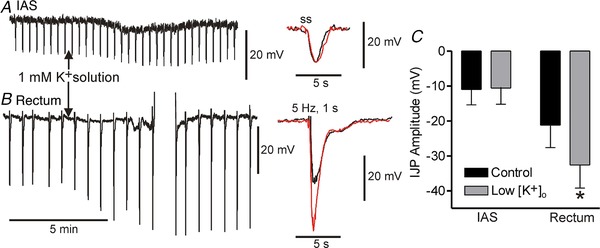
Left traces show slow sweep speed recordings of IJPs elicited with single stimuli (ss) in the IAS (A) and 5 Hz, 1 s EFS in rectum (B). A brief train (5 Hz, 1 s) was applied in rectum to better visualize both components of the composite IJP. The rectal recording was briefly lost and re‐established (upward deflections). Centre traces show faster sweep speed recordings of IJPs in 5.9 mM [K+]o (black) and 1 mM [K+]o (red). Nitrergic IJPs in the IAS (A) and rectum (B, slow component) were unchanged in low [K+]o whereas the fast rectal purinergic IJP increased by ∼50%. C, bar graph summarizing the effect of low [K+]o on peak IJP amplitude in the IAS (n = 4) and rectum (n = 4). The fast IJP amplitude was significantly increased (* P < 0.05) in rectum. Shown are mean values ± SD.
Protein and gene expression profiles in the IAS and rectum
Immunohistochemical experiments were undertaken to determine whether the cells mediating purinergic NMT in the GI tract, i.e. PDGFRα+ cells, are present in the Cynomolgus monkey rectoanal region. These cells were identified throughout the circular muscle layer of the IAS and rectum (Fig. 7 A,B). Although there was significant variation in PDGFRα+ cell morphology, the majority of cells in the IAS were branched in appearance whereas the majority of cells in the rectum were spindle shaped.
Figure 7. SK3 protein is detectable in PDGFRα+ cells but not in Kit+ cells.
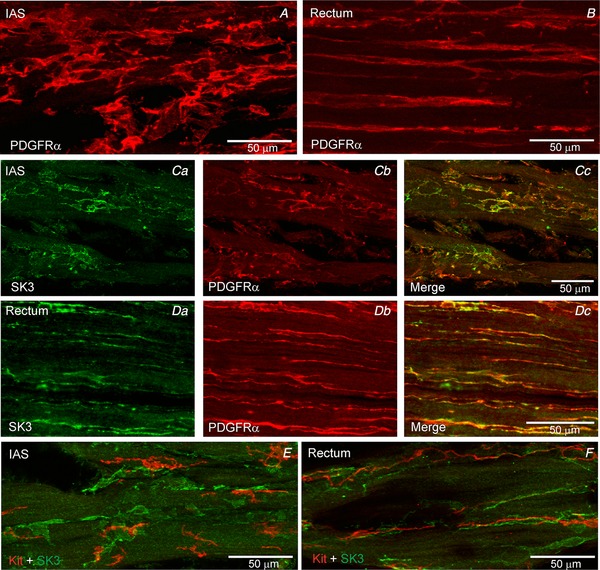
PDGFRα+ cells were identified in the IAS (A) and rectum (B). Dual labelling experiments revealed SK3 expression (green) in PDGFRα+ cells (red) in IAS (C) and rectum (D). In contrast, SK3 expression was not detected in Kit+ ICC (red) in the IAS (E) or rectum (F).
Dual labelling of PDGFRα and SK3 revealed that intramuscular PDGFRα+ cells in the IAS and rectum express SK3 (Fig. 7 C,D) whereas PDGFRα+ cells in the serosa and submucosa do not (data not shown). In contrast, dual labelling experiments with SK3 and Kit (to identify ICC) antibodies did not detect SK3 expression in Kit+ cells (Fig. 7 E,F). Because there are no highly specific antibodies available for immunohistochemical identification of P2Y1 receptors we did not examine the cellular expression pattern of this receptor.
Inhibitory motor neurons were identified in cryostat sections of the IAS and rectum by labelling with anti‐nNOS antibody. This antibody was selected because there are no specific labels available for purinergic neurons and because the relevant purines are thought to be released along with NO from the same neuron (Burnstock, 2009). As previously described (Cobine et al. 2010) nNOS+ nerves were identified in both muscles. Dual labelling for PDGFRα and nNOS revealed that PDGFRα+ cells were located in close proximity to nNOS+ nerves in both muscles (Fig. 8 A,B). Additional dual labelling experiments identified co‐localization of VIP in nNOS+ nerves in both muscles (Fig. 8 C,D).
Figure 8. nNOS+ nerves are closely aligned with PDGFRα+ cells in the IAS and rectum.
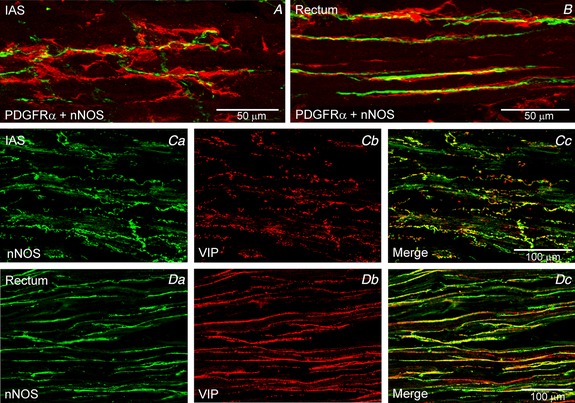
Dual labelling experiments revealed close association of PDGFRα+ cells (red) with nNOS+ nerves (green) in the IAS (A) and rectum (B). VIP and nNOS were co‐localized in most nerve fibres of the IAS (C) and rectum (D).
To further investigate the expression profile of components of the purinergic pathway we also examined the gene expression levels of PDGFRA (PDGFRα gene), KCNN1‐3 (SK1‐3 genes) and P2RY1, 2, 4, 6, 11–14 (P2Y1, 2, 4, 6, 11–14 receptor genes) in whole muscle strips of IAS and rectum (Fig. 9). KIT expression was included as a marker for ICC. There was no significant difference in the expression levels for PDGFRA, KIT and P2RY genes between the IAS and rectum whereas KCNN1 and KCNN3 levels were significantly (P < 0.05) greater in rectum (Fig. 9 A). P2RY1 expression levels were significantly (P < 0.05) greater than that of all other P2RY genes in both muscles (Fig. 9 B). P2RY11 was included in this analysis because there is evidence that this receptor is expressed in human (von Kugelgen & Wetter, 2000). However, negligible expression levels were detected for this gene in both muscles even after testing three different primer sets (see Methods and Table 2).
Figure 9. Comparison of gene expression levels for PDGFRA, KIT, KCNN1–3, and P2RY1, 2, 4, 6 and 11–14 in the IAS and rectum.
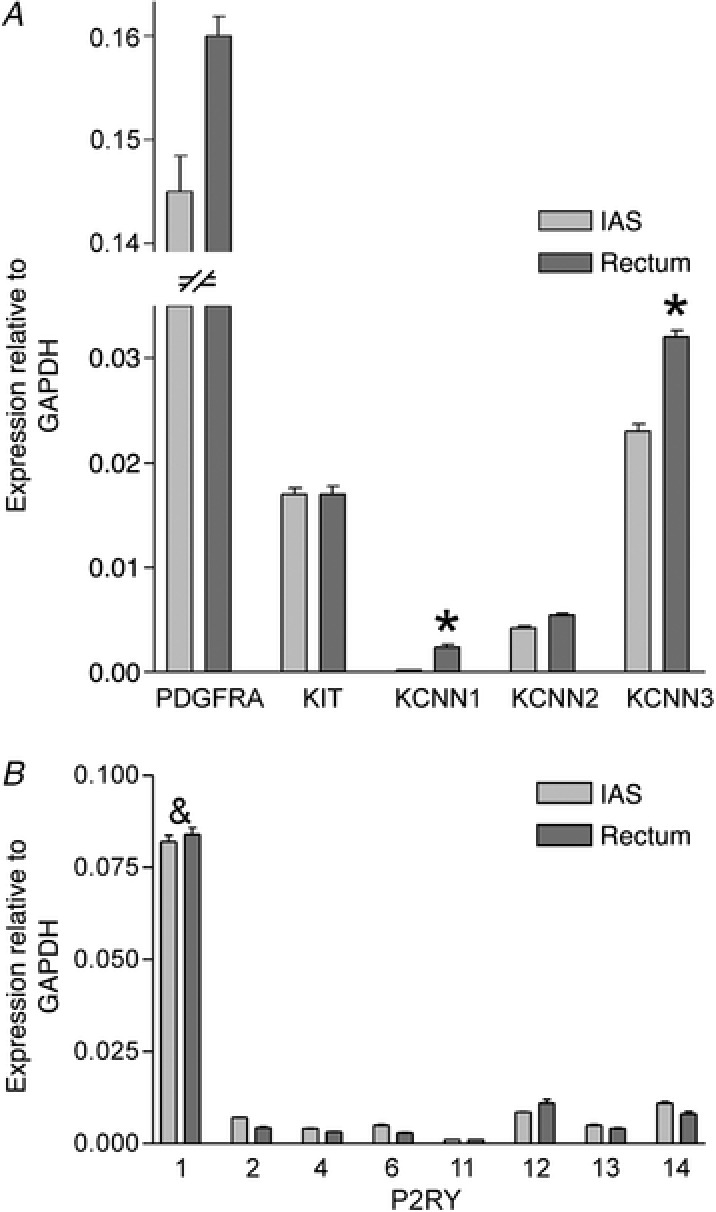
A, no significant difference (P > 0.05) was seen in the relative expression levels for PDGFRA, KIT and KCNN2 between muscles while expression of KCNN1 and KCNN3 in rectum was significantly greater than in the IAS (* P < 0.05, n = 4). B, P2RY1 expression levels were significantly greater (& P < 0.05, n = 4) than P2RY2, 4, 6 and 11–14 in the IAS and rectum but there were no significant differences (P > 0.05) in the expression level of each P2RY subtype between muscles. Gene expression levels were normalized to GAPDH. Shown are mean values ± SD.
Functional responses to inhibitors and activators of SK3 and P2Y1 in the IAS and rectum
The effects of SK channel inhibitors and activators were compared on spontaneous contractile activity in isolated strips of IAS and rectum. The non‐selective SK channel inhibitor apamin (1 μM) had minimal effect upon contractions in the IAS either in the presence or in the absence of neural blockade (Fig. 10 A). In contrast, apamin caused a large increase in contractile activity in the rectum regardless of whether inhibitory neural pathways were blocked (Fig. 10 B). The effect of apamin in the rectum consisted of an initial peak contraction followed by a lower amplitude contraction. Interestingly, there was significantly more tone in the presence of apamin than in its absence (i.e. contractile activity in rectum without blockers shifted from patterns I–II to patterns II–III and with blockers from patterns II–III to III–IV).
Figure 10. Comparison of the effect of apamin on spontaneous contractile activity in the IAS and rectum.
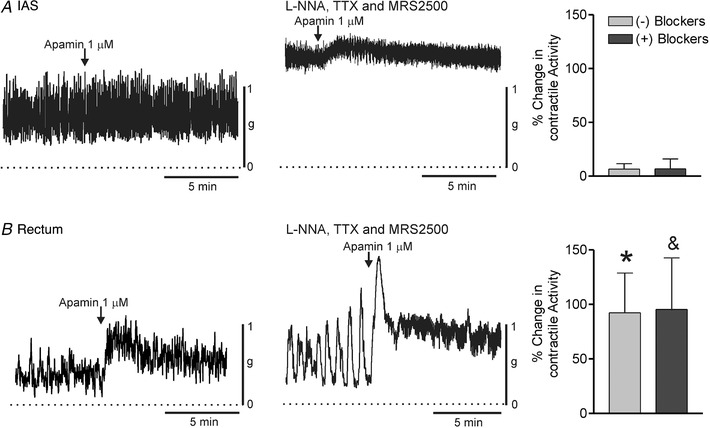
Sample traces showing the effect of apamin (1 μM) on contractile activity in the IAS (A) and rectum (B) in the absence (left traces) or presence (right traces) of blockers (l‐NNA 100 μM, TTX 1 μM, MRS2500 1 μM). Bar graphs at right summarize the effect of apamin on contractile activity ± blockers. Apamin had minimal effect upon contractile activity in the IAS in the absence (n = 5) or presence (n = 9) of blockers. In contrast, in rectum apamin approximately doubled contractile activity both in the absence (n = 6) and in the presence (n = 9) of blockers. These responses in rectum were significantly greater (P < 0.05) than in the IAS (*no blockers, &blockers). Shown are mean values ± SD.
The SK2/3 activator CyPPA (30 μM) caused contractile inhibition in IAS and rectum in the presence of neural blockade. However, these responses differed in that inhibition was ∼5‐fold faster in rectum than in the IAS (Fig 11 A–C). Because contractile activity in the IAS is predominantly tonic when NOS activity is blocked we also tested CyPPA in the absence of inhibitory neural blockade, i.e. conditions in which there is greater phasic activity and less tone (see Fig. 1). The time course of the CyPPA‐induced response was still slower under this condition (Fig. 11 C). We also evaluated whether contractile inhibition in the IAS was possibly slow because of a drug penetration issue by testing the CavL blocker nifedipine (1 μM, n = 9). Contractile inhibition with nifedipine was significantly faster than CyPPA in the IAS but not different from CyPPA in rectum (Fig. 11 C). Inhibitory responses to CyPPA in both muscles were abolished by apamin (1 μM) providing evidence that CyPPA activates SK2/3 channels (Fig. 11 D–F).
Figure 11. Comparison of the effect of CyPPA on contractile activity in the IAS and rectum.
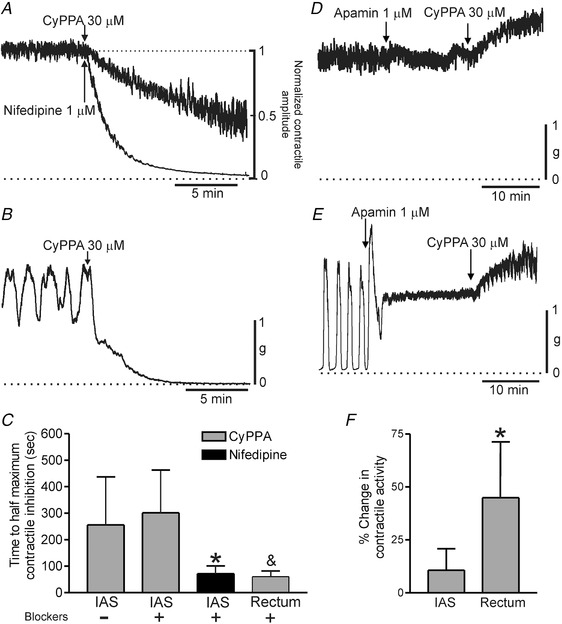
A, sample traces comparing the time course of contractile inhibition in the IAS following addition of CyPPA (30 μM) versus nifedipine (1 μM) applied at the arrow (traces normalized to one another). B, sample trace showing the time course of contractile inhibition with CyPPA in rectum. C, bar graph summarizing the mean time required to reach 50% contractile inhibition with CyPPA or nifedipine. The presence (+) or absence (–) of neural blockers (l‐NNA 100 μM, TTX 1 μM) is indicated. The time course of CyPPA inhibition ± neural blockers in the IAS (–, n = 6; +, n = 8) was not different (P > 0.05) whereas the response to nifedipine (n = 9) was significantly faster (* P < 0.05). The response to CyPPA in rectum (n = 5) was also more rapid than CyPPA in IAS (& P < 0.05) but not different from nifedipine in IAS (P > 0.05). D (IAS) and E (rectum), sample traces of the response to CyPPA in the presence of 1 μM apamin (added at least 15 min before CyPPA). In both muscles the inhibitory effects of CyPPA were replaced with an increase in contractile activity. F, bar graph summarizing the effect of CyPPA on contractile activity in the IAS (n = 6) and rectum (n = 5) in the presence of apamin. The contractile response to CyPPA in rectum was significantly (* P < 0.05) greater than in the IAS. Shown are mean values ± SD.
Because the purinergic pathway involves activation of P2Y1 receptors we also examined the contractile effects of the P2Y1 receptor activator MRS2365 (1 μM). In keeping with the purinergic pathway, MRS2365 inhibited contractile activity in the rectum (although a small contraction was also noted). This effect was abolished by MRS2500 (1 μM, Fig. 12 B). In contrast, MRS2365 gave rise to a small contraction in the IAS (Fig. 12 A). Interestingly, this effect was also blocked by MRS2500. Finally, we compared the effects of ADPβS (10 μM) in the IAS and rectum (Fig. 13). ADPβS activates P2Y receptors followed by their desensitization (Erb & Weisman, 2012). The contractile effects of ADPβS were similar to those of MRS2365 in the IAS (compare Fig. 13 A to Fig. 12 A). However, in rectum, ADPβS differed from MRS2365 in that MRS2500 blocked the small tonic contraction elicited with ADPβS but left contractile inhibition intact (compare Fig. 13 B to Fig. 12 B).
Figure 12. Comparison of the effect of MRS2365 on spontaneous contractile activity in the IAS and rectum.
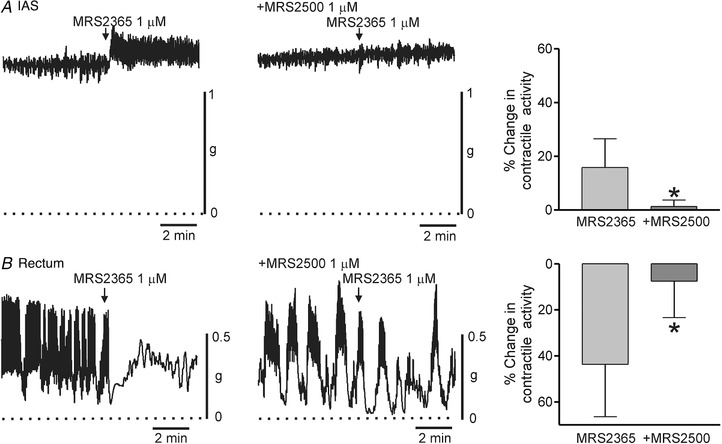
Sample traces show the changes in contractile activity following addition of MRS2365 (1 μM) to the IAS (A) and rectum (B) in the absence (left traces) and presence (right traces) of 1 μM MRS2500 (added at least 20 min before MRS2365) (l‐NNA 100 μM and TTX 1 μM present throughout). The dotted lines indicate zero active contraction. Bar graphs summarize the effect of MRS2365 on contractile activity in the IAS (A) and rectum (B) in the absence (n = 11, IAS; n = 13, rectum) and presence (n = 10, IAS; n = 6, rectum) of 1 μM MRS2500. MRS2365 contracted the IAS but reduced overall contractile activity in the rectum. Both effects were significantly reduced (* P < 0.05) by MRS2500. Shown are mean values ± SD.
Figure 13. Comparison of the effect of ADPβS on spontaneous contractile activity in the IAS and rectum.
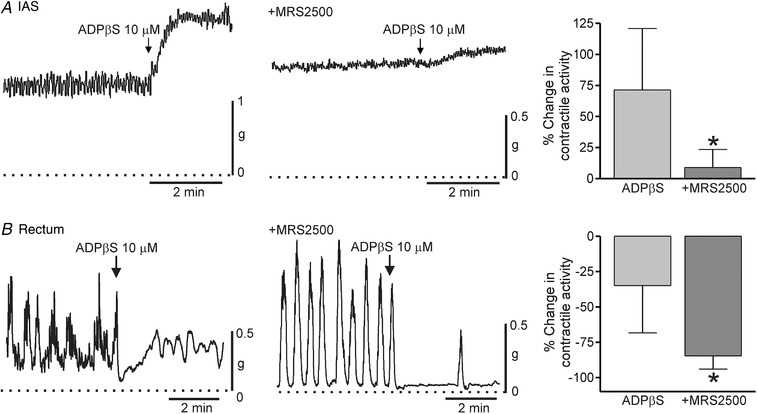
Sample traces show the changes in contractile activity following addition of ADPβS (10 μM) to the IAS (A) and rectum (B) in the absence (left traces) and presence (right traces) of 1 μM MRS2500 (added at least 20 min before ADPβS) (l‐NNA 100 μM and TTX 1 μM present throughout). The dotted lines indicate zero active contraction. Bar graphs summarize the effect of ADPβS on contractile activity in the IAS (A) and rectum (B) in the absence (n = 8, IAS; n = 6, rectum) and presence (n = 7, IAS; n = 5, rectum) of 1 μM MRS2500. ADPβS contracted the IAS but reduced overall contractile activity in the rectum. Excitation in the IAS was reduced (* P < 0.05) whereas contractile inhibition in rectum was increased (* P<0.05) by MRS2500. Shown are mean values ± SD.
Discussion
Inhibitory NMT was examined in the Cynomolgus monkey IAS and rectum, an animal with high gene sequence identity to humans. Nitrergic NMT was present in both muscles whereas purinergic NMT was limited to the rectum and VIPergic NMT was limited to the IAS. Our results suggest that purinergic NMT is absent in the IAS because of poor coupling between P2Y1 receptors and SK3 channels on PDGFRα+ cells.
Modulation of basal contractile activity in the IAS and rectum by ongoing neural release of NO and purines
The IAS and rectum each generated significant spontaneous contractile activity. However, there was no absolute distinction in the pattern of contractile activity between muscles as phasic contractions and tone were observed in both. For this reason we assigned contractile activity to four different categories in the Results (Pattern I–IV) with I being exclusively phasic and IV being exclusively tonic. Spontaneous contractile activity in the rectum varied between patterns I and II whereas the IAS varied between patterns II and III. Spontaneous contractile activity in both muscles was under strong tonic nitrergic inhibition that was relieved by blocking NOS activity with l‐NNA. NOS blockade resulted in a large increase in tone in the IAS (i.e. a shift from patterns II/III to patterns III/IV) as well as a decrease in phasic contractile amplitude (Fig. 1 A, present study and Cobine et al. 2007, 2010). NOS blockade also caused membrane depolarization in the IAS. Depolarization is predicted to increase calcium entry via CavL channel window current (Imaizumi et al. 1989; Langton & Standen, 1993; Fleischmann et al. 1994) leading to an increase in tone. NO may also cause direct inhibition of CavL via activation of cGMP‐dependent protein kinase (Keef et al. 2001; Zhu et al. 2005) that is relieved with NOS blockade. Microelectrode recordings from the monkey IAS performed in the absence of nifedipine have revealed slow waves that are reduced in amplitude with NOS blockade (Harvey et al. 2008). Thus, the changes that occur in contractile activity following NOS blockade in the IAS (i.e. increased tone and decreased phasic contractile amplitude) are consistent with the changes that occur in electrical activity (i.e. depolarization and reduced slow wave amplitude). NOS blockade also caused depolarization and an increase in tone in rectum (i.e. from patterns I/II to patterns II/III), although in this case phasic contractions were not reduced in amplitude. The differences noted in contractile activity between muscles as well as the shifts that follow NOS blockade are likely related to the more negative resting membrane potential of the rectum than IAS (present study; Mutafova‐Yambolieva et al. 2003; Hall et al. 2014) as well as differences in the nature of the phasic electrical events that underlie phasic contractile activity in these two muscles (Mutafova‐Yambolieva et al. 2003).
In contrast to NOS blockade, inhibition of purinergic NMT with P2Y1 receptor antagonists failed to increase spontaneous contractile activity in either muscle. In the IAS this outcome was likely due to the absence of purinergic NMT. On the other hand, a clearly defined purinergic component of NMT was observed in the rectum. The absence of an increase in contractile activity with P2Y1 receptor antagonists therefore suggests that background levels of purine release are not sufficient to produce overt suppression of basal contractile activity. This conclusion was further supported by the fact that P2Y1 receptor blockade did not depolarize resting membrane potential in monkey rectum. Nitrergic and purinergic NMT are also present in the rat colon and previous studies have noted similar differences in the effects of NOS versus purinergic blockade on membrane potential in this muscle (Gil et al. 2010).
Inhibitory neuromuscular transmission in the IAS and rectum
Inhibition of NOS with l‐NNA significantly reduced EFS‐induced contractile inhibition in the IAS (1 and 5 Hz) and rectum (1 Hz), indicating the presence of functional nitrergic NMT in both regions. The lack of an effect of l‐NNA on the 5 Hz response in rectum was not due to the absence of nitrergic NMT at this frequency. Rather, it was likely due to the non‐additive nature of neural pathways (i.e. purinergic and nitrergic) that each hyperpolarize membrane potential below the mechanical threshold, as previously discussed for the mouse IAS (Duffy et al. 2012; Keef et al. 2013). Significant EFS‐induced contractile inhibition persisted in both muscles following NOS blockade. However, the pathway(s) underlying these NOS‐independent responses differed between muscles. In rectum, the remaining response was abolished by P2Y1 receptor antagonists. Thus, inhibitory NMT in rectum consisted of nitrergic and purinergic pathways. In contrast, the NOS‐independent response in IAS was unchanged by P2Y1 receptor antagonists and apamin, indicating the presence of an additional inhibitory pathway.
The NOS and purinergic‐independent response in IAS developed slowly and persisted well beyond the end of the stimulus train, i.e. features that we have previously described for VIPergic NMT in the mouse IAS (Keef et al. 2013). To examine the possible contribution of VIPergic NMT in the monkey IAS we tested α‐chymotrypsin, a proteolytic enzyme that preferentially cleaves peptides such as VIP at tyrosine residues (Mule & Serio, 2003). α‐Chymotrypsin did not significantly reduce the control response to 5 Hz EFS in the IAS, providing evidence that this enzyme does not indiscriminately inhibit neural pathways. These data also suggest that nitrergic NMT can inhibit contraction to the same extent in either the presence or the absence of peptidergic NMT, again revealing conditions under which different neural pathways are non‐additive. In contrast, when α‐chymotrypsin was tested in the presence of l‐NNA, the remaining 5 Hz EFS response was reduced by 60%, suggesting that this slowest component of NMT is due to VIP. However, a possible role for pituitary adenylate cyclase activating peptide (PACAP) cannot be discounted.
Interestingly, the human lower oesophageal sphincter shares a number of features in common with the monkey IAS including tone generation, robust nitrergic NMT, minimal purinergic NMT and a significant NOS and purinergic‐independent pathway. Like the monkey IAS, this latter pathway was blocked by α‐chymotrypsin, leading the authors to propose a role for VIPergic NMT (Lecea et al. 2011). Thus, in both of these sphincters, nitrergic NMT appears to work in concert with VIPergic NMT to inhibit contractile activity. In contrast, purinergic NMT often plays a more prominent role in phasic GI muscles that are involved in the mixing and propulsion of luminal contents (e.g. intestine; Gallego et al. 2016).
Although a VIPergic component was identified in the IAS, all inhibitory NMT in the rectum was abolished by combined l‐NNA and MRS2500. The absence of this third neural pathway in rectum is not due the absence of VIP in inhibitory motor neurons because VIP was co‐localized with NOS in intramuscular neurons in both the IAS and rectum. This result is not surprising as co‐localization of NOS and VIP in enteric neurons has previously been described for GI muscles from the oesophagus to the IAS in human, Rhesus monkey, guinea‐pig, rat and mouse (Costa et al. 1992; Aimi et al. 1993; Pimont et al. 2003; Brehmer et al. 2006; Noorian et al. 2011; Kuramoto et al. 2013; Keef et al. 2013). We also found that a low concentration of VIP (30 nM) caused >80% contractile inhibition in both IAS and rectum. Thus, the limited role of VIPergic NMT in the rectum cannot be attributed to a lack of receptors or second messenger pathways for VIP. The question of why VIPergic NMT plays a greater role in some GI regions than in others is a topic to be addressed in future studies focused exclusively on this pathway.
The electrical events accompanying EFS also differed between muscles. In the rectum a single stimulus elicited an IJP that reached maximum hyperpolarization ∼3 times faster than in the IAS (i.e. time to peak of 0.5 s vs. 1.4 s), commensurate with the terms ‘fast’ purinergic IJP and ‘slow’ nitrergic IJP. Furthermore the amplitude of the fast IJP in rectum was unchanged following NOS blockade whereas the slow IJP in the IAS was abolished. Thus, both contractile and electrical measurements identified nitrergic but not purinergic NMT in the IAS. In contrast, EFS gave rise to composite IJPs in the rectum that included a larger, faster purinergic component and a smaller, slower nitrergic component. The purinergic component was abolished by the P2Y1 antagonist and by desensitization of P2Y receptors with ADPβS while the nitrergic component was abolished by l‐NNA. The properties described here for composite IJPs in monkey rectum are similar to those described in other non‐sphincteric muscles (Keef et al. 1993; Serio et al. 1996; Gallego et al. 2014) and in the IAS of rodents (Rae & Muir, 1996; Opazo et al. 2011; Duffy et al. 2012). On the other hand, this is the first study to characterize IJPs in a primate IAS and to show that stimulus parameters that elicit composite IJPs in the rectum generate only nitrergic IJPs in the IAS. Although an ultraslow non‐nitrergic and non‐purinergic component was identified in the IAS with contractile measurements, the short duration protocols used for measuring IJPs (i.e. 1–10 s) precluded characterizing the underlying ultraslow IJP.
Fast purinergic IJPs in other GI muscles are inhibited by the SK channel blocker apamin, indicating an important role for potassium channels in these events (Sanders, 2016). Indeed, purinergic contractile inhibition was also abolished by apamin in the monkey rectum (present study). To further examine the role of potassium channels in the generation of IJPs in the monkey IAS and rectum we reduced extracellular potassium concentration ([K+]o) from 5.9 mM to 1 mM. This manoeuvre increases the potassium equilibrium potential from −80 mV to −124 mV (assuming intracellular [K+] = 140 mM) resulting in a 55% increase in the driving force for potassium efflux. Lowering [K+]o in this manner increased the amplitude of the rectal fast IJP by ∼50%, providing additional support for the importance of potassium channels in this event. However, lowering [K+]o did not increase the slow nitrergic IJP in either the IAS or rectum, suggesting that some other ionic conductance is involved. Early studies proposed that nitrergic IJPs were due to the closing of chloride channels (Crist et al. 1991; Zhang & Paterson, 2002; Hirst et al. 2004). ICC‐IM are known to play an important role as mediators of nitrergic NMT (Ward & Sanders, 2006) and more recent studies have shown that these cells have high expression levels of the calcium‐activated chloride channel ANO1 (Gomez‐Pinilla et al. 2009; Hwang et al. 2009; Cobine et al. 2017). Thus the nitrergic IJPs we observe in the monkey IAS may be due to NO‐mediated inhibition of ANO1 in ICC‐IM. Additional studies are needed to further explore this hypothesis.
Gene and protein expression profiles in the IAS and rectum
The gene expression levels for various subtypes of P2Y receptors and SK channels were compared in the IAS and rectum with qPCR. Markers for PDGFRα+ cells and ICC (i.e. PDGFRA and KIT) were also included to confirm their presence in samples. There were no significant differences in the expression profile for PDGFRA, KIT and P2Y receptor subtypes (P2RY1, 2, 4, 6, 11–14) between muscles. P2YR1 expression was much greater than that of other P2Y receptor subtypes while P2RY11 expression levels were negligible. The high expression of P2RY1 in rectum is in keeping with the central role played by this receptor in purinergic NMT. However, the relevance of P2RY1 expression in the IAS is less clear. Interestingly, there were small differences in the expression levels for SK channels between muscles, with KCNN1 and KCNN3 being significantly greater in rectum than in the IAS.
Immunohistochemical studies identified intramuscular PDGFRα+ cells in both muscles that were SK3+. PDGFRα+ cells were also closely associated with nNOS+ neurons in both muscles. Thus both the anatomical features and the gene expression profile anticipated for purinergic NMT (Kurahashi et al. 2011) were present in rectum. The surprising outcome of this study was that very similar features were present in the IAS even though purinergic NMT was absent. Because inhibitory motor neurons release multiple neurotransmitters (e.g. NO, purines, VIP) the close association between PDGFRα+ cells and nNOS+ neurons in the IAS is likely related to a non‐purinergic pathway. For example, PDGFRα+ cells in several GI muscles (including the mouse IAS) have high expression levels of the NO receptor guanylyl cyclase (Cobine et al. 2014) although a functional role for PDGFRα+ cells in nitrergic NMT has yet to be determined. Another possibility is that PDGFRα+ cells contribute to VIPergic NMT in the IAS as the cells mediating VIPergic NMT remain unclear. Towards this end, it is interesting to note that VIPR2 gene expression in the mouse colon is greatest in PDGFRα+ cells followed by smooth muscle cells and then ICC (Ha et al. 2017; Lee et al. 2017, 2015).
There were also significant differences in the morphology of PDGFRα+ cells in the IAS versus rectum, i.e. most intramuscular PDGFRα+ cells in rectum were long spindle‐shaped cells whereas those in the IAS were more branched in appearance. Similar differences exist in the morphology of intramuscular ICC (ICC‐IM) in the monkey IAS and rectum and we have proposed that ICC‐IM in the IAS serve as pacemaker cells whereas those in the rectum do not (Cobine et al. 2010). Thus, both ICC‐IM as well as intramuscular PDGFRα+ cells may serve different functional roles in the monkey IAS than they do in rectum.
Responses to activators and inhibitors of SK3 and P2Y1 in the IAS and rectum
The results described above indicate that the structural components of the purinergic pathway are similar in the IAS and rectum. However, additional functional studies revealed important differences between muscles. The non‐selective SK channel antagonist apamin initially doubled contractile activity in rectum, either in the absence or in the presence of neural blockade. Interestingly, apamin also increased the amount of tone in rectum, shifting contractile activity from patterns I/II to II/III (absence of neural blockers) or from II/III to III/IV (presence of neural blockers). Apamin has been reported to cause membrane depolarization in some GI muscles (e.g. McDonnell et al. 2008; Gil et al. 2010). Thus, it is possible that apamin, like NOS blockade, increased tone in rectum via membrane depolarization.
The fact that apamin still significantly increased contractile activity in rectum following neural blockade suggests that there is significant basal SK channel activity that is independent of neural input. In support of this conclusion are previous patch clamp studies of PDGFRα+ cells from the mouse colon describing spontaneous transient outward currents (STOCs) mediated by SK3 channels (Kurahashi et al. 2011). In contrast to rectum, apamin caused minimal change in contractile activity in the IAS regardless of whether contraction was purely tonic or some combination of phasic activity along with diminished tone (i.e. ±neural blockade). Thus, the very limited effect of apamin was not simply due to tonic contracture. Nor was it due to a contractile ceiling effect as spontaneous contractile amplitude in the IAS was always less than 50% of maximum. These data all suggest that there is minimal spontaneous SK channel activity in the IAS. Because PDGFRα+ cells highly express SK3 channels (Fig. 7) these data further suggest that there must be significant differences between muscles in how SK3 channels on PDGFRα+ cells are regulated.
The SK2/3 channel activator CyPPA (Hougaard et al. 2007) inhibited contraction in both muscles that was blocked by apamin. However, contractile inhibition was five times slower in the IAS than in rectum. As described above for apamin, CyPPA inhibition in the IAS was slow regardless of whether contraction was purely tonic or some combination of phasic activity along with diminished tone (i.e. ±neural blockade). The slow time course of CyPPA in the IAS was also unlikely to be due to a drug penetration issue as a different exogenous drug (i.e. nifedipine) caused a much faster response. Thus, spontaneous SK channel activity as well as the ease with which SK channels can be recruited with CyPPA are both greater in rectum than in the IAS.
A very important additional observation made was that activating P2Y1 receptors with MRS2365 caused contractile inhibition in the rectum whereas it enhanced contraction in the IAS. As both effects of MRS2365 were blocked by the P2Y1 receptor antagonist MRS2500, this suggests that both were due to P2Y1 receptors. These data strongly suggest that activation of P2Y1 receptors in the IAS is not linked to activation of SK3 channels.
Purinergic NMT is the fastest inhibitory neural pathway in the GI tract, i.e. a single stimulus can generate a maximum amplitude IJP that reaches peak hyperpolarization in less than 1 s. Our observations that (1) SK3 channels are not spontaneously active in the IAS, (2) SK3 channels require substantially greater time to activate with CyPPA in the IAS and (3) SK3 channels are not activated by stimulation of P2Y1 receptors with MRS2365 in the IAS all suggest poor coupling between SK3 channels in the IAS and the established pathways that activate them. Differences in the quantity of purines released from nerves in the IAS and rectum might also contribute to the inconsistency in purinergic NMT. However, even if purine release is the same, the post‐junctional differences described here are sufficient to explain the lack of purinergic NMT in the IAS.
The non‐selective P2Y activator ADPβS was also included in this study because it has previously been shown to abolish purinergic IJPs in other GI muscles (Xue et al. 1999; Serio et al. 2003; Gallego et al. 2006, 2008; McDonnell et al. 2008). ADPβS is a stable analogue of ADP that initially activates P2Y receptors followed by their desensitization (Poole et al. 1993). The transient hyperpolarization observed with ADPβS in rectum was likely due to this agonist activity while the subsequent loss of IJPs reflects receptor desensitization. The contractile effects of ADPβS were similar to those of MRS2365, i.e. ADPβS contracted the IAS and inhibited contraction in rectum.
Although ADPβS and MRS2365 each reduced overall contractile activity in rectum, a small tonic contraction was also noted that was abolished by MRS2500. Indeed, MRS2500 also blocked the contraction evoked with ADPβS in the IAS. This contraction may be related to the coupling of P2Y1 receptors to the G‐protein Gq (von Kugelgen & Hoffmann, 2016) followed by calcium release from the endoplasmic reticulum. Indeed, P2Y1 receptor‐mediated contraction has also been reported for a few other smooth muscles (Mutafova‐Yambolieva et al. 2000; Buvinic et al. 2006). However, unlike MRS2365, the contractile inhibition initiated with ADPβS in rectum was not reduced by MRS2500. Our gene expression studies identified several other P2Y receptor subtypes (i.e. P2RY12‐14, Fig. 9) that are coupled to Gi/o rather than Gq. Furthermore P2Y12 and P2Y13 receptors are known to be activated by ADP (von Kugelgen & Harden, 2011). Thus, P2Y1‐independent contractile inhibition in rectum may be due to one or more of these other P2Y receptors. In spite of the differences noted here for MRS2365 versus ADPβS in rectum it is important to recognize that neither MRS2365 nor ADPβS caused contractile inhibition in the IAS, underlining the significant differences in P2Y‐mediated responses in the IAS versus rectum.
Differences in inhibitory NMT in the rectoanal region
Nitrergic NMT is present in the IAS of the monkey and human IAS while purinergic NMT is absent from the monkey IAS (present study) and the available evidence suggests that it is also absent from the human IAS (O'Kelly et al. 1993). In contrast, the rectum exhibits both nitrergic and purinergic NMT (present study). The physiological benefit of this arrangement is unclear. It is possible that the differences in purinergic NMT relate to the functional role of the IAS in maintaining high resting anal pressure through tone development. In rectum, where purinergic NMT is present, SK3 channels cause ongoing suppression of contractile activity that is blocked by apamin. The absence of a similar SK3 channel dampening effect in the IAS may therefore aid in maintaining high tonic contracture. It is of interest that spontaneous contractile activity is also unchanged by apamin in the human and opossum lower oesophageal sphincter (Zhang et al. 2000; Gonzalez et al. 2004). A second possible reason for differences in inhibitory NMT between muscles relates to the mechanisms by which purinergic, nitrergic and VIPergic NMT cause contractile inhibition. All three hyperpolarize membrane potential leading to the closure of CavL channels. However, NO and VIP also affect second messenger pathways (cGMP/cAMP) that decrease myosin light chain 20 (MLC20) phosphorylation, resulting in decreased myofilament sensitization (Nakamura et al. 2007; Khromov et al. 2012). Because there is greater myofilament sensitization in the IAS than in non‐sphincter muscles [e.g. rectum (Patel & Rattan, 2006; Rattan & Singh, 2012)], nitrergic NMT in combination with VIPergic NMT may be better suited to inhibiting IAS contraction whereas nitrergic NMT in combination with purinergic NMT is better suited to the phasically active rectum. A final possible reason for differences in inhibitory NMT relates to differences in excitatory motor innervation, i.e. sympathetic to the monkey IAS and cholinergic to the rectum (Cobine et al. 2010). Sympathetic nerves release noradrenaline as well as purines (Burnstock, 2013) and purines significantly contribute to sympathetic motor responses in some smooth muscles (Rohde et al. 1986). Thus, limiting purinergic NMT in the IAS might alleviate potential conflicts arising from purines serving as both excitatory and inhibitory neurotransmitters.
Differences in inhibitory NMT in the IAS of primates versus rodents
Although purinergic NMT is present in the IAS of rodents (Rae & Muir, 1996; Opazo et al. 2011; Duffy et al. 2012) it is absent from the monkey and human IAS (present study; O'Kelly et al. 1993). In vivo anal pressure in rodents is also lower than in primates [i.e. 15–21 mmHg in the mouse (Stebbing, 1998; de Lorijn et al. 2005; De Godoy & Rattan, 2006) vs. 75–90 mmHg in humans (Cheeney et al. 2012; Noelting et al. 2012)] and in vitro spontaneous contractile amplitude is less [i.e. ∼24% maximum contraction in the mouse IAS (Duffy et al. 2012) vs. ∼43% for monkey (present study)]. Finally, whereas excitatory motor innervation to the monkey and human IAS is sympathetic (Brading & Ramalingam, 2006; Cobine et al. 2007, 2010) in the mouse and rabbit IAS it is cholinergic (Cobine et al. 2007; Duffy et al. 2012). Thus, there are significant differences in the functional properties of the rodent and primate IAS. There are also differences in the nature of defecation in pellet makers (such as mice and rats) vs. more social animals such as primates and humans who retain faeces over longer periods of time. Taken together, it is clear that the rodent model is sufficient to characterize some but not all aspects of primate IAS function.
Summary
Significant differences were observed in the nature of inhibitory NMT in the Cynomolgus monkey IAS and rectum, an animal with high gene sequence identity to humans. While nitrergic NMT was present in both the IAS and rectum, purinergic NMT was limited to the rectum and VIPergic NMT to the IAS. Thus, the profile for inhibitory NMT in monkey IAS is closer to that of humans than rodents. By comparing the mediators of purinergic NMT in the IAS and rectum we conclude that purinergic NMT is absent from the IAS because of poor coupling between P2Y1 receptors and SK3 channels on PDGFRα+ cells. Differences in inhibitory and excitatory NMT between regions likely work in concert to achieve effective neural control of motor activity in these functionally distinct regions.
Additional information
Competing interests
The authors of this study have no competing interests. All experiments were carried out in the laboratory of Dr K. D. Keef.
Author contributions
CAC, KDK: Concept and design of experiments. Collecting, analysis and interpretation of data. Drafting the article. MM, RJB: Collection, analysis and interpretation of microelectrode data. KIH: Collection, analysis and interpretation of contractile data. All authors have approved the final version of the manuscript and agree to be accountable for all aspects of the work, and to ensure that questions related to the accuracy or integrity of any part of the work are appropriately investigated and resolved. All persons designated as authors qualify for authorship, and all those who qualify for authorship are listed.
Funding
Grant funding DK078736 to KDK and CAC. Support for the Zeiss LSM510 confocal microscope was provided by NCRR 1 S10 RR16871.
Acknowledgements
We would like to extend our sincere appreciation to Charles River Preclinical Services for their generous donation of monkey rectoanal samples, Nancy Horowitz for retrieval of muscles, Yulia Bayguinov for assistance with immunohistochemistry, Emer Ní Bhraonain for assistance with contractile experiments, Lauren O'Kane for assistance with qPCR and Violeta Mutafova‐Yambolieva for critical evaluation of the manuscript.
Biography
Caroline A. Cobine received her PhD in Cell and Molecular Pharmacology and Physiology from the University of Nevada, Reno, USA, in 2011, where she now holds the position of Assistant Professor in the Department of Physiology and Cell Biology. Her research investigates the signalling mechanisms that control the function of smooth muscle and other cell types (e.g. interstitial cells of Cajal and PDGFRα+ cells) in the gastrointestinal tract, specifically the anorectal region. In particular, she is focusing on the inhibitory and excitatory neuromuscular transmission in the internal anal sphincter (IAS) and rectum as well as the pathways underlying tone generation within the IAS.

Edited by: Kim Barrett & Weifang Rong
References
- Aimi Y, Kimura H, Kinoshita T, Minami Y, Fujimura M & Vincent SR (1993). Histochemical localization of nitric oxide synthase in rat enteric nervous system. Neuroscience 53, 553–560. [DOI] [PubMed] [Google Scholar]
- Baker SA, Hennig GW, Salter AK, Kurahashi M, Ward SM & Sanders KM (2013). Distribution and Ca2+ signalling of fibroblast‐like (PDGFR+) cells in the murine gastric fundus. J Physiol 591, 6193–6208. [DOI] [PMC free article] [PubMed] [Google Scholar]
- Biancani P, Walsh J & Behar J (1985). Vasoactive intestinal peptide: a neurotransmitter for relaxation of the rabbit internal anal sphincter. Gastroenterology 89, 867–874. [DOI] [PubMed] [Google Scholar]
- Brading AF & Ramalingam T (2006). Mechanisms controlling normal defecation and the potential effects of spinal cord injury. Prog Brain Res 152, 345–358. [DOI] [PubMed] [Google Scholar]
- Brehmer A, Schrodl F & Neuhuber W (2006). Morphology of VIP/nNOS‐immunoreactive myenteric neurons in the human gut. Histochem Cell Biol 125, 557–565. [DOI] [PubMed] [Google Scholar]
- Burns AJ, Lomax AE, Torihashi S, Sanders KM & Ward SM (1996). Interstitial cells of Cajal mediate inhibitory neurotransmission in the stomach. Proc Natl Acad Sci U S A 93, 12008–12013. [DOI] [PMC free article] [PubMed] [Google Scholar]
- Burnstock G (2009). Purinergic cotransmission. Exp Physiol 94, 20–24. [DOI] [PubMed] [Google Scholar]
- Burnstock G (2013). Introduction and perspective, historical note. Front Cell Neurosci 7, 227. [DOI] [PMC free article] [PubMed] [Google Scholar]
- Burnstock G, Campbell G, Satchell D & Smythe A (1970). Evidence that adenosine triphosphate or a related nucleotide is the transmitter substance released by non‐adrenergic inhibitory nerves in the gut. Br J Pharmacol 40, 668–688. [DOI] [PMC free article] [PubMed] [Google Scholar]
- Buvinic S, Poblete MI, Donoso MV, Delpiano AM, Briones R, Miranda R & Huidobro‐Toro JP (2006). P2Y1 and P2Y2 receptor distribution varies along the human placental vascular tree: role of nucleotides in vascular tone regulation. J Physiol 573, 427–443. [DOI] [PMC free article] [PubMed] [Google Scholar]
- Cheeney G, Nguyen M, Valestin J & Rao SS (2012). Topographic and manometric characterization of the recto‐anal inhibitory reflex. Neurogastroenterol Motil 24, e147–e154. [DOI] [PMC free article] [PubMed] [Google Scholar]
- Cobine CA, Fong M, Hamilton R & Keef KD (2007). Species dependent differences in the actions of sympathetic nerves and noradrenaline in the internal anal sphincter. Neurogastroenterol Motil 19, 937–945. [DOI] [PubMed] [Google Scholar]
- Cobine CA, Hannah EE, Zhu MH, Lyle HE, Rock JR, Sanders KM, Ward SM & Keef KD (2017). ANO1 in intramuscular interstitial cells of Cajal plays a key role in the generation of slow waves and tone in the internal anal sphincter. J Physiol 595, 2021–2041. [DOI] [PMC free article] [PubMed] [Google Scholar]
- Cobine CA, Hennig GW, Bayguinov YR, Hatton WJ, Ward SM & Keef KD (2010). Interstitial cells of Cajal in the cynomolgus monkey rectoanal region and their relationship to sympathetic and nitrergic nerves. Am J Physiol Gastrointest Liver Physiol 298, G643–G656. [DOI] [PMC free article] [PubMed] [Google Scholar]
- Cobine CA, Hennig GW, Kurahashi M, Sanders KM, Ward SM & Keef KD (2011). Relationship between interstitial cells of Cajal, fibroblast‐like cells and inhibitory motor nerves in the internal anal sphincter. Cell Tissue Res 344, 17–30. [DOI] [PMC free article] [PubMed] [Google Scholar]
- Cobine CA, Sotherton AG, Peri LE, Sanders KM, Ward SM & Keef KD (2014). Nitrergic neuromuscular transmission in the mouse internal anal sphincter is accomplished by multiple pathways and post‐junctional effector cells. Am J Physiol Gastrointest Liver Physiol 307, G1057–G1072. [DOI] [PMC free article] [PubMed] [Google Scholar]
- Costa M, Furness JB, Pompolo S, Brookes SJ, Bornstein JC, Bredt DS & Snyder SH (1992). Projections and chemical coding of neurons with immunoreactivity for nitric oxide synthase in the guinea‐pig small intestine. Neurosci Lett 148, 121–125. [DOI] [PubMed] [Google Scholar]
- Crist JR, He XD & Goyal RK (1991). Choloride‐mediated junction potentials in circular muscle of the guinea pig ileum. Am J Physiol 261, G742–G751. [DOI] [PubMed] [Google Scholar]
- De Godoy MA & Rattan S (2006). Angiotensin‐converting enzyme and angiotensin II receptor subtype 1 inhibitors restitute hypertensive internal anal sphincter in the spontaneously hypertensive rats. J Pharmacol Exp Ther 318, 725–734. [DOI] [PubMed] [Google Scholar]
- de Lorijn F, de Jonge WJ, Wedel T, Vanderwinden JM, Benninga MA & Boeckxstaens GE (2005). Interstitial cells of Cajal are involved in the afferent limb of the rectoanal inhibitory reflex. Gut 54, 1107–1113. [DOI] [PMC free article] [PubMed] [Google Scholar]
- De Luca A, Li CG & Rand MJ (1999). Nitrergic and purinergic mechanisms and their interactions for relaxation of the rat internal anal sphincter. J Auton Pharmacol 19, 29–37. [DOI] [PubMed] [Google Scholar]
- Duffy AM, Cobine CA & Keef KD (2012). Changes in neuromuscular transmission in the W/Wv mouse internal anal sphincter. Neurogastroenterol Motil 24, e41‐e55. [DOI] [PMC free article] [PubMed] [Google Scholar]
- Durnin L, Hwang SJ, Kurahashi M, Drumm BT, Ward SM, Sasse KC, Sanders KM & Mutafova‐Yambolieva VN (2014). Uridine adenosine tetraphosphate is a novel neurogenic P2Y1 receptor activator in the gut. Proc Natl Acad Sci U S A 111, 15821–15826. [DOI] [PMC free article] [PubMed] [Google Scholar]
- Durnin L, Hwang SJ, Ward SM, Sanders KM & Mutafova‐Yambolieva VN (2012). Adenosine 5‐diphosphate‐ribose is a neural regulator in primate and murine large intestine along with β‐NAD+ . J Physiol 590, 1921–1941. [DOI] [PMC free article] [PubMed] [Google Scholar]
- Erb L & Weisman GA (2012). Coupling of P2Y receptors to G proteins and other signaling pathways. Wiley Interdiscip Rev Membr Transp Signal 1, 789–803. [DOI] [PMC free article] [PubMed] [Google Scholar]
- Fleischmann BK, Murray RK & Kotlikoff MI (1994). Voltage window for sustained elevation of cytosolic calcium in smooth muscle cells. Proc Natl Acad Sci U S A 91, 11914–11918. [DOI] [PMC free article] [PubMed] [Google Scholar]
- Gallego D, Hernandez P, Clave P & Jimenez M (2006). P2Y1 receptors mediate inhibitory purinergic neuromuscular transmission in the human colon. Am J Physiol Gastrointest Liver Physiol 291, G584–G594. [DOI] [PubMed] [Google Scholar]
- Gallego D, Malagelada C, Accarino A, De GR, Malagelada JR, Azpiroz F & Jimenez M (2014). Nitrergic and purinergic mechanisms evoke inhibitory neuromuscular transmission in the human small intestine. Neurogastroenterol Motil 26, 419–429. [DOI] [PubMed] [Google Scholar]
- Gallego D, Mane N, Gil V, Martinez‐Cutillas M & Jimenez M (2016). Mechanisms responsible for neuromuscular relaxation in the gastrointestinal tract. Rev Esp Enferm Dig 108, 721–731. [DOI] [PubMed] [Google Scholar]
- Gallego D, Vanden Berghe P, Farre R, Tack J & Jimenez M (2008). P2Y1 receptors mediate inhibitory neuromuscular transmission and enteric neuronal activation in small intestine. Neurogastroenterol Motil 20, 159–168. [DOI] [PubMed] [Google Scholar]
- Gil V, Gallego D, Grasa L, Martin MT & Jimenez M (2010). Purinergic and nitrergic neuromuscular transmission mediates spontaneous neuronal activity in the rat colon. Am J Physiol Gastrointest Liver Physiol 299, G158–G169. [DOI] [PubMed] [Google Scholar]
- Gillespie JS, Liu XR & Martin W (1989). The effects of L‐arginine and NG‐monomethyl L‐arginine on the response of the rat anococcygeus muscle to NANC nerve stimulation. Br J Pharmacol 98, 1080–1082. [DOI] [PMC free article] [PubMed] [Google Scholar]
- Gomez‐Pinilla PJ, Gibbons SJ, Bardsley MR, Lorincz A, Pozo MJ, Pasricha PJ, Van de Rijn M, West RB, Sarr MG, Kendrick ML, Cima RR, Dozois EJ, Larson DW, Ordog T & Farrugia G (2009). Ano1 is a selective marker of interstitial cells of Cajal in the human and mouse gastrointestinal tract. Am J Physiol Gastrointest Liver Physiol 296, G1370–G1381. [DOI] [PMC free article] [PubMed] [Google Scholar]
- Gonzalez AA, Farre R & Clave P (2004). Different responsiveness of excitatory and inhibitory enteric motor neurons in the human esophagus to electrical field stimulation and to nicotine. Am J Physiol Gastrointest Liver Physiol 287, G299–G306. [DOI] [PubMed] [Google Scholar]
- Grundy D (2015). Principles and standards for reporting animal experiments in The Journal of Physiology and Experimental Physiology . J Physiol 593, 2547–2549. [DOI] [PMC free article] [PubMed] [Google Scholar]
- Ha SE, Lee MY, Kurahashi M, Wei L, Jorgensen BG, Park C, Park PJ, Redelman D, Sasse KC, Becker LS, Sanders KM & Ro S (2017). Transcriptome analysis of PDGFRα+ cells identifies T‐type Ca2+ channel CACNA1G as a new pathological marker for PDGFRα+ cell hyperplasia. PLoS One 12, e0182265. [DOI] [PMC free article] [PubMed] [Google Scholar]
- Hall KA, Ward SM, Cobine CA & Keef KD (2014). Spatial organization and coordination of slow waves in the mouse anorectum. J Physiol 592, 3813–3829. [DOI] [PMC free article] [PubMed] [Google Scholar]
- Harvey N, McDonnell B, McKechnie M & Keef K. (2008). Role of L‐type calcium channels, membrane potential and nitric oxide in the control of myogenic activity in the primate internal anal sphincter. Gastroenterology 134, A63. [Google Scholar]
- Hirst GD, Bywater RA, Teramoto N & Edwards FR (2004). An analysis of inhibitory junction potentials in the guinea‐pig proximal colon. J Physiol 558, 841–855. [DOI] [PMC free article] [PubMed] [Google Scholar]
- Horiguchi K & Komuro T (2000). Ultrastructural observations of fibroblast‐like cells forming gap junctions in the W/Wnu mouse small intestine. J Auton Nerv Syst 80, 142–147. [DOI] [PubMed] [Google Scholar]
- Hougaard C, Eriksen BL, Jorgensen S, Johansen TH, Dyhring T, Madsen LS, Strobaek D & Christophersen P (2007). Selective positive modulation of the SK3 and SK2 subtypes of small conductance Ca2+‐activated K+ channels. Br J Pharmacol 151, 655–665. [DOI] [PMC free article] [PubMed] [Google Scholar]
- Hwang SJ, Blair PJ, Britton FC, O'Driscoll KE, Hennig G, Bayguinov YR, Rock JR, Harfe BD, Sanders KM & Ward SM (2009). Expression of anoctamin 1/TMEM16A by interstitial cells of Cajal is fundamental for slow wave activity in gastrointestinal muscles. J Physiol 587, 4887–4904. [DOI] [PMC free article] [PubMed] [Google Scholar]
- Hwang SJ, Durnin L, Dwyer L, Rhee PL, Ward SM, Koh SD, Sanders KM & Mutafova‐Yambolieva VN (2011). β‐Nicotinamide adenine dinucleotide is an enteric inhibitory neurotransmitter in human and nonhuman primate colons. Gastroenterology 140, 608–617. [DOI] [PMC free article] [PubMed] [Google Scholar]
- Imaizumi Y, Muraki K, Takeda M & Watanabe M (1989). Measurement and simulation of noninactivating Ca current in smooth muscle cells. Am J Physiol Cell Physiol 256, C880–C885. [DOI] [PubMed] [Google Scholar]
- Keef KD, Du C, Ward SM, McGregor B & Sanders KM (1993). Enteric inhibitory neural regulation of human colonic circular muscle: role of nitric oxide. Gastroenterology 105, 1009–1016. [DOI] [PubMed] [Google Scholar]
- Keef KD, Hume JR & Zhong J (2001). Regulation of cardiac and smooth muscle Ca2+ channels (CaV1.2a,b) by protein kinases. Am J Physiol Cell Physiol 281, C1743–C1756. [DOI] [PubMed] [Google Scholar]
- Keef KD, Saxton SN, McDowall RA, Kaminski RE, Duffy AM & Cobine CA (2013). Functional role of vasoactive intestinal polypeptide in inhibitory motor innervation in the mouse internal anal sphincter. J Physiol 591, 1489–1506. [DOI] [PMC free article] [PubMed] [Google Scholar]
- Keef K, Kaminski R, McDowall R, Duffy A & Cobine CA. (2011). Peptidergic inhibitory neuromuscular transmission in the mouse internal anal sphincter. Neurogastroenterol Motil 23, 49. [DOI] [PMC free article] [PubMed] [Google Scholar]
- Khromov AS, Momotani K, Jin L, Artamonov MV, Shannon J, Eto M & Somlyo AV (2012). Molecular mechanism of telokin‐mediated disinhibition of myosin light chain phosphatase and cAMP/cGMP‐induced relaxation of gastrointestinal smooth muscle. J Biol Chem 287, 20975–20985. [DOI] [PMC free article] [PubMed] [Google Scholar]
- Kurahashi M, Mutafova‐Yambolieva V, Koh SD & Sanders KM (2014). Platelet‐derived growth factor receptor α‐positive cells and not smooth muscle cells mediate purinergic hyperpolarization in murine colonic muscles. Am J Physiol Cell Physiol 307, C561–C570. [DOI] [PMC free article] [PubMed] [Google Scholar]
- Kurahashi M, Nakano Y, Hennig GW, Ward SM & Sanders KM (2012). Platelet‐derived growth factor receptor α‐positive cells in the tunica muscularis of human colon. J Cell Mol Med 16, 1397–1404. [DOI] [PMC free article] [PubMed] [Google Scholar]
- Kurahashi M, Zheng H, Dwyer L, Ward SM, Koh SD & Sanders KM (2011). A functional role for the ‘fibroblast‐like cells’ in gastrointestinal smooth muscles. J Physiol 589, 697–710. [DOI] [PMC free article] [PubMed] [Google Scholar]
- Kuramoto H, Kadowaki M & Yoshida N (2013). Morphological demonstration of a vagal inhibitory pathway to the lower esophageal sphincter via nitrergic neurons in the rat esophagus. Neurogastroenterol Motil 25, e485–e494. [DOI] [PubMed] [Google Scholar]
- Langton PD & Standen NB (1993). Calcium currents elicited by voltage steps and steady voltages in myocytes isolated from the rat basilar artery. J Physiol 469, 535–548. [DOI] [PMC free article] [PubMed] [Google Scholar]
- Lecea B, Gallego D, Farre R, Opazo A, Auli M, Jimenez M & Clave P (2011). Regional functional specialization and inhibitory nitrergic and nonnitrergic coneurotransmission in the human esophagus. Am J Physiol Gastrointest Liver Physiol 300, G782–G794. [DOI] [PubMed] [Google Scholar]
- Lee MY, Ha SE, Park C, Park PJ, Fuchs R, Wei L, Jorgensen BG, Redelman D, Ward SM, Sanders KM & Ro S (2017). Transcriptome of interstitial cells of Cajal reveals unique and selective gene signatures. PLoS One 12, e0176031. [DOI] [PMC free article] [PubMed] [Google Scholar]
- Lee MY, Park C, Berent RM, Park PJ, Fuchs R, Syn H, Chin A, Townsend J, Benson CC, Redelman D, Shen TW, Park JK, Miano JM, Sanders KM & Ro S (2015). Smooth muscle cell genome browser: enabling the identification of novel serum response factor target genes. PLoS One 10, e0133751. [DOI] [PMC free article] [PubMed] [Google Scholar]
- Li CG & Rand MJ (1989). Evidence for a role of nitric oxide in the neurotransmitter system mediating relaxation of the rat anococcygeus muscle. Clin Exp Pharmacol Physiol 16, 933–938. [DOI] [PubMed] [Google Scholar]
- McDonnell B, Hamilton R, Fong M, Ward SM & Keef KD (2008). Functional evidence for purinergic inhibitory neuromuscular transmission in the mouse internal anal sphincter. Am J Physiol Gastrointest Liver Physiol 294, G1041–G1051. [DOI] [PubMed] [Google Scholar]
- Mule F & Serio R (2003). NANC inhibitory neurotransmission in mouse isolated stomach: involvement of nitric oxide, ATP and vasoactive intestinal polypeptide. Br J Pharmacol 140, 431–437. [DOI] [PMC free article] [PubMed] [Google Scholar]
- Mutafova‐Yambolieva VN, Carolan BM, Harden TK & Keef KD (2000). Multiple P2Y receptors mediate contraction in guinea pig mesenteric vein. Gen Pharmacol 34, 127–136. [DOI] [PubMed] [Google Scholar]
- Mutafova‐Yambolieva VN, Hwang SJ, Hao X, Chen H, Zhu MX, Wood JD, Ward SM & Sanders KM (2007). β‐Nicotinamide adenine dinucleotide is an inhibitory neurotransmitter in visceral smooth muscle. Proc Natl Acad Sci U S A 104, 16359–16364. [DOI] [PMC free article] [PubMed] [Google Scholar]
- Mutafova‐Yambolieva VN, O'Driscoll K, Farrelly A, Ward SM & Keef KD (2003). Spatial localization and properties of pacemaker potentials in the canine rectoanal region. Am J Physiol Gastrointest Liver Physiol 284, G748–G755. [DOI] [PubMed] [Google Scholar]
- Nakamura K, Koga Y, Sakai H, Homma K & Ikebe M (2007). cGMP‐dependent relaxation of smooth muscle is coupled with the change in the phosphorylation of myosin phosphatase. Circ Res 101, 712–722. [DOI] [PubMed] [Google Scholar]
- Noelting J, Ratuapli SK, Bharucha AE, Harvey DM, Ravi K & Zinsmeister AR (2012). Normal values for high‐resolution anorectal manometry in healthy women: effects of age and significance of rectoanal gradient. Am J Gastroenterol. 107, 1530–1536. [DOI] [PMC free article] [PubMed] [Google Scholar]
- Noorian AR, Taylor GM, Annerino DM & Greene JG (2011). Neurochemical phenotypes of myenteric neurons in the rhesus monkey. J Comp Neurol 519, 3387–3401. [DOI] [PMC free article] [PubMed] [Google Scholar]
- Nurko S & Rattan S (1988). Role of vasoactive intestinal polypeptide in the internal anal sphincter relaxation of the opossum. J Clin Invest 81, 1146–1153. [DOI] [PMC free article] [PubMed] [Google Scholar]
- O'Kelly T, Brading A & Mortensen N (1993). Nerve mediated relaxation of the human internal anal sphincter: the role of nitric oxide. Gut 34, 689–693. [DOI] [PMC free article] [PubMed] [Google Scholar]
- Opazo A, Lecea B, Gil V, Jimenez M, Clave P & Gallego D (2011). Specific and complementary roles for nitric oxide and ATP in the inhibitory motor pathways to rat internal anal sphincter. Neurogastroenterol Motil 23, e11–e25. [DOI] [PubMed] [Google Scholar]
- Patel CA & Rattan S (2006). Spontaneously tonic smooth muscle has characteristically higher levels of RhoA/ROK compared with the phasic smooth muscle. Am J Physiol Gastrointest Liver Physiol 291, G830–G837. [DOI] [PubMed] [Google Scholar]
- Pimont S, Bruley D, V, Le Neel JC , Aubert P, Galmiche JP & Neunlist M (2003). Neurochemical coding of myenteric neurones in the human gastric fundus. Neurogastroenterol Motil 15, 655–662. [DOI] [PubMed] [Google Scholar]
- Poole AW, Heath MF & Evans RJ (1993). ADP induces desensitisation of equine platelet aggregation responses: studies using ADPβS, a stable analogue of ADP. Res Vet Sci 54, 235–243. [DOI] [PubMed] [Google Scholar]
- Rae MG & Muir TC (1996). Neuronal mediators of inhibitory junction potentials and relaxation in the guinea‐pig internal anal sphincter. J Physiol 493, 517–527. [DOI] [PMC free article] [PubMed] [Google Scholar]
- Rattan S (2005). The internal anal sphincter: regulation of smooth muscle tone and relaxation. Neurogastroenterol Motil 17, 50–59. [DOI] [PubMed] [Google Scholar]
- Rattan S, Regan RF, Patel CA & De Godoy MA (2005). Nitric oxide not carbon monoxide mediates nonadrenergic noncholinergic relaxation in the murine internal anal sphincter. Gastroenterology 129, 1954–1966. [DOI] [PubMed] [Google Scholar]
- Rattan S & Singh J (2012). RhoA/ROCK pathway is the major molecular determinant of basal tone in intact human internal anal sphincter. Am J Physiol Gastrointest Liver Physiol 302, G664–G675. [DOI] [PMC free article] [PubMed] [Google Scholar]
- Rohde GC, Venezian E & Huidobro‐Toro JP (1986). Asymmetric distribution of purinergic and adrenergic neurotransmission cooperates in the motor activity along the rat vas deferens. Neurosci Lett 71, 197–202. [DOI] [PubMed] [Google Scholar]
- Sanders KM (2016). Enteric inhibitory neurotransmission, starting down under. Adv Exp Med Biol 891, 21–29. [DOI] [PMC free article] [PubMed] [Google Scholar]
- Sanders KM, Ward SM & Koh SD (2014). Interstitial cells: regulators of smooth muscle function. Physiol Rev 94, 859–907. [DOI] [PMC free article] [PubMed] [Google Scholar]
- Serio R, Alessandro M, Zizzo MG, Tamburello MP & Mule F (2003). Neurotransmitters involved in the fast inhibitory junction potentials in mouse distal colon. Eur J Pharmacol 460, 183–190. [DOI] [PubMed] [Google Scholar]
- Serio R, Mule F, Postorino A, Vetri T & Bonvissuto F (1996). Apamin‐sensitive and ‐insensitive components of inhibitory junction potentials in rat caecum: role of nitric oxide. J Auton Pharmacol 16, 183–189. [DOI] [PubMed] [Google Scholar]
- Stebbing JF (1998). Nitric oxide synthase neurones and neuromuscular behaviour of the anorectum. Ann R Coll Surg Engl 80, 137–145. [PMC free article] [PubMed] [Google Scholar]
- Tichenor SD, Buxton IL, Johnson P, O'Driscoll K & Keef KD (2002). Excitatory motor innervation in the canine rectoanal region: role of changing receptor populations. Br J Pharmacol 137, 1321–1329. [DOI] [PMC free article] [PubMed] [Google Scholar]
- von Kugelgen I & Harden TK (2011). Molecular pharmacology, physiology, and structure of the P2Y receptors. Adv Pharmacol 61, 373–415. [DOI] [PubMed] [Google Scholar]
- von Kugelgen I & Hoffmann K (2016). Pharmacology and structure of P2Y receptors. Neuropharmacology 104, 50–61. [DOI] [PubMed] [Google Scholar]
- von Kugelgen I & Wetter A (2000). Molecular pharmacology of P2Y‐receptors. Naunyn Schmiedebergs Arch Pharmacol 362, 310–323. [DOI] [PubMed] [Google Scholar]
- Ward SM & Sanders KM (2006). Involvement of intramuscular interstitial cells of Cajal in neuroeffector transmission in the gastrointestinal tract. J Physiol 576, 675–682. [DOI] [PMC free article] [PubMed] [Google Scholar]
- Xue L, Farrugia G, Sarr MG & Szurszewski JH (1999). ATP is a mediator of the fast inhibitory junction potential in human jejunal circular smooth muscle. Am J Physiol 276, G1373–G1379. [DOI] [PubMed] [Google Scholar]
- Zhang Y, Miller DV & Paterson WG (2000). Opposing roles of K+ and Cl– channels in maintenance of opossum lower esophageal sphincter tone. Am J Physiol Gastrointest Liver Physiol 279, G1226–G1234. [DOI] [PubMed] [Google Scholar]
- Zhang Y & Paterson WG (2002). Role of Ca2+‐activated Cl– channels and MLCK in slow IJP in opossum esophageal smooth muscle. Am J Physiol Gastrointest Liver Physiol 283, G104–G114. [DOI] [PubMed] [Google Scholar]
- Zhu HL, Hirst GD, Ito Y & Teramoto N (2005). Modulation of voltage‐dependent Ba2+ currents in the guinea‐pig gastric antrum by cyclic nucleotide‐dependent pathways. Br J Pharmacol 146, 129–138. [DOI] [PMC free article] [PubMed] [Google Scholar]