Abstract
Background
The purpose of our study was to investigate the correlation between tumor volume (TV) and each subtype of thymic epithelial tumors (TETs) based on the World Health Organization (WHO) classification and Masaoka staging.
Methods
Sixty-one consecutive patients (45 thymomas and 16 thymic carcinomas) were studied. All were classified according to Masaoka staging: 31 non-invasive TETs (stage I) and 30 invasive TETs (8 stage II, 11 stage III, 3 stage IVa, and 8 stage IVb). TV on computed tomography (CT) were semi-automatically calculated using our software. The correlation of TV with each WHO subtype and Masaoka staging was analyzed using Mann-Whitney U and Scheffe’s F test.
Results
Thymic carcinoma (mean ± SD, 117.5±143.6 cm3) was significantly larger than thymoma (53.4±78.4 cm3) (P=0.0016). Stage IVb tumor (190.8±156.8 cm3) was significantly larger than stage I (33.1±42.6 cm3) (P<0.05). Invasive TETs were significantly larger than non-invasive TETs (P=0.0016). TV >54.3 cm3 indicated invasive TETs.
Conclusions
TV of invasive TETs may be larger at the time of initial presentation. TV >54.3 cm3 indicates invasive TETs.
Keywords: Thymic epithelial tumor (TET), tumor volume (TV), multi-detector computed tomography, World Health Organization (WHO), Masaoka-Koga stage
Introduction
Thymic epithelial tumors (TETs), known as thymoma and thymic carcinoma, are the most common primary neoplasms of the anterior mediastinum. They have a broad spectrum of biological and morphological features. The World Health Organization (WHO) classification (1) based on the morphology of the epithelial cells and ratio of the lymphocytes to epithelial cells is the most widely used classification of thymomas and thymic carcinomas. In the 2015 WHO classification, TETs were classified into two major categories; six subtypes of thymomas (type A, atypical type A variant, AB, B1, B2, and B3) and thymic carcinomas (2,3). It has been reported that the WHO histological classification reflects both the clinical and the functional features of TET and is useful for preoperative diagnosis and selection of treatment strategy in patients with TET (3-5). There are no randomized clinical trials that provide definitive guidance for the management of TETs. However, National Comprehensive Cancer Network (NCCN) (6) and International Thymic Malignancy Interesting Group (ITMIG) (7) indicates treatment options for TETs. Their consensus is that non-invasive TETs (stage I) can be treated with surgery alone, with no adjuvant therapy. Invasive TETs and residual TETs are recommended radiation and/or chemotherapy given as adjuvant therapy. Locally advanced TETs (stage III), solitary metastasis or ipsilateral metastasis (stages IVa) are indicated neoadjuvant therapy. TETs with evidence of extrathoracic metastases are recommended chemotherapy.
Many studies have reported that TETs have characteristic computed tomography (CT) findings (8-18). To our knowledge, however, there has been few reports (17,19) assessing the relationship between tumor volume (TV) on CT and each subtype. Our hypothesis is that, the more malignant the TET, the larger its TV is. At present, there are very few accepted software to accurately measure volume of TETs. In this study, we developed a software for volume measurement of TETs by modifying a commercially available software, WatchinGGO (LISIT, Co., Ltd., Tokyo, Japan). The software, which could measure the volume of a ground glass opacity of the lung using thin-slice CT, was modified to measure the volume of a mediastinal tumor. The purpose of our study was to investigate the correlation between TV and each subtype of TETs based on the WHO classification and Masaoka staging (20).
Methods
Patients
We obtained approval from our internal Institutional Review Board. Informed consent was waived for retrospective review of patient records and images. The study population initially consisted of 67 consecutive patients [27 men and 40 women; mean age ± SD, 59±14 years, range, 27–81 years] who underwent thymectomy (51 patients) or biopsy (12 patients) for pathologically proven TET at our hospital from January 2010 to December 2013. All patients underwent CT examination. Although almost of them had the CT image with a slice thickness <1 mm, four patients had the CT images with a slice thickness >5 mm. The four patients were excluded because the software program was not enabled to calculate TV. Two tumors could not be classified based on the Masaoka staging because their pathology slides were not available for confirmation of the diagnosis. Finally, 61 patients with TET were included in our study. Pre-operative or pre-bioptic thin-section chest CT scans were available for review.
Pathology
Specimens were classified into six subtypes and thymic carcinoma by an experienced pathologist on the basis of the 2015 WHO classification of the 4th edition (1): type A, atypical type A variant, AB, B1, B2, and B3, which were classified according to the morphology of epithelial cells and on the lymphocyte-to-epithelial cell ratio. The 4th edition of WHO classification proposed by Travis et al. added the delineation of an atypical type A thymoma variant from conventional type A thymomas. This atypical type can show hyper cellularity, increased mitotic activity, and necrosis, resulting in the correlation with advanced stage, including metastasis, recurrence, and death. Thymic carcinomas exhibit morphology similar to malignant neoplasms arising from other organs besides the thymus. All non-organotypic malignant epithelial neoplasms other than germ cell tumors were designated thymic carcinomas in the WHO classification system in 2015. Moreover, all tumors other than atypical type A were classified into 3 subgroups: low-risk thymomas (types A, AB, and B1), high-risk thymomas (types B2 and B3) and thymic carcinoma, as described by Jeong et al. (2). Since atypical type A variant thymomas were new additions in the 2015 WHO classification, they were not shown in Jeong’s report (2) on the basis of 2004 WHO classification (21). In this study, since type A variant thymomas were not included in this study, this type was excluded in the statistical analysis.
Scanning protocols
Chest CT scans were acquired using a 64-detector row CT scanner: n=50, CT750HD, (General Electric Medical Systems, Milwaukee, WI, USA); n=8, Light Speed VCT (General Electric Medical Systems); and n=3, Aquilion ONE (Toshiba Medical Systems, Otawara, Japan). Acquisition parameters were as follows: collimation was 0.625 or 0.5 mm, pitch was 0.828–1.375, the rotation time was 0.4–0.5 second per rotation, exposure parameters were automatic selection of the milliampere setting, and the field of view was 345 mm. CT images of the entire thorax were obtained with a slice thickness of 0.5–0.625 mm and 60 seconds after contrast material (IOHEXOL with an iodine content of 300 mg/cc; Daiichi Sankyo Company, Limited, Tokyo, Japan) injection. Contrast volume was determined by weight (2 mL/kg).
TV measurement
Thin-section chest CT was scanned in all cases, and pre-operative or pre-bioptic CT images were reviewed retrospectively. Volumetric measurements were semi-automatically obtained using a modified commercially available software (LISIT, Co., Ltd., Tokyo, Japan) by two chest radiologists. The radiologists’ role in the volumetric measurement was to select the tumor and to roughly trace the tumor with a cursor on only one CT slice. The calculation method of TV (22) is shown in Figure 1. Image post processing and analysis were performed by a chest radiologist with 6 years of experience and measurements were performed twice by the same radiologist. The second measurement was performed 1 month after the first in order to assess intra-observer variability. We analyzed the average TV of the first and second measurements.
Figure 1.
Software for volume measurement of the tumor. (A) All TETs were roughly outlined on CT images by a radiologist. The images of tumors were automatically chosen by level set of image segmentation method (22). (B) Roughly outlined images of the tumor which includes surrounding tissues are reconstructed three-dimensionally. (C) Subsequently, surrounding tissues were excluded from the 3D shape of the tumor and CT tumor volumes were calculated. Each operation was semi-automatically done using a modified commercially available software WatchinGGO (LISIT, Co., Ltd). TETs, thymic epithelial tumors.
CT phantom study
Phantom study was performed to evaluate the accuracy of TV measurement using a software. The phantom used for this study was the commercially available thoracic CT phantom (N-1; Kyoto Kagaku Co., Ltd., Kyoto, Japan) (Figure 2A). We used two spherical nodules composed of urethane resin and hydroxyapatite with a density of +100 Hounsfield units and diameters of 8 and 12 mm. We calculated the assumed volume of each nodules from the formula V = (4/3)πr3. Moreover, we used two other ready-made acrylic nodules to investigate larger size or different shape. The diameters and volumes of each two ready-made nodule were measured in advance. One is acrylic spheres with 20.2 mm diameters and 4.4 cm3 volumes, the other is acrylic irregularly 3D shaped with 26.7 mm diameters and 3.5 cm3 volumes. These four simulated nodules were attached to the phantom at anterior mediastinum. Each nodule was scanned with the same parameters as those of the examinations of patient’s mediastinum. These four simulated nodules are shown in Figure2B and the CT image of a simulated nodule is shown in Figure 2C.
Figure 2.
A phantom study to evaluate the accuracy of TV measurement using a software. (A) The commercially thoracic CT phantom (N-1; Kyoto Kagaku Co., Ltd, Kyoto, Japan). (B) Four patterns of simulated nodules. The smaller two nodules are composed of urethane resin and hydroxyapatite and larger ones are composed of acryl. The diameters are 8, 12, 20.2, 26.7 mm. The volumes are 0.268, 0.905, 4.4, 3.5 cm3. (C) An example of CT image from a pulmonary nodule with 12 mm diameter. The simulated nodule was located in the anterior mediastinum of the phantom.
Assessment of Inter-observer agreement
Two independent chest radiologists (YS and AH, with 6 and 3 years of experience, respectively) performed manual segmentation of the 61 TETs. These observers were blinded for the result of volume measurement.
Statistical analysis
Mann-Whitney U test was used to compare thymoma with thymic carcinoma and non-invasive TET with invasive tumor. Scheffe’s F test was used to compare the following groups: (I) among each subtype of thymoma (types A, AB, B1, B2, and B3) and thymic carcinoma; (II) among low-risk thymoma, high-risk thymoma, and thymic carcinoma; and (III) among each Masaoka staging (stages I–IV). A P value of less than 0.05 was considered significant. Receiver operating characteristic (ROC) analysis was used to determine a cutoff value of the TV for predicting the invasive TET. Repeatability of the TV measurement technique was assessed by Bland and Altman’s method (23,24). Inter-observer agreement was assessed by intraclass correlation coefficients (ICCs) (ICC <0.40, poor agreement; ≥0.40 and <0.60, moderate agreement; ≥0.60 and <0.80, substantial agreement; and ≥0.80, excellent agreement) (25) and by the Bland-Altman method (23,24). All statistical analyses were performed using commercially available software (MedCalc Version 8.0.0.1, Frank Schoonjans, Mariakerke, Belgium).
Results
Fundamental data
Fundamental data were summarized in Table 1. Forty-five patients with thymoma were included: 28 patients with low-risk thymoma (2 patients with type A, 13 with type AB, and 13 with type B1); and 17 patients with high-risk thymoma (11 patients with type B2, and 6 with type B3). Both type A thymomas in this study were not atypical type A variants because they had no necrosis and mitotic activity in pathological specimens. Sixteen patients with thymic carcinomas were included: 15 squamous cell carcinomas and 1 mucoepidermoid carcinoma.
Table1. Distribution of patients with thymic epithelial tumors according to the World Health Organization histologic classification and Masaoka staging.
| Thymic epithelial tumor (n=61) | Number |
|---|---|
| WHO classification | |
| Low-risk thymoma (n=28) | |
| Type A | 2 |
| Type AB | 13 |
| Type B1 | 13 |
| High-risk thymoma (n=17) | |
| Type B2 | 11 |
| Type B3 | 6 |
| Thymic carcinoma (n=16) | 16 |
| Masaoka staging | |
| Non-invasive (n=31) | |
| Stage I | 31 |
| Invasive (n=30) | |
| Stage II | 8 |
| Stage III | 11 |
| Stage IVa | 3 |
| Stage IVb | 8 |
Masaoka staging was performed on the basis of the pathological findings or clinical imaging. The presence and extent of transcapsular invasion into adjacent mediastinal tissues were determined by surgical findings and confirmed on microscopic examination. Radiologic examination (e.g., CT, MRI, and PET-CT) showed macroscopic invasion into neighboring organs, pleural or pericardial dissemination, metastasis. The study included 31 patients with non-invasive thymoma (correlated to stage I) and 30 with invasive thymoma (8 patients with stage II, 11 patients with stage III, 3 patients with stage IVa, and 8 patients with stage IVb). The site of metastasis with stage IVb were mainly lymph node or lung (4 patients with lymph node, 3 patients with lung, 1 patient with lung and abdominal wall). Eleven patients had myasthenia gravis, 1 patient had rheumatoid arthritis, and 1 patient had systemic sclerosis.
Software accuracy
In the phantom study, the software calculated the volume of two spherical nodules composed of urethane resin and hydroxyapatite nodules (8 and 12 mm diameters) and of two ready-made acrylic nodules (spheres with 20.2 mm diameters and irregularly 3D shaped with 26.7 mm diameters). The calculated volumes (0.28, 0.9, 4.5, 3.4 cm3) were close to the true known reference volumes (0.27, 0.9, 4.4 and 3.5 cm3) respectively. We can therefore conclude that the software yielded almost accurate volumes of the four simulated nodules.
Inter-observer agreement
Inter-observer agreement was excellent for both TV measurements, as indicated by an ICC of 0.99 [95% confidence interval (CI), 0.98–0.99].
Similarly, a Bland-Altman method showed excellent inter-observer agreement (Figure 3). Mean inter-observer variability of volume measurements was 0.36% (95% CI: −4.84% to 5.54%). For inter-observer agreement a lower limit of agreement of −39.29% (95% CI: −48.20% to −30.39%) and an upper limit of agreement of 32.25% (95% CI: 27.41% to 39.19%) were found.
Figure 3.
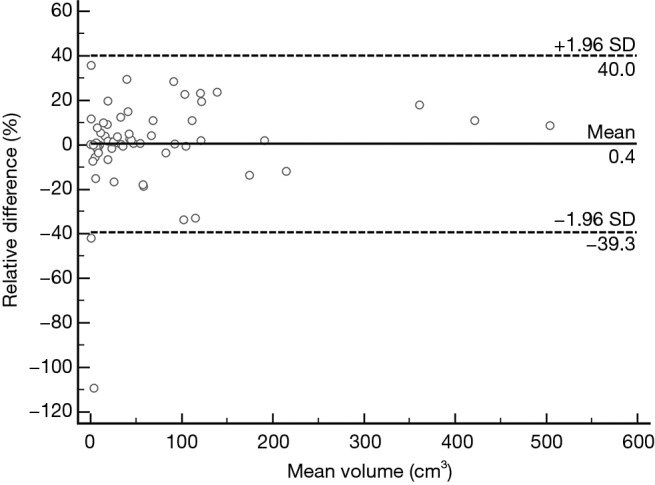
Inter-observer agreement plot of tumor volume. The Bland-Altman plot shows the relative difference of tumor volumes between measurement of two radiologists against mean tumor volume. The two outer dashed lines represent 95% limits of agreement, which define the range (−1.96 and 1.96 SD) within which most differences between repeated measurements will lie. The mean difference (0.4%) is indicated by the central solid line. X-axis: mean of tumor volumes between the measurement of two radiologists. Y-axis: difference of tumor volumes between the measurement of two radiologists.
Repeatability of measurements
Mean and SD of the TV measurements were obtained by one observer at the first and second reading sessions. According to Bland-Altman methods, mean intra-observer variability of volume measurements was 0.28% (95% CI: −1.10% to 1.62%), the lower limit of agreement was −10.03% (95% CI: −12.34% to −7.71%), and the upper limit of agreement was 10.58% (95% CI: 8.27% to 12.89%). It showed that the TV can be measured in a reproducible fashion (Figure 4).
Figure 4.
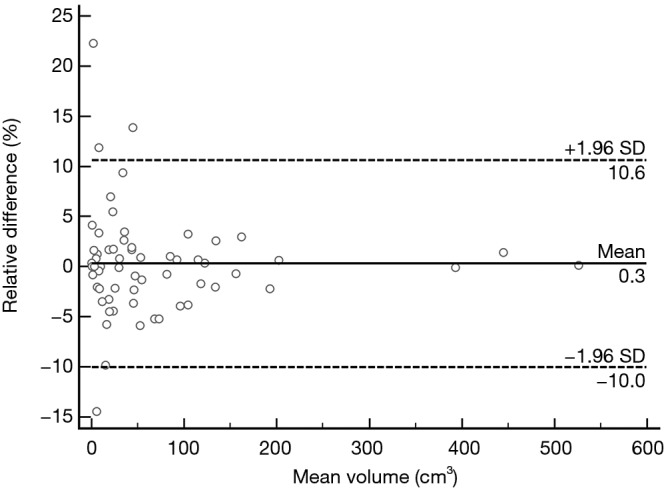
Intra-observer agreement plot of tumor volume. The Bland-Altman plot shows the relative difference of tumor volumes between the first and second reading sessions against mean tumor volume. The two outer dashed lines represent 95% limits of agreement, which define the range (−1.96 and 1.96 SD) within which most differences between repeated measurements will lie. The mean difference (0.3%) is indicated by the central solid line. X-axis: mean of tumor volumes between the 1st and 2nd reading sessions. Y-axis: difference of tumor volumes between the 1st and 2nd reading sessions.
Comparison of TV between thymoma and thymic carcinoma
The measured TVs ranged from 0.3–526.2 cm3 (mean ± SD: 70.2±102.3 cm3). Sample cases of TET volume are shown in Figure 5.
Figure 5.
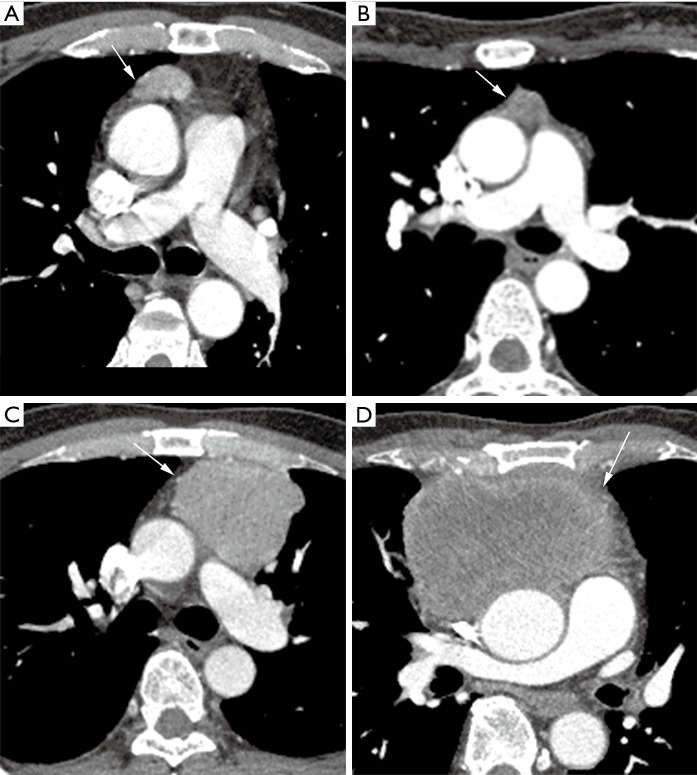
Some images of the thymic epithelial tumors. White arrow reveals tumor. The WHO type, Masaoka staging, and tumor volumes are shown: (A) type AB, stage I, 6.2 cm3, (B) type B2, stage I, 2.3 cm3, (C) type AB, stage III, 104.4 cm3, (D) thymic carcinoma, stage IVb, 526.2 cm3. Relatively smaller volume of TETs is shown in (A) and (B). Relatively larger volume of TETs is shown in (C) and (D). We found that even different WHO subtypes of TETs can show a similar tumor volume. TETs, thymic epithelial tumors.
The TVs (mean ± SD) in each WHO histologic type were 127.5±105.6 cm3 in type A; 42.0±37.9 cm3 in type AB; 61.8±121.5 cm3 in type B1; 48.6±62.6 cm3 in type B2; and 44.2±48.2 cm3 in type B3 thymomas, respectively. The TVs (mean ± SD) in thymic carcinoma were 117.5±143.6 cm3. There was no significant difference in the volume among each WHO histological type (Figure 6).
Figure 6.
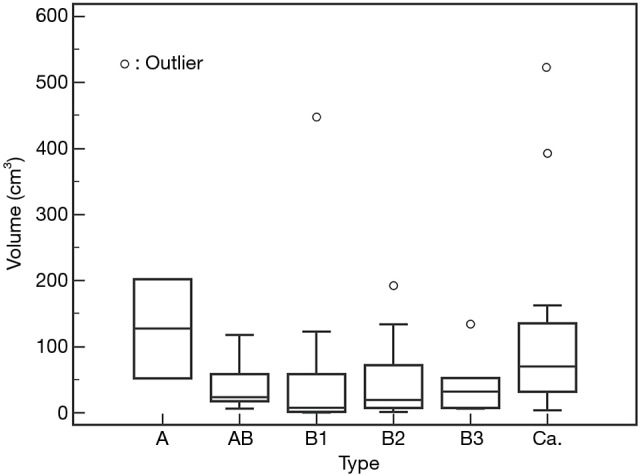
Tumor volume according to each WHO type. Tumor volume of TETs based on the World Health Organization (WHO) classification. There were no significant differences in tumor volume among each subtype. White circles reveal distribution of each case. TETs, thymic epithelial tumors; Ca., thymic carcinoma.
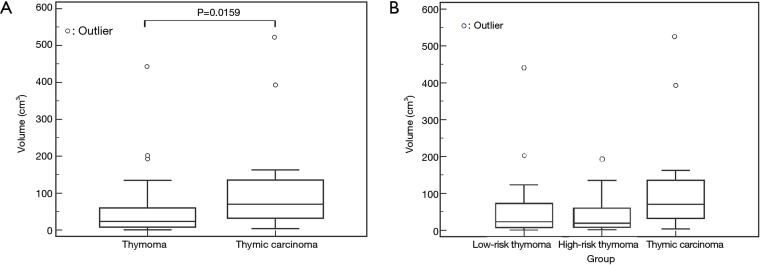
The TVs (mean ± SD) were 53.4±78.4 cm3 in thymoma and 117.5±143.6 cm3 in thymic carcinoma. There was a significant difference in the volume between thymoma and thymic carcinoma (Figure 7A). Thymic carcinomas were significantly larger than thymomas (P=0.0159).
Figure 7.
Tumor volume of thymoma and thymic carcinoma. (A) There was a significant difference between thymoma and thymic carcinoma (P=0.0159). (B) Tumor volume of low-risk thymoma (type A, AB, and B1), high-risk thymoma (type B2 and B3), and thymic carcinoma. There were no significant differences among the three groups. White circles reveal distribution of each case.
Thymomas are divided into two sub groups: low risk thymoma (type A, AB, and B1) and high risk thymoma (type B2, and B3). The TVs (mean ± SD) were 57.3±90.0 cm3 in low risk thymoma; 47.0±56.4 cm3 in high risk thymoma. There was no significant difference in the volume among low-risk thymoma, high-risk thymoma, and thymic carcinoma (P=0.067) (Figure 7B).
Comparison of TV among each Masaoka staging (stages I–IV)
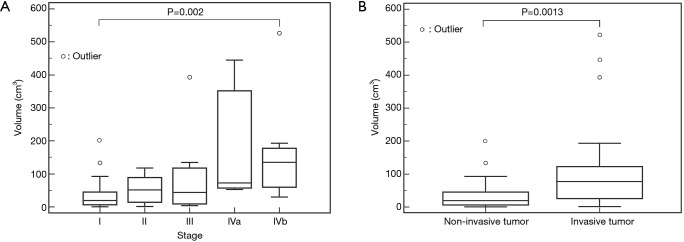
The TVs (mean ± SD) in each Masaoka histologic stage were 33.1±42.6, 84.7±35.2, 87.1±113.4, 162.7±158.3, and 190.8±156.8 cm3, in stages I, II, III, IVa, and IVb, respectively.
There was no significant difference in the volume among each Masaoka clinical stage except between stages I and IVb (Figure 8A). Thymomas at stage IVb were significantly larger than stage I (P=0.002). The non-invasive TETs correlated to Masaoka Stage I tumor and the invasive ones correlated to Masaoka stages II–IVb. The TVs of invasive TETs were 108.6±129.6 cm3 (mean ± SD). The invasive TET was larger than the non-invasive TET (P=0.0013) (Figure 8B).
Figure 8.
Tumor volume of TETs based on the Masaoka staging system. (A) There was a significant difference only between stages I and IVb (P=0.002), Tumor volume of non-invasive TETs (stage I) and invasive ones (stages II–IVb). (B) There were significant differences between the two groups (P=0.0013). White circles reveal distribution of each case. TETs, thymic epithelial tumors.
Decision of cut-off value of TV
A TV of 23.6 cm3 was identified as the optimal cutoff value to distinguish thymic carcinoma from thymoma (sensitivity 87.5%, specificity 53.3%). Similarly, the optimal cutoff to distinguish invasive TET from non-invasive TET was 54.3 cm3 (sensitivity 56.7%, specificity 90.3%).
Discussion
This study demonstrated that our custom-developed software is useful for volumetric measurement of s on CT images. We revealed that the TV of a thymic carcinoma may be larger than that of a thymoma at the time of initial presentation. Moreover, we found that the TV of invasive TETs may be larger than non-invasive tumors. We established that the cutoff value of TV to discriminate thymic carcinoma and thymoma was 23.6 cm3, and that the cutoff value of TV to discriminate invasive thymoma and non-invasive thymoma was 54.3 cm3. However, TV alone cannot differentiate the subtypes of WHO classification or Masaoka staging except for stages I and IVb.
The WHO classification and Masaoka staging system have been shown to reflect the clinical features of TET and correlate with prognosis (3-5,26-34). There have been many attempts to predict WHO histologic subtypes or Masaoka staging system of TETs before surgery according to CT findings (2,8-19). The size of TETs is one of the most important prognostic factors (26-28). In our study, the volumes of invasive TETs were significantly larger than that of a thymoma, which was in agreement with a previous study (8,12,17-19). The previous report demonstrated that manual measurement of long axis diameter on CT images was useful for predicting the prognostic outcome of TETs. However, the poor reproducibility of manual measurements resulted in a poor inter-observer agreement on the volumetry of TETs. Generally, automatic measurement of TV using the software provides higher accuracy and reproducibility than manual measurement (35,36). Our custom-developed software could measure TET volume accurately and reproducibly.
Regarding the correlation of TET with WHO classification, there have been only a few reports focusing on the correlation of the size or volume of TET on CT imaging (9,16). In these previous studies, the tumor size measured by long axis was significantly different among each WHO type. In this study, however, no significant difference in the volume among each WHO type was found. One reason was the number of each type was small. In addition, only 2 type A thymomas with relatively large size were included in this study. Previous studies revealed that the tumor size was related to thymoma type: the larger the tumor, the more malignant it is (26,27,29). Since these 2 type A tumors might influence the result. Although the size of these 2 type A thymomas was large, it has been proven pathologically that they were not atypical type A variants.
In this study, we demonstrated that thymic carcinoma was significantly larger than thymoma in TV. However, there were no significant differences in the TV among low-risk thymoma, high-risk thymoma, and thymic carcinoma. Our results were in agreement with previous papers (2,13,15,17-19).
Regarding the correlation of TET volume with Masaoka clinical stages, there was a significant difference in the volume only between stages I and IVb. In contrast, Qu et al. found a significant association between Masaoka staging and tumor size on CT imaging (11). One reason of the different result between our study and Qu’s was that thymic carcinoma was included in our study but not in theirs. Moreover, the small number of stages II–IV TET cases might influence results between the present and previous studies. Lee et al. (8) revealed no significant difference in TV between non-invasive thymoma (stage I) and invasive thymoma (stages II–IV), but Marom et al. (12) revealed significant difference between stage I/II and stage III/IV. In these two reports (8,12), they measured long axes diameter manually and calculated TVs by approximating the tumors to an ellipsoid sphere. In our study, however, TVs were measured semi-automatically. It is difficult to accurately measure TV using a 2-dimensional method because tumors do not always grow symmetrically. However, automatic segmentation using a custom-developed software enables measurements of volume with high reproducibility and accuracy. Scagliori et al. revealed that TV can distinguish patients at stages I and II from those at stages III and IV using commercially available software in a small number of thymomas (18). Our study also revealed significant differences in the TV between non-invasive and invasive TET using the software. A TV of 54.3 cm3 was identified as the optimal cutoff value.
Therefore, in the present study, when a TV less than 23.6 cm3 is detected on the initial CT, there is a possibility that tumor is a thymoma with Masaoka stage I. When a TV from 23.6 to 54.3 cm3 is detected on the initial CT, there is a possibility that tumor is a thymic carcinoma with Masaoka stage I. And when a TV more than 54.3 cm3 is detected on the initial CT, there is a possibility that tumor is a thymic carcinoma with Masaoka stages II–IV. In this way, we could differentiate stage I from stages II–IV. However, we were unable to differentiate stages I–II (early TET) from stages III–IV. The small number of patients might influence the result. This pre-operative distinction by using imaging is essential in patient management, since the stages III–IV requires neo-adjuvant treatments.
Our study has several limitations. First, this study was retrospective and the small number of patients may limit its statistical power to detect differences of TV associated with the WHO classification and/or Masaoka staging. Particularly, only two cases with relatively large tumors were included as type A thymoma. A larger number of conventional type A thymoma will have influenced the mean volume in low-risk thymoma. In order to verify our results, we need prospective studies targeting more patients and would like to further analyze them (e.g., the evaluation of the correlation between WHO classification and Masaoka-Koga system after excluding thymic carcinomas or the correlation between thymomas in patients with symptoms due to autoimmune disease and tumors in patients without systemic symptoms).
Second, our result depends on our custom-developed software which enables us to extract the tumor on CT and calculate the TV semi-automatically. As the calculation method of TV is not full-automatic, minor discrepancies may be observed in each volume measurement. Third, it will be lied recall bias for intraobserver variability because the measurements repeated by the reader one month after first measurement.
In conclusion, our software could measure TET volume semi-automatically. Invasive TET volumes may be larger at the time of initial presentation. TETs which have a TV larger than 23.6 cm3 are more likely thymic carcinoma than thymoma. Similarly, TETs which have a TV larger than 54.3 cm3 are more likely invasive than non-invasive TET.
Acknowledgements
We thank Shuji Yamamoto (LISIT, Inc., Life Saving Imaging Technologies) for his technical support and the modifications made on the GGO® software.
Ethical Statement: The study was approved by the institutional review board of Osaka University Graduate School of Medicine (No. 13522) and waived the need for written informed consent from each patient.
Footnotes
Conflicts of Interest: The authors have no conflicts of interest to declare.
References
- 1.Travis WD, Brambilla E, Burke AP, et al. Pathology and Genetics of Tumours of the Lung, Pleura, Thymus and Heart, 4th ed. Lyon: IARC Press, 2015. [DOI] [PubMed] [Google Scholar]
- 2.Jeong YJ, Lee KS, Kim J, et al. Does CT of thymic epithelial tumors enable us to differentiate histologic subtypes and predict prognosis. AJR Am J Roentgenol 2004;183:283-9. 10.2214/ajr.183.2.1830283 [DOI] [PubMed] [Google Scholar]
- 3.Chen G, Marx A, Wen-Hu C, et al. New WHO histologic classification predicts prognosis of thymic epithelial tumors: a clinicopathologic study of 200 thymoma cases from China. Cancer 2002;95:420-9. 10.1002/cncr.10665 [DOI] [PubMed] [Google Scholar]
- 4.Okumura M, Shiono H, Minami M, et al. Clinical and pathological aspects of thymic epithelial tumors. Gen Thorac Cardiovasc Surg 2008;56:10-6 10.1007/s11748-007-0177-8 [DOI] [PubMed] [Google Scholar]
- 5.Okumura M, Ohta M, Tateyama H, et al. The World Health Organization histologic classification system reflects the oncological behavior of thymoma: a clinical study of 273 patients. Cancer 2002;94:624-32. 10.1002/cncr.10226 [DOI] [PubMed] [Google Scholar]
- 6.National Comprehensive Cancer Network guidelines. (Accessed on March 16, 2016). Available online: https://www.nccn.org/professionals/physician_gls/default.aspx
- 7.International Thymic Malignancy Interest Group standard treatment options. Available online: https://www.itmig.org/node/11
- 8.Lee JH, Park CM, Park SJ, et al. Value of Computerized 3D Shape Analysis in Differentiating Encapsulated from Invasive Thymomas. PLoS One 2015;10:e0126175. 10.1371/journal.pone.0126175 [DOI] [PMC free article] [PubMed] [Google Scholar]
- 9.Tomiyama N, Johkoh T, Mihara N, et al. Using the World Health Organization Classification of thymic epithelial neoplasms to describe CT findings. AJR Am J Roentgenol 2002;179:881-6. 10.2214/ajr.179.4.1790881 [DOI] [PubMed] [Google Scholar]
- 10.Priola AM, Priola SM, Di Franco MD, et al. Computed tomography and thymoma: distinctive findings in invasive and noninvasive thymoma and predictive features of recurrence. Radiol Med 2010;115:1-21. 10.1007/s11547-009-0478-3 [DOI] [PubMed] [Google Scholar]
- 11.Qu YJ, Liu GB, Shi HS, et al. Preoperative CT findings of thymoma are correlated with postoperative Masaoka clinical stage. Acad Radiol 2013;20:66-72. 10.1016/j.acra.2012.08.002 [DOI] [PubMed] [Google Scholar]
- 12.Marom EM, Milito MA, Moran CA, et al. Computed tomography findings predicting invasiveness of thymoma. J Thorac Oncol 2011;6:1274-81. 10.1097/JTO.0b013e31821c4203 [DOI] [PubMed] [Google Scholar]
- 13.Jung KJ, Lee KS, Han J, et al. Malignant thymic epithelial tumors: CT-pathologic correlation. AJR Am J Roentgenol 2001;176:433-9. 10.2214/ajr.176.2.1760433 [DOI] [PubMed] [Google Scholar]
- 14.Sadohara J, Fujimoto K, Muller NL, et al. Thymic epithelial tumors: comparison of CT and MR imaging findings of low-risk thymomas, high-risk thymomas, and thymic carcinomas. Eur J Radiol 2006;60:70-9. 10.1016/j.ejrad.2006.05.003 [DOI] [PubMed] [Google Scholar]
- 15.Yakushiji S, Tateishi U, Nagai S, et al. Computed tomographic findings and prognosis in thymic epithelial tumor patients. J Comput Assist Tomogr 2008;32:799-805. 10.1097/RCT.0b013e31815896df [DOI] [PubMed] [Google Scholar]
- 16.Liu GB, Qu YJ, Liao MY, et al. Relationship between computed tomography manifestations of thymic epithelial tumors and the WHO pathological classification. Asian Pac J Cancer Prev 2012;13:5581-5. 10.7314/APJCP.2012.13.11.5581 [DOI] [PubMed] [Google Scholar]
- 17.Chang S, Hur J, Im DJ, et al. Volume-based quantification using dual-energy computed tomography in the differentiation of thymic epithelial tumours an initial experience. Eur Radiol 2017;27:1992-2001. 10.1007/s00330-016-4542-9 [DOI] [PubMed] [Google Scholar]
- 18.Scagliori E, Evangelista L, Panunzio A, et al. Conflicting or complementary role of computed tomography (CT) and positron emission tomography (PET)/CT in the assessment of thymic cancer and thymoma: our experience and literature review. Thoracic Cancer 2015;6:433-42. 10.1111/1759-7714.12197 [DOI] [PMC free article] [PubMed] [Google Scholar]
- 19.Choe J, Lee SM, Lim S, et al. Doubling time of thymic epithelial tumours on CT: correlation with histological subtype. Eur Radiol 2017;27:4030-6. 10.1007/s00330-017-4795-y [DOI] [PubMed] [Google Scholar]
- 20.Masaoka A, Monden Y, Nakahara K, et al. Follow-up study of thymomas with special reference to their clinical stages. Cancer 1981;48:2485-92. [DOI] [PubMed] [Google Scholar]
- 21.Travis WD, Brambilla E, Müller-Hermelink HK, et al. Pathology and Genetics of Tumours of the Lung, Pleura, Thymus and Heart. Lyon, France: IARC Press, 2004. [Google Scholar]
- 22.Li C, Xu C, Gui C, et al. Distance Regularized level set evolution and its application to image segmentation. IEEE Trans Image Process 2010;19:3243-54. 10.1109/TIP.2010.2069690 [DOI] [PubMed] [Google Scholar]
- 23.Bland JM, Altman DG. Statistical methods for assessing agreement between two methods of clinical measurement. Lancet 1986;1:307-10. 10.1016/S0140-6736(86)90837-8 [DOI] [PubMed] [Google Scholar]
- 24.Bland JM, Altman DG. Applying the right statistics: analyses of measurement studies. Ultrasound Obstet Gynecol 2003;22:85-93 10.1002/uog.122 [DOI] [PubMed] [Google Scholar]
- 25.Altman DG. Practical statistics for medical research. 1st ed. London: Chapman and Hall, 1991. [Google Scholar]
- 26.Nakagawa K, Asamura H, Matsuno Y, et al. Thymoma: a clinicopathologic study based on the new World Health Organization classification. J Thorac Cardiovasc Surg 2003;126:1134-40. 10.1016/S0022-5223(03)00798-0 [DOI] [PubMed] [Google Scholar]
- 27.Blumberg D, Port JL, Weksler B, et al. Thymoma: a multivariate analysis of factors predicting survival. Ann Thorac Surg 1995;60:908-13; discussion 914. 10.1016/0003-4975(95)00669-C [DOI] [PubMed] [Google Scholar]
- 28.Okumura M, Miyoshi S, Fujii Y, et al. Clinical and functional significance of WHO classification on human thymic epithelial neoplasms: a study of 146 consecutive tumors. Am J Surg Pathol 2001;25:103-10. 10.1097/00000478-200101000-00012 [DOI] [PubMed] [Google Scholar]
- 29.Wright CD, Wain JC, Wong DR, et al. Predictors of recurrence in thymic tumors: importance of invasion, World Health Organization histology, and size. J Thorac Cardiovasc Surg 2005;130:1413-21. 10.1016/j.jtcvs.2005.07.026 [DOI] [PubMed] [Google Scholar]
- 30.Chalabreysse L, Roy P, Cordier JF, et al. Correlation of the WHO schema for the classification of thymic epithelial neoplasms with prognosis: a retrospective study of 90 tumors. Am J Surg Pathol 2002;26:1605-11. 10.1097/00000478-200212000-00008 [DOI] [PubMed] [Google Scholar]
- 31.Kim BK, Cho BC, Choi HJ, et al. A single institutional experience of surgically resected thymic epithelial tumors over 10 years clinical outcomes and clinicopathologic features. Oncol Rep 2008;19:1525-31. [PubMed] [Google Scholar]
- 32.Kim DJ, Yang WI, Choi SS, et al. Prognostic and clinical relevance of the World Health Organization schema for the classification of thymic epithelial tumors: a clinicopathologic study of 108 patients and literature review. Chest 2005;127:755-61. 10.1378/chest.127.3.755 [DOI] [PubMed] [Google Scholar]
- 33.Ríos A, Torres J, Galindo PJ, et al. Prognostic factors in thymic epithelial neoplasms. Eur J Cardiothorac Surg 2002;21:307-13. 10.1016/S1010-7940(01)01091-0 [DOI] [PubMed] [Google Scholar]
- 34.Sonobe S, Miyamoto H, Izumi H, et al. Clinical usefulness of the WHO histological classification of thymoma. Ann Thorac Cardiovasc Surg 2005;11:367-73. [PubMed] [Google Scholar]
- 35.Yanagawa M, Tanaka Y, Kusumoto M, et al. Automated assessment of malignant degree of small peripheral adenocarcinomas using volumetric CT data: Correlation with pathologic prognostic factors. Lung Cancer 2010;70:286-94. 10.1016/j.lungcan.2010.03.009 [DOI] [PubMed] [Google Scholar]
- 36.Honda O, Johkoh T, Sekiguchi J, et al. Doubling time of lung cancer determined using three-dimensional volumetric software: Comparison of squamous cell carcinoma and adenocarcinoma. Lung Cancer 2009;66:211-7. 10.1016/j.lungcan.2009.01.018 [DOI] [PubMed] [Google Scholar]


