Abstract
Background
Esophageal squamous cell carcinoma (ESCC) is a common malignancy with high mortality. Because of the lack of clarity in the relevant genes and mechanisms involved, and the current difficulty for oncotherapy in providing therapeutic solutions, there is an urgent need to study this matter. While gene probe studies have been used to select the most virulent genes and pathways, paucity of case controls during gene screening and lack of conclusive results to expound the etiology and pathogenesis of the disease, have reduced study reliability.
Methods
We chose six datasets from independent studies in the Gene Expression Omnibus (GEO) database and used gene set enrichment analysis and meta-analysis to select key genes and pathways.
Results
We found four down-regulated and four up-regulated pathways through gene set enrichment analysis, and 406 differential genes through meta-analysis. Based on The Cancer Genome Atlas (TCGA), 995 differentially expressed genes were screened out. Comparing the 406 gene set with the 995 gene set, we found 19 common genes, of which 6 had a common pathway and were screened out as key genes regulating and controlling the prognosis of ESCC.
Conclusions
Among the 19 genes, we found three genes that affect the chemotherapy of ESCC: BUB1B, BUB1, and TTK. Another three genes NDC1, NUP107, and NUP155 on the RNA transport pathway were also found. Altogether, these six genes are not only crucial in the development of ESCC, but also determine the prognosis of patients. The key genes and pathways identified in the present study will be used for the next stage in our study, which will involve gene elimination and other experimentation methods.
Keywords: Esophageal squamous cell carcinoma (ESCC), pathway, key gene, gene set enrichment analysis (GSEA), meta-analysis
Introduction
Originating from the esophageal mucosa or gland, esophageal squamous cell carcinoma (ESCC), which is a predominant type of esophageal carcinoma, is malignant and aggressive with typically poor prognosis (1). According to the data provided by the International Agency for Research on Cancer, of the incidence of 27 cancers in 184 countries in 2012, we found that the crude rate of esophageal carcinoma worldwide is 6.5/100,000 while the incidence of China is 16.4/100,000; thus, China’s incidence of esophageal carcinoma far exceeds the global average. Furthermore, squamous cell carcinoma accounts for about 90% of the global esophageal carcinoma, while the 5-year survival rate of ESCC patients, although diagnostic methods and treatments have improved over the last few years, remains generally poor (2).
Gene chips have been widely used in cancer research, and the analysis of genome-wide mRNA expression chips—a kind of gene chips can help identify the disease-related genes, and provide an important theoretical basis for the pathogenesis of ESCC. For instance, Subramanian used a method of gene set enrichment analysis (GSEA) (3,4) to reveal significant differences in the expression between normal people’s and patients’ samples. GSEA, in contrast with other analytical methods, shows its distinction in gene detection by testing groups, rather than individual genes. In order to provide a better personalized therapy for ESCC patients, we upgraded the analytical method to construct the disease-related gene regulatory network by combining GSEA with meta-analysis. These two methods were utilized to select significant genes for gene ontology (GO) annotation.
Methods
Datasets selection
We systematically for x using the key phrase “Esophageal Carcinoma” in the Gene Expression Omnibus (GEO) (5) with a subject limit of expression profiled by an array and the species limit of humans 115 identified datasets were found up to the date of September 1st, 2017. Any dataset that met the following standards was selected for inclusion: (I) datasets were about genome-wide RNA expression; (II) datasets provided a comparison between the patient and control; (III) datasets contained more than 3 samples; (IV) the samples were from esophageal tissue; (V) datasets compared ESCC to normal controls from the same patients with ESCC. Finally, there were six gene expression datasets that met the selection criteria (Table 1).
Table 1. Characteristics of datasets selected in the studies.
| GEO accession | Contributor | Submission date | Region | Experimental design | Chip | Organism | Probes | Disease | Normal |
|---|---|---|---|---|---|---|---|---|---|
| GSE17351 | Nakagawa H | 1-Sep-09 | USA | Paired, tissues | GPL570 [HG-U133_Plus_2] | Homo sapiens | 35166 | 5 | 5 |
| GSE20347 | Clifford RJ | 15-Mar-11 | USA | Paired, tissues | GPL571 [HG-U133A_2] | Homo sapiens | 22277 | 17 | 17 |
| GSE23400 | Su H | 1-Sep-10 | USA | Paired, tissues | GPL96 [HG-U133A] | Homo sapiens | 22283 | 53 | 53 |
| GSE38129 | Hu N | 30-Dec-15 | USA | Paired, tissues | GPL571 [HG-U133A_2] | Homo sapiens | 22277 | 30 | 30 |
| GSE77861 | Erkizan HV | 15-Aug-17 | USA | Paired, tissues | GPL570 [HG-U133_Plus_2] | Homo sapiens | 54675 | 7 | 7 |
| GSE100942 | Zhang X | 15-Jul-17 | Hong Kong | Paired, tissues | GPL570 [HG-U133_Plus_2] | Homo sapiens | 54675 | 4 | 4 |
GEO, Gene Expression Omnibus.
Significant gene detecting through gene set enrichment analysis
Software packages developed in the version 2.10.1 of Bioconductor (6) were applied for standardized preprocessing. The Robust Multichip Averaging (7,8) algorithm in the affy conductor package was used for each Affymetrix raw dataset, to calculate the background adjusted, normalized and log2 probe-set intensities. The measure of variability was within the interquartile range (IQR), and a cut-off was set up to remove IQR values under 0.5 for all of the remaining genes. If one gene was targeted for multiple probe sets, we retained the probe set with the largest variability. Pathway analysis of each dataset was performed independently. GSEA was performed using the category version 2.10.1 package. Gene sets contained more than ten genes were retained, Student’s t-test statistical score was implemented for each pathway and also the mean of the genes was calculated. Additionally, a permutation test was performed 1,000 times to obtain the P value of each pathway.
Meta-analysis
Six datasets were analyzed by independent sample using the Student’s t-test method. Meta-analysis was carried out in SAS 9.42. We calculated the chi-square values of the remaining genes of each database above, and retained the differently expressed genes with chi-square values under 0.05. The selection process was based on the following formula (9)
The Cancer Genome Atlas (TCGA)
We downloaded the clinical data and expression profiles of esophageal carcinoma into TCGA database, and removed the esophageal adenocarcinoma group and the control group data. Then, we analyzed the survival data package of R language, used cox-regression analysis, and adjusted P<0.05 so that we could acquire the significant differential genes and obtain their Kaplan-Meier (K-M) survival curves. These genes, together with the genes found in the meta-analysis above, were then used to screen the most differentially expressed genes and obtain significant pathways.
Gene annotation
While searching the intersection of the 406 genes that were obtained from meta-analysis with the 995 genes obtained from TCGA, 19 genes had statistical differences that could affect survival prognosis, and were consequently screened out. We only selected the genes that have been mapped to any explicit KEGG (10) pathway for the sake of having a better insight of the results from the GSEA and meta-analysis. The consistent genes were annotated by the software, Blast2go. The 19 significant genes were used to obtain the pathways of the KEGG from DAVID Bioinformatics Resources 6.7 and annotated by Blast2go. Finally, we put significant genes into the Su Esophagus 2 Oncomine database (www.oncomine.org) for validation.
Results
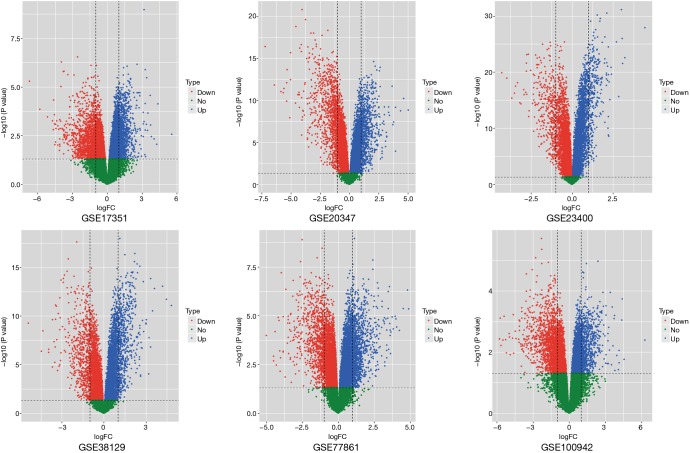
Common significant pathways were obtained from six esophageal carcinoma tissue datasets by GSEA. According to the inclusion criteria, there were six datasets containing 116 esophageal carcinoma tissues and 116 normal tissues screened out. They are GSE17351, GSE20347, GSE23400, GSE38129, GSE77861 and GSE100942. More details about the datasets are shown on Table 1. The GSEA method was used on each dataset to identify significantly altered genes and significant common pathways. Tissues used to extract the total RNA were matched by pairs from esophageal carcinoma, and normal tissue that was adjacent to esophageal carcinoma. Genomic profiles were matched in pairs in samples above, which reduced the influence of the multiple factors on GSEA and meta-analysis with the purpose of ensuring the reliability of the conclusions obtained. After performing the GSEA conclusion, we identified four up-regulation pathways as well as four down-regulation pathways from six groups of datasets in the path comparison. The four up-regulation pathways were aminoacyl-tRNA biosynthesis, proteasome, ribosome biogenesis in eukaryotes and homologous recombination. The four down-regulation pathways were histidine metabolism, arachidonic acid metabolism, fatty acid degradation and valine, leucine and isoleucine degradation (Table 2). Then, we used the volcano plot method (Figure 1), to roughly screen the genes for the first time.
Table 2. Summary of six datasets using GSEA.
| Up-regulation pathway |
| Aminoacyl-tRNA biosynthesis |
| Proteasome |
| Ribosome biogenesis in eukaryotes |
| Homologous recombination |
| Low-regulation pathway |
| Histidine metabolism |
| Arachidonic acid metabolism |
| Fatty acid degradation |
| Valine, leucine and isoleucine degradation |
GSEA, gene set enrichment analysis.
Figure 1.
Volcano plot of six datasets.
Conclusion of the meta-analysis
Due to the differences between experimental platforms and the different choices of samples, standardization methods and analysis methods, it’s not surprising that different experimental platforms yield differing data. Taking the results of multiple independent studies on the same subject as the object of the research and based on strict design, the meta-analysis uses appropriate statistical methods to comprehensively analyze multiple research results that are both objective and quantitative. The advantage of meta-analysis is that by using this method, we can improve the reliability of conclusions and reduce the inconsistencies in the results of study by increasing the sample content. With an independent sample, Student’s t-test, six datasets were analyzed, and we obtained the P value of each gene, retaining only the differently expressed genes with chi-square values under 0.05. We inserted the genes’ names into the software SAS 9.42 for statistical analysis, and used the selected meta-formula for integration analysis. Thus, a total of 406 genes were screened out (P<0.05).
Conclusion of the TCGA
We downloaded the clinical data and expression profiles of esophageal tumor into TCGA database, removed the esophageal adenocarcinoma group and the control group data, used the survival data package of R language, used cox-regression analysis, and adjusted P’ value <0.05 (P’ value stands for the P value in TCGA) so that a total of 995 significant differential genes and their K-M survival curves were obtained. Although these genes are all confirmed to be related to prognosis, they have different effects on the prognosis of patients. To improve the patient’s prognosis, we compared these genes with those found in the meta-analysis mentioned above, allowing us to identify the genes that play an important role in the development of ESCC, as well as the ones that are closely related to the prognosis. By studying the pathways where these genes are located, we can better understand the mechanism of ESCC and provide a targeted research direction for the future improvement of patient prognosis.
Gene annotation for key genes
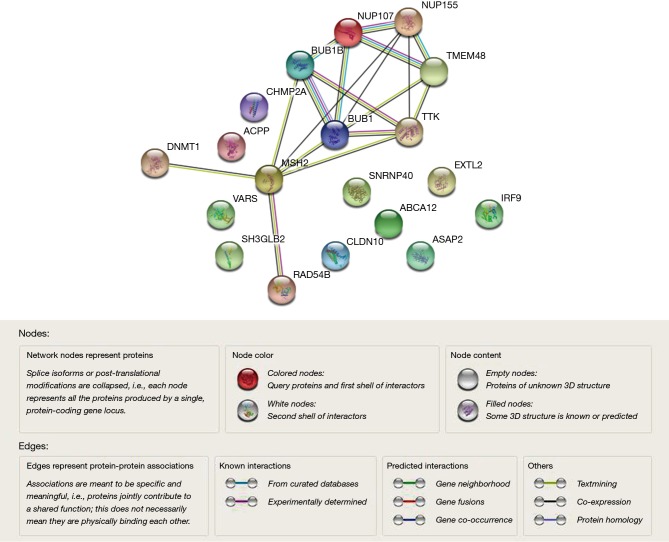
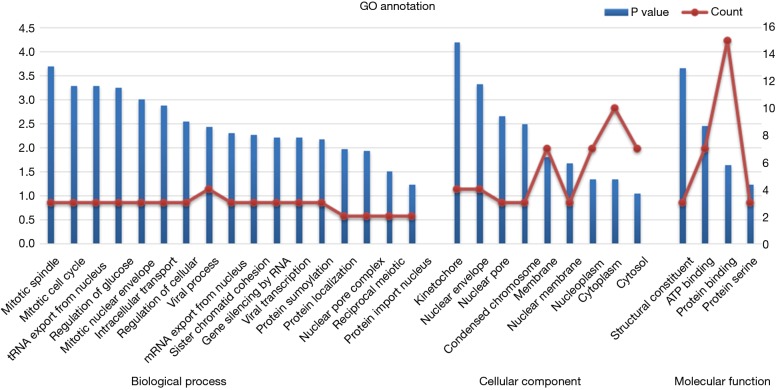
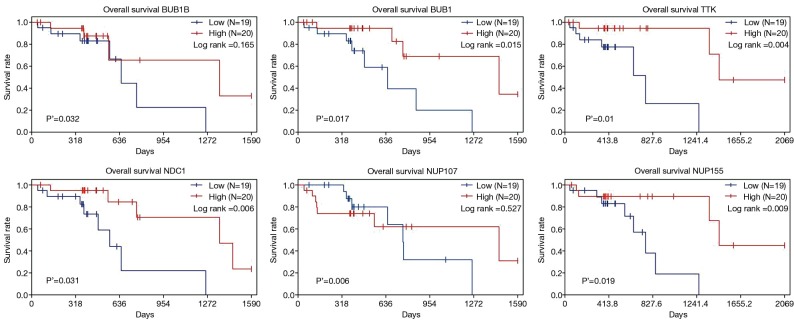
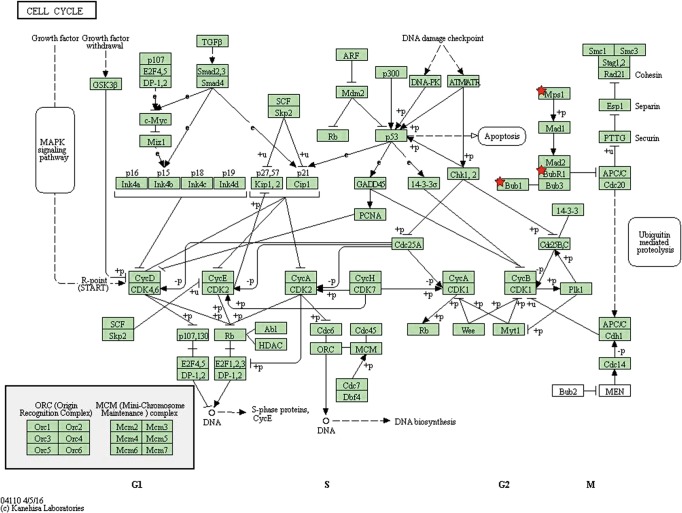
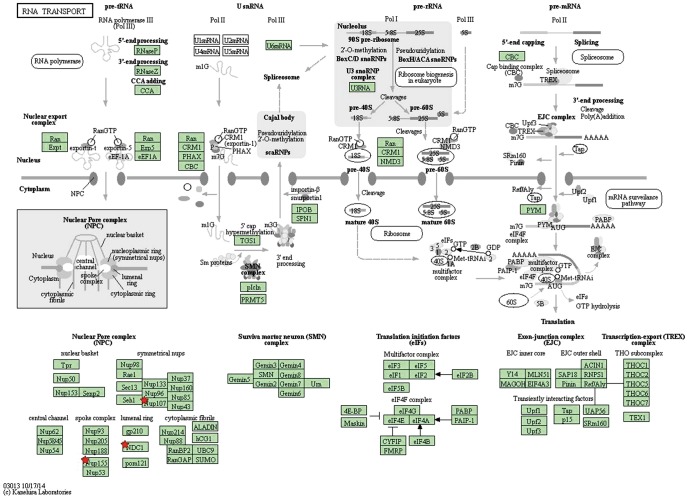
By taking the intersection of the 406 meta-analysis and the 995 TCGA databases, we selected a total of 19 common genes to be screened from the meta-analysis and TCGA databases. The 19 genes had statistical differences and could affect survival prognosis. The names, P’ and P value of the 19 common genes are shown in Table 3. In addition, we drew the Venn Diagram (Figure 2) to visually display the process of taking the intersection. Furthermore, we downloaded the gene network map of 19 key genes from the String database (Figure 3) to better demonstrate the relationship among these genes. As for these 19 genes, we performed a GO annotation (Figure 4) and looked for their common KEGG pathways by DAVID. We utilized Blast2go for gene annotation, and the result was that 19 genes were divided into three parts named the Cellular Component, the Molecular Function and the Biological Process. We found two common KEGG pathways from DAVID Bioinformatics Resources 6.7, which were the Cell cycle and the RNA transport pathways, with each pathway having three key genes. These six key genes’ K-M survival curves were obtained (Figure 5). The cell cycle pathway contained the following three genes (Figure 6): BUB1B (BUB1 mitotic checkpoint serine/threonine kinase B), BUB1 (BUB1 mitotic checkpoint serine/threonine kinase), and TTK (TTK protein kinase). The RNA transport pathway contained the following three genes (Figure 7): NDC1 (NDC1 transmembrane nucleoporin), NUP107 (nucleoporin 107), and NUP155 (nucleoporin 155).
Table 3. Common genes screened from the meta-analysis and TCGA databases.
| Gene name | Location | P value | P’ value | Type |
|---|---|---|---|---|
| NUP155 | 5p13.2 | 1.22E-15 | 0.018650 | Up |
| ASAP2 | 2p25.1; 2p24 | 0.001135 | 0.030007 | Up |
| RAD54B | 8q22.1 | 6.98E-13 | 0.020964 | Up |
| SH3GLB2 | 9q34.11 | 0.00E+00 | 0.016012 | Down |
| CLDN10 | 13q32.1 | 0.002535 | 6.15E-04 | Down |
| ACPP | 3q22.1 | 2.31E-13 | 0.038153 | Down |
| ABCA12 | 2q35 | 0.038204 | 0.040447 | Up |
| CHMP2A | 19q13.43 | 1.71E-09 | 0.010392 | Down |
| DNMT1 | 19p13.2 | 2.22E-16 | 0.026660 | Up |
| VARS | 6p21.33 | 0.034115 | 0.021041 | Up |
| EXTL2 | 1p21.2 | 0.033779 | 0.029618 | Up |
| MSH2 | 2p21-p16.3 | 1.19E-06 | 0.043425 | Up |
| BUB1B | 15q15.1 | 5.55E-16 | 0.031915 | Up |
| SNRNP40 | 1p35.2 | 0.005732 | 0.048899 | Up |
| IRF9 | 14q12 | 7.23E-05 | 0.040779 | Up |
| TTK | 6q14.1 | 1.94E-13 | 0.010229 | Up |
| NDC1 | 1p32.3 | 9.18E-09 | 0.031411 | Up |
| BUB1 | 2q13 | 0.00E+00 | 0.016732 | Up |
| NUP107 | 12q15 | 0.00E+00 | 0.006171 | Up |
P’ value, P value in TCGA. TCGA, The Cancer Genome Atlas.
Figure 2.
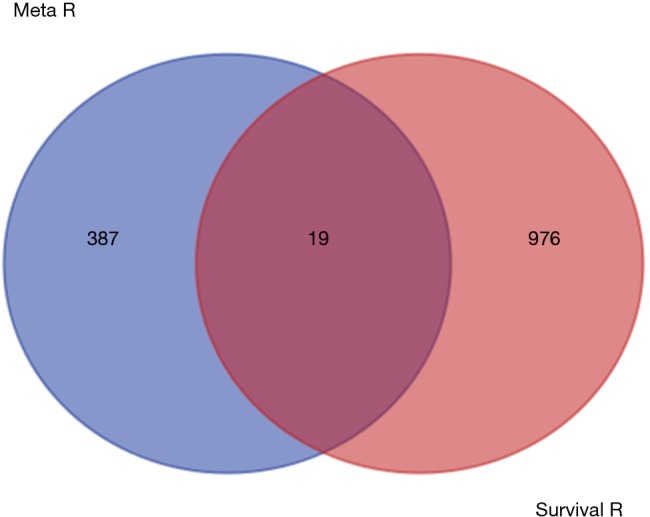
Venn chart of 19 common genes.
Figure 3.
A gene network map of 19 key genes from the String database.
Figure 4.
GO annotation of 19 common genes. GO, gene ontology.
Figure 5.
The K-M survival curves of six key genes. K-M, Kaplan-Meier.
Figure 6.
Cell cycle pathway (the chart is from the KEGG database, gene symbolized by ★ and correlation P values can be found in Table 3).
Figure 7.
RNA transport pathway (the chart is from the KEGG database, gene symbolized by ★ and correlation P values can be found in Table 3).
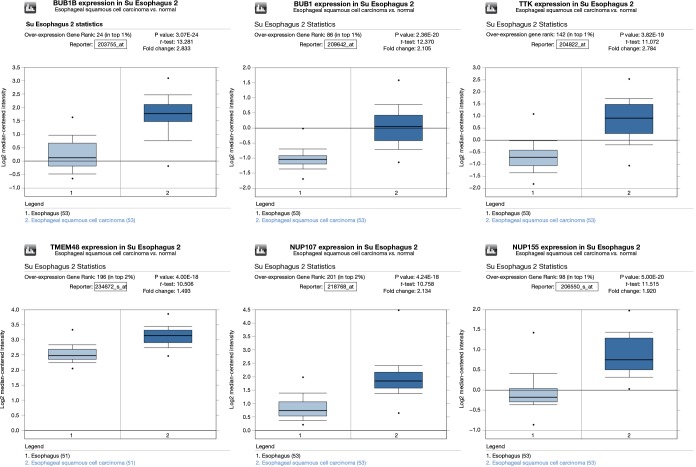
Finally, we put these six key genes into the Su Esophagus 2 database in Oncomine for validation. The six key genes were found to be highly expressed, with statistical difference (Figure 8).
Figure 8.
The boxplots of 6 key genes from Su Esophagus 2 database in Oncomine.
Discussion
Currently, analysis of gene chip data is an important part of the study of tumor-related genes. The international esophageal carcinoma situation is severe, and the lack of esophageal cancer gene chip data analysis makes the pathogenesis of esophageal a poorly understood phenomenon. We combined GSEA and meta-analysis to analyze six datasets and compared them with TCGA database intending to find important genes and pathways that affect the development and prognosis of ESCC, as well as to reveal the role of these genes in the pathogenesis of esophageal carcinoma.
It’s difficult for researchers to gain enough samples of a disease, so many studies only focus on a small sample that are available. If analysis is only for a single experimental result, and limited to a single gene, a lot of useful information will be missed. Moreover, restricted by sample size, the Student’s t-test of the gene chip has a certain limitation, which leads to the estimation of untrustworthy variants, resulting in higher false positives, and the ignoring of different levels of expression from different samples (11). Gene Set Enrichment Analysis (GSEA) is a computational method that assesses whether a priori defined set of genes shows statistically significant and concordant differences between two biological states, and determines the presence or absence of a common expression by analyzing data of two different biological states (e.g., normal and cancerous) to infer the genes or pathways associated with the disease (4). We performed a meta-analysis with the version 9.42 SAS software, limited P<0.05, to find 406 differently expressed genes. In contrast to only comparing six gene sets to get common genes, which the gene sets have at the same time, meta-analysis avoids the following drawbacks: (I) since the sample size is too small, genes that are not common to six gene sets but are still important may be missed; (II) a simple comparison does not restrict the P value, which may result in statistical bias.
Based on the consideration of the following two reasons, we did not use 406 differently expressed genes from the meta-analysis as the final result: (I) the number and range of these genes are too big or wide, which makes it laborious to go through them in detail; (II) by meta-analysis alone, it is impossible to figure out whether the role the 406 genes play in the development of ESCC is a key gene or just a biomarker. In TCGA database, a total of 995 significant differential genes and their K-M survival curves were obtained. While searching the intersection of the 995 genes and the 406 genes that were obtained through meta-analysis, 19 genes that had statistical differences and could affect survival prognosis were screened out. The 19 genes were put into DAVID for GO annotation and for finding the common KEGG pathway. Unfortunately, the two pathways did not overlap with the eight pathways found by the GSEA. However, these two pathways and their genes may be closely related to ESCC. The two common pathways were the cell cycle and RNA transport, each pathway having three related genes. The three genes on cell cycle were BUB1B (BUB1 mitotic checkpoint serine/threonine kinase B), BUB1 (BUB1 mitotic checkpoint serine/threonine kinase), and TTK (TTK protein kinase). The three genes on RNA transport were NDC1 (NDC1 transmembrane nucleoporin), NUP107 (nucleoporin 107), and NUP155 (nucleoporin 155). The respective discussion of the genes of each pathway follows below.
Interestingly, BUB1B and BUB1 have a common effect in the cell cycle. In a variety of cancer tissues including ESCC, the expression of BUB1B was significantly higher than in adjacent normal tissues. Tumor BUB1B was significantly reduced after chemoradiotherapy. In ESCC-related pharmacological studies, high levels of BUB1B are less sensitive to the parenteral drugs, paclitaxel and nocodazole (12). For the second chemoradiotherapy of recurrent and metastatic esophageal cancer, the potential efficacy of taxanes is reduced, due to the detection of BUB1B (13). As an important molecule in the formation of mitotic spindles, the application value of BUB1B as a drug target or biomarker in the diagnosis and treatment of hepatocellular carcinoma and primitive neuroectodermal tumors is constantly being explored (14,15). Clinically, studies have found that BUB1B expression is associated with a poor prognosis in patients with glioblastoma multiforme (GBM). BUB1B promotes tumor proliferation and induces radioimmunoassay of GBM, and BUB1B may confer to aggressive and effective drugs. This reaction provides a predictive marker. The BUB1BR/S classification of GBM tumors can predict the clinical course and sensitivity to drug treatment (16,17). The ZWINT gene is highly expressed in a variety of cancers, including esophageal cancer. Studies have shown that BUB1B and BUB1 may be important components of the ZWINT mitotic checkpoint for lung cancer (18). Although there is no clear application of BUB1B as a target for clinical diagnosis or treatment, the above studies have pointed out the direction for the application of BUB1B in ESCC.
During apoptosis, BUB1 is cleaved and altered expression is associated with treatment failure, and death in a variety of cancer patients (19). BUB1 is carcinogenic; not only does it regulate the cell cycle, but also may be involved in cytoskeletal control, and Aurora B is a key target for overexpression of Bub1-driven aneuploidy and tumorigenesis (20). In pharmacological research, dipyridamole can increase the concentration of various anticancer drugs represented by 5-fluorouracil in cancer cells, thereby improving the efficacy of the treatment of cancer. BUB1 may then be a molecular target for the action of dipyridamole (21).
Many studies have shown that TTK can affect the development of breast cancer (22), melanin (23), pancreatic ductal adenocarcinoma (PDAC) (24), hepatocellular carcinoma (25) and other cancers. TTK protein kinase is up-regulated in ESCC, which may be involved in the tumor progression and/or represent ESCC-specific properties. In the clinical trials of different drugs for ESCC treatment, the expression of the TTK antigen was observed, which is an important indicator for observing the clinical response of patients to drugs, and also as a cancer vaccination for ESCC in the experiment (26,27). The above evidence provides direction for an individualized treatment of ESCC (28).
Among the RNA transport pathways, the three genes are essential components of the nuclear pore complex. These three genes are rarely used in ESCC, but have a certain role in many other diseases. NDC1-mediated ALADIN localization of the nuclear pore complexes is critical for selective nuclear protein introduction (29). The research on NDC1 and Nup107 is mostly about the effects of these two genes on sperm formation and infertility (30,31). The central domain of Nup107 interferes with Apaf-1 nuclear translocation during genotoxic stress, leading to Chk-1 activation, and a significant reduction in cell cycle arrest (32). In ovarian cancer, Nup107 is associated with platinum sensitivity. The single nucleotide variant (SNV) is significantly associated with platinum resistance, and can be used to clinically predict patient response to drugs (33). NUP107 is considered to be a candidate gene for the detection of nephrotic syndrome and families of developmental delays (34,35). Based on high-throughput techniques, NUP107 is a potential molecular marker for early diagnosis of PDAC (36). NUP155 is specific in many tissues, but its specificity in esophageal cancer tissues has not been tested. As a nuclear pore complex protein, NUP155 has been identified as a clinical driver of atrial fibrillation (37,38) and NUP155 may be a new potential drug to target NUP214-ABL1-positive T-cell acute lymphoblastic leukemia (39). Some studies have explored the role that the three genes play on RNA transport pathways; however, little of this research explains the relationship between these genes and cancer, let alone their relationship with ESCC.
In summary, there are a few studies that illuminate the relationship between these genes and esophageal cancer. Currently, we only have information related to genes and pathways, extracted through data analysis, rather than experimental study. We plan to experimentally verify our conjecture about the mechanism of action and the specific functions of these genes, and discuss them in depth, so that we can further reveal their important role in ESCC and provide a theoretical basis for clinical prevention, diagnosis, and individualized treatment of ESCC.
Acknowledgements
Funding: This work was supported by Sichuan Science and Technology Program (grant No. 2018SZ0199).
Footnotes
Conflicts of Interest: The authors have no conflicts of interest to declare.
References
- 1.Tao Y, Chai D, Ma L, et al. Identification of distinct gene expression profiles between esophageal squamous cell carcinoma and adjacent normal epithelial tissues. Tohoku J Exp Med 2012;226:301-11. 10.1620/tjem.226.301 [DOI] [PubMed] [Google Scholar]
- 2.Rustgi AK, El-Serag HB. Esophageal carcinoma. N Engl J Med 2014;371:2499-509. 10.1056/NEJMra1314530 [DOI] [PubMed] [Google Scholar]
- 3.Subramanian A, Tamayo P, Mootha VK, et al. Gene set enrichment analysis: a knowledge-based approach for interpreting genome-wide expression profiles. Proc Natl Acad Sci U S A 2005;102:15545-50. 10.1073/pnas.0506580102 [DOI] [PMC free article] [PubMed] [Google Scholar]
- 4.Subramanian A, Kuehn H, Gould J, et al. GSEA-P: a desktop application for Gene Set Enrichment Analysis. Bioinformatics 2007;23:3251-3. 10.1093/bioinformatics/btm369 [DOI] [PubMed] [Google Scholar]
- 5.Barrett T, Troup DB, Wilhite SE, et al. NCBI GEO: mining tens of millions of expression profiles--database and tools update. Nucleic Acids Res 2007;35:D760-5. 10.1093/nar/gkl887 [DOI] [PMC free article] [PubMed] [Google Scholar]
- 6.Gentleman RC, Carey VJ, Bates DM, et al. Bioconductor: open software development for computational biology and bioinformatics. Genome Biol 2004;5:R80. 10.1186/gb-2004-5-10-r80 [DOI] [PMC free article] [PubMed] [Google Scholar]
- 7.Gautier L, Cope L, Bolstad BM, et al. affy--analysis of Affymetrix GeneChip data at the probe level. Bioinformatics 2004;20:307-15. 10.1093/bioinformatics/btg405 [DOI] [PubMed] [Google Scholar]
- 8.Irizarry RA, Hobbs B, Collin F, et al. Exploration, normalization, and summaries of high density oligonucleotide array probe level data. Biostatistics 2003;4:249-64. 10.1093/biostatistics/4.2.249 [DOI] [PubMed] [Google Scholar]
- 9.Daves MH, Hilsenbeck SG, Lau CC, et al. Meta-analysis of multiple microarray datasets reveals a common gene signature of metastasis in solid tumors. BMC Med Genomics 2011;4:56. 10.1186/1755-8794-4-56 [DOI] [PMC free article] [PubMed] [Google Scholar]
- 10.Kanehisa M, Goto S. KEGG: kyoto encyclopedia of genes and genomes. Nucleic Acids Res 2000;28:27-30. 10.1093/nar/28.1.27 [DOI] [PMC free article] [PubMed] [Google Scholar]
- 11.MacDonald JW, Ghosh D. COPA--cancer outlier profile analysis. Bioinformatics 2006;22:2950-1. 10.1093/bioinformatics/btl433 [DOI] [PubMed] [Google Scholar]
- 12.Hu M, Liu Q, Song P, et al. Abnormal expression of the mitotic checkpoint protein BubR1 contributes to the anti-microtubule drug resistance of esophageal squamous cell carcinoma cells. Oncol Rep 2013;29:185-92. 10.3892/or.2012.2117 [DOI] [PubMed] [Google Scholar]
- 13.Tanaka K, Mohri Y, Ohi M, et al. Mitotic checkpoint genes, hsMAD2 and BubR1, in oesophageal squamous cancer cells and their association with 5-fluorouracil and cisplatin-based radiochemotherapy. Clin Oncol (R Coll Radiol) 2008;20:639-46. 10.1016/j.clon.2008.06.010 [DOI] [PubMed] [Google Scholar]
- 14.Sun B, Lin G, Ji D, et al. Dysfunction of Sister Chromatids Separation Promotes Progression of Hepatocellular Carcinoma According to Analysis of Gene Expression Profiling. Front Physiol 2018;9:1019. 10.3389/fphys.2018.01019 [DOI] [PMC free article] [PubMed] [Google Scholar]
- 15.Wang GY, Li L, Liu B, et al. Integrated bioinformatic analysis unveils significant genes and pathways in the pathogenesis of supratentorial primitive neuroectodermal tumor. Onco Targets Ther 2018;11:1849-59. 10.2147/OTT.S148776 [DOI] [PMC free article] [PubMed] [Google Scholar]
- 16.Ma Q, Liu Y, Shang L, et al. The FOXM1/BUB1B signaling pathway is essential for the tumorigenicity and radioresistance of glioblastoma. Oncol Rep 2017;38:3367-75. [DOI] [PMC free article] [PubMed] [Google Scholar]
- 17.Lee E, Pain M, Wang H, et al. Sensitivity to BUB1B Inhibition Defines an Alternative Classification of Glioblastoma. Cancer Res 2017;77:5518-29. 10.1158/0008-5472.CAN-17-0736 [DOI] [PMC free article] [PubMed] [Google Scholar]
- 18.Yuan W, Xie S, Wang M, et al. Bioinformatic analysis of prognostic value of ZW10 interacting protein in lung cancer. Onco Targets Ther 2018;11:1683-95. 10.2147/OTT.S149012 [DOI] [PMC free article] [PubMed] [Google Scholar]
- 19.Glinsky GV, Berezovska O, Glinskii AB. Microarray analysis identifies a death-from-cancer signature predicting therapy failure in patients with multiple types of cancer. J Clin Invest 2005;115:1503-21. 10.1172/JCI23412 [DOI] [PMC free article] [PubMed] [Google Scholar]
- 20.Ricke RM, Jeganathan KB, van Deursen JM. Bub1 overexpression induces aneuploidy and tumor formation through Aurora B kinase hyperactivation. J Cell Biol 2011;193:1049-64. 10.1083/jcb.201012035 [DOI] [PMC free article] [PubMed] [Google Scholar]
- 21.Ge SM, Zhan DL, Zhang SH, et al. Reverse screening approach to identify potential anti-cancer targets of dipyridamole. Am J Transl Res 2016;8:5187-98. [PMC free article] [PubMed] [Google Scholar]
- 22.Győrffy B, Bottai G, Lehmann-Che J, et al. TP53 mutation-correlated genes predict the risk of tumor relapse and identify MPS1 as a potential therapeutic kinase in TP53-mutated breast cancers. Mol Oncol 2014;8:508-19. 10.1016/j.molonc.2013.12.018 [DOI] [PMC free article] [PubMed] [Google Scholar]
- 23.Zhang L, Shi R, He C, et al. Oncogenic B-Raf(V600E) abrogates the AKT/B-Raf/Mps1 interaction in melanoma cells. Cancer Lett 2013;337:125-32. 10.1016/j.canlet.2013.05.029 [DOI] [PubMed] [Google Scholar]
- 24.Slee RB, Grimes BR, Bansal R, et al. Selective inhibition of pancreatic ductal adenocarcinoma cell growth by the mitotic MPS1 kinase inhibitor NMS-P715. Mol Cancer Ther 2014;13:307-15. 10.1158/1535-7163.MCT-13-0324 [DOI] [PMC free article] [PubMed] [Google Scholar]
- 25.Liu X, Liao W, Yuan Q, et al. TTK activates Akt and promotes proliferation and migration of hepatocellular carcinoma cells. Oncotarget 2015;6:34309-20. [DOI] [PMC free article] [PubMed] [Google Scholar]
- 26.Iinuma H, Fukushima R, Inaba T, et al. Phase I clinical study of multiple epitope peptide vaccine combined with chemoradiation therapy in esophageal cancer patients. J Transl Med 2014;12:84. 10.1186/1479-5876-12-84 [DOI] [PMC free article] [PubMed] [Google Scholar]
- 27.Kono K, Iinuma H, Akutsu Y, et al. Multicenter, phase II clinical trial of cancer vaccination for advanced esophageal cancer with three peptides derived from novel cancer-testis antigens. J Transl Med 2012;10:141. 10.1186/1479-5876-10-141 [DOI] [PMC free article] [PubMed] [Google Scholar]
- 28.Kono K, Mizukami Y, Daigo Y, et al. Vaccination with multiple peptides derived from novel cancer-testis antigens can induce specific T-cell responses and clinical responses in advanced esophageal cancer. Cancer Sci 2009;100:1502-9. 10.1111/j.1349-7006.2009.01200.x [DOI] [PMC free article] [PubMed] [Google Scholar]
- 29.Yamazumi Y, Kamiya A, Nishida A, et al. The transmembrane nucleoporin NDC1 is required for targeting of ALADIN to nuclear pore complexes. Biochem Biophys Res Commun 2009;389:100-4. 10.1016/j.bbrc.2009.08.096 [DOI] [PubMed] [Google Scholar]
- 30.Ren Y, Diao F, Katari S, et al. Functional study of a novel missense single-nucleotide variant of NUP107 in two daughters of Mexican origin with premature ovarian insufficiency. Mol Genet Genomic Med 2018;6:276-81. 10.1002/mgg3.345 [DOI] [PMC free article] [PubMed] [Google Scholar]
- 31.Lai TH, Wu YY, Wang YY, et al. SEPT12-NDC1 Complexes Are Required for Mammalian Spermiogenesis. Int J Mol Sci 2016;17(11). 10.3390/ijms17111911 [DOI] [PMC free article] [PubMed] [Google Scholar]
- 32.Jagot-Lacoussiere L, Faye A, Bruzzoni-Giovanelli H, et al. DNA damage-induced nuclear translocation of Apaf-1 is mediated by nucleoporin Nup107. Cell Cycle 2015;14:1242-51. 10.1080/15384101.2015.1014148 [DOI] [PMC free article] [PubMed] [Google Scholar]
- 33.Alanee S, Delfino K, Wilber A, et al. Single nucleotide variant in Nucleoporin 107 may be predictive of sensitivity to chemotherapy in patients with ovarian cancer. Pharmacogenet Genomics 2017;27:264-9. 10.1097/FPC.0000000000000288 [DOI] [PMC free article] [PubMed] [Google Scholar]
- 34.Rosti RO, Sotak BN, Bielas SL, et al. Homozygous mutation in NUP107 leads to microcephaly with steroid-resistant nephrotic condition similar to Galloway-Mowat syndrome. J Med Genet 2017;54:399-403. 10.1136/jmedgenet-2016-104237 [DOI] [PubMed] [Google Scholar]
- 35.Park E, Ahn YH, Kang HG, et al. NUP107 mutations in children with steroid-resistant nephrotic syndrome. Nephrol Dial Transplant 2017;32:1013-7. [DOI] [PubMed] [Google Scholar]
- 36.Shen Q, Yu M, Jia JK, et al. Possible Molecular Markers for the Diagnosis of Pancreatic Ductal Adenocarcinoma. Med Sci Monit 2018;24:2368-76. 10.12659/MSM.906313 [DOI] [PMC free article] [PubMed] [Google Scholar]
- 37.Preston CC, Wyles SP, Reyes S, et al. NUP155 insufficiency recalibrates a pluripotent transcriptome with network remodeling of a cardiogenic signaling module. BMC Syst Biol 2018;12:62. 10.1186/s12918-018-0590-x [DOI] [PMC free article] [PubMed] [Google Scholar]
- 38.Zhang X, Chen S, Yoo S, et al. Mutation in nuclear pore component NUP155 leads to atrial fibrillation and early sudden cardiac death. Cell 2008;135:1017-27. 10.1016/j.cell.2008.10.022 [DOI] [PubMed] [Google Scholar]
- 39.De Keersmaecker K, Porcu M, Cox L, et al. NUP214-ABL1-mediated cell proliferation in T-cell acute lymphoblastic leukemia is dependent on the LCK kinase and various interacting proteins. Haematologica 2014;99:85-93. 10.3324/haematol.2013.088674 [DOI] [PMC free article] [PubMed] [Google Scholar]


