

Abstract
The mechanisms of mitochondrial dysfunction in Alzheimer's disease are incompletely understood. Using two‐photon fluorescence lifetime microscopy of the coenzymes, NADH and NADPH, and tracking brain oxygen metabolism with multi‐parametric photoacoustic microscopy, we show that activation of lysosomal mechanistic target of rapamycin complex 1 (mTORC1) by insulin or amino acids stimulates mitochondrial activity and regulates mitochondrial DNA synthesis in neurons. Amyloid‐β oligomers, which are precursors of amyloid plaques in Alzheimer's disease brain and stimulate mTORC1 protein kinase activity at the plasma membrane but not at lysosomes, block this Nutrient‐induced Mitochondrial Activity (NiMA) by a mechanism dependent on tau, which forms neurofibrillary tangles in Alzheimer's disease brain. NiMA was also disrupted in fibroblasts derived from two patients with tuberous sclerosis complex, a genetic disorder that causes dysregulation of lysosomal mTORC1. Thus, lysosomal mTORC1 couples nutrient availability to mitochondrial activity and links mitochondrial dysfunction to Alzheimer's disease by a mechanism dependent on the soluble building blocks of the poorly soluble plaques and tangles.
Keywords: Alzheimer's disease, amyloid‐β oligomers, mitochondria, mTOR, tau
Subject Categories: Autophagy & Cell Death, Metabolism, Neuroscience
Introduction
Mitochondria play a critical role in cellular physiology by producing ATP, and regulating lipid and calcium homeostasis, clearance of reactive oxygen species (ROS), cell death, and other processes (Nunnari & Suomalainen, 2012). These phenomena require coordinating cellular energy demands with nutrient availability, and with mitochondrial biogenesis and degradation. Not surprisingly, mitochondrial malfunctioning abounds in type 2 diabetes (De Felice & Ferreira, 2014), cancer (Vyas et al, 2016), and neurodegenerative disorders, like Alzheimer's disease (AD; DuBoff et al, 2013; Burté et al, 2014).
While mitochondrial impairment is a well‐known feature of AD neurons, studying mitochondrial activity in live cells and animals has been a challenge due to limitations in imaging dynamic metabolic processes in real time. There is evidence that amyloid‐β oligomers (AβOs), which help initiate AD pathogenesis and are the soluble building blocks of the poorly soluble amyloid plaques that accumulate in AD brain, suppress mitochondrial fast axonal transport (Pigino et al, 2009), cause fragmentation of neuronal mitochondria (Wang et al, 2009), and directly affect mitochondrial dynamics at synapses by interacting with mitochondrial proteins (Manczak et al, 2006; Hansson Petersen et al, 2008). Together, these effects of AβOs lead to mitochondrial mislocalization, disrupted ATP production, impaired ROS clearance, excess cytoplasmic calcium, and oxidative stress. AβO‐induced mitochondrial dysfunction thereby contributes to progressive loss of synaptic activity and neuron death, which together account for the behavioral deficits associated with AD (Wang et al, 2009; Calkins et al, 2011).
mTORC1 is a multi‐subunit protein complex that includes the serine–threonine protein kinase, mTOR, which also functions as the catalytic subunit of a related multi‐protein complex, mTORC2. Together, mTORC1 and mTORC2 respond to cell surface receptors and transporters that detect insulin, growth factors, and nutrients, like amino acids (Saxton & Sabatini, 2017). The two mTOR complexes coordinately regulate fundamental cellular responses, such as protein synthesis, cell growth, cell cycle progression, and autophagy. mTOR kinase activity is elevated in AD brain (Oddo, 2012), and increasing or decreasing mTOR activity in AD model mice, respectively, worsens or ameliorates AD‐like pathology and behavioral deficits (Caccamo et al, 2010; Caccamo et al, 2013). Although mTOR complexes and their regulators have been found in various subcellular compartments, including the plasma membrane (PM), nucleus, lysosomes, the Golgi complex, and peroxisomes (Betz & Hall, 2013; Arias et al, 2015; Ebner et al, 2017; Saxton & Sabatini, 2017), how the subcellular distribution of the mTOR complexes affects specific cellular responses is poorly understood.
We recently identified an mTOR‐dependent signaling network that leads to neuronal death in AD (Norambuena et al, 2017). We showed that AβOs activate mTORC1 at the PM in neurons, which leads to cell cycle re‐entry (CCR), a frequent prelude to the death of neurons (Arendt et al, 2010; Norambuena et al, 2017), and that this effect of AβOs can be blocked by insulin and nutrients, like amino acids (Norambuena et al, 2017). These effects of AβOs on neuronal mTORC1 reinforce previous observations linking metabolic disorder to insulin resistance and AD pathogenesis (De Felice & Ferreira, 2014) and prompted us to test whether mTORC1 dysregulation contributes to mitochondrial dysfunction in AD.
To that end, we adapted a two‐photon fluorescence lifetime (2P‐FLIM) assay for label‐free imaging of mitochondrial activity in live cells by measuring fluorescence lifetimes of the fractions of free (a1%) and enzyme‐bound (a2%) mitochondrial coenzymes, NADH and NADPH (Lakowicz, 2006; Alam et al, 2017; Wallrabe et al, 2018). Using this assay, along with multi‐parametric photoacoustic microscopy (MP‐PAM; Ning et al, 2015), we show that activation of lysosome‐associated mTORC1 by insulin or amino acids in cultured neurons triggers rapid, Nutrient‐induced Mitochondrial Activity (NiMA) and increases oxygen consumption in live mouse brain. NiMA involves neither mTORC1 association with mitochondria nor mTORC1‐mediated regulation of mRNA translation or protein synthesis. Importantly, NiMA is strongly inhibited by AβO‐induced activation of mTORC1 at the PM by a mechanism dependent on soluble tau, the precursor protein of the poorly soluble neurofibrillary tangles that form in AD brain. We also found NiMA to be defective in fibroblasts derived from patients with tuberous sclerosis, a genetic disorder that causes proliferation of benign tumors in brain and other organs because of dysregulated lysosomal mTORC1. Together, these results emphasize the critical importance of normal mTOR signaling and NiMA for neuronal health, and how their breakdown can serve as a seminal step in AD pathogenesis.
Results
Insulin and amino acids trigger mitochondrial activity in vitro and in vivo
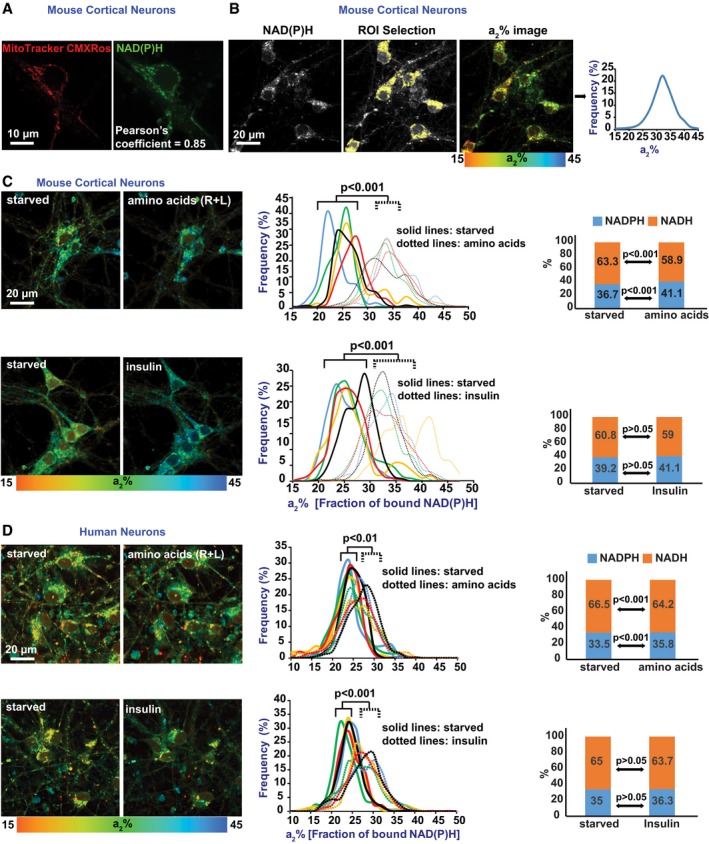
NADH and NADPH exhibit low‐intensity, spectrally indistinguishable fluorescence that can be readily visualized in cells, including neurons, as small puncta that co‐localize extensively with mitochondria (Fig 1A). The fluorescence lifetimes of these coenzymes are known to increase several‐fold, from 0.3–0.8 ns to 1.0–6.5 ns, upon binding to enzyme partners, which signifies increased ATP production by NADH, and stimulation of various biosynthetic pathways and antioxidant activity for NADPH (Blacker et al, 2014). To analyze mitochondrial activity in live neurons, we used 2P‐FLIM to monitor NAD(P)H lifetimes and their bound fraction in perikarya of wild‐type (WT) mouse cortical neurons and human neurons differentiated from neuronal precursor cells (Fig 1A–D). Following serum starvation in Hank's balanced salt solution for 2 hours, individual fields of view were assayed by 2P‐FLIM before and 30 min after stimulation of the cells with either insulin or a mixture of the amino acids, arginine and lysine (R + L). Both insulin and the amino acids induced an ~30% increase in enzyme‐bound NAD(P)H (a2%), signifying a rise in mitochondrial activity (Fig 1C and D; left and middle panels).
Figure 1. 2P‐FLIM reveals nutrient control of neuronal mitochondrial activity.
-
AThe intrinsic fluorescence of NAD(P)H co‐localizes extensively with mitochondria (marked by MitoTracker CMXRos).
-
B2P‐FLIM detects the fraction of NAD(P)H bound to enzyme partners (a2%).
-
C, Da2% values (starved, and after insulin or R + L addition) were recorded pixel by pixel for mouse cortical (C) and human (D) neurons. Each colored line in the center panel graphs refers to a single field of view containing 2–15 cells, and each pair of solid and dotted lines (same color) refers to the same field of view before and after stimulation, respectively. Using the same raw data, the relative contributions of NADH and NADPH to the total a2% values were calculated (Blacker et al, 2014) and are shown in the right panel bar graphs. NADH and NAD(P)H contributed an average of 63 and 37%, respectively, of the total a2% values. All statistical analyses were performed using Student's two‐tailed unpaired t‐tests.
Although the excitation and emission of NADH and NADPH cannot be spectrally separated, their distinct fluorescence lifetimes enable them to be discriminated from each other by 2P‐FLIM (Blacker et al, 2014). Accordingly, we determined the relative contributions of each coenzyme to total measured fluorescence lifetimes before and after insulin or R + L stimulation, and found that on average NADH accounted for 63% of the observed fluorescence lifetime signals, while the remaining 37% was due to NADPH. A slight, but significant decrease in the NADH/NADPH ratio was observed after addition of R + L, but not after insulin addition (Fig 1C and D; right panels). Thus, the NiMA response is dominated by NADH signals and predominantly reflects mitochondrial oxidative pathways.
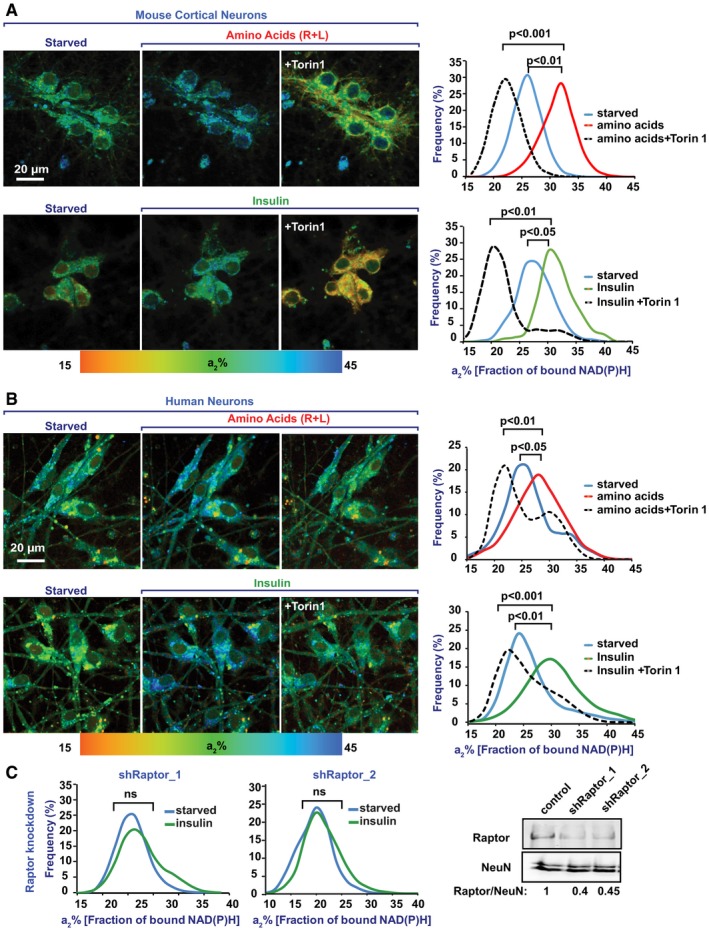
As insulin and R + L trigger lysosomal mTORC1 catalytic activity (Saxton & Sabatini, 2017), we challenged NiMA under conditions in which mTORC1 activity was inhibited by Torin1 (Liu et al, 2010) or by shRNA‐mediated knockdown of Raptor, an essential mTORC1 subunit. Robust NiMA was observed 30 minutes after addition of insulin or R + L to starved mouse cortical or human neurons, and then Torin1 was added. Thirty minutes later, the enzyme‐bound NAD(P)H (a2%) dropped to levels below those observed for starved cells prior to insulin or R + L addition (Fig 2A and B). Likewise, shRNA knockdown of Raptor in mouse cortical neurons blocked insulin‐induced NiMA (Fig 2C). Together, these results indicate that NiMA is mTORC1‐dependent.
Figure 2. Nutrient‐mediated regulation of mitochondrial activity in cultured neurons depends on mTORC1.
-
A, BWild‐type (WT) mouse cortical neurons cultured for 10 days in vitro (A) and human neurons differentiated in culture for 30 days from ReNcell VM neuronal progenitor cells (B) were serum‐starved in Hank's balanced salt solution for 2 h. Next, the cells were imaged immediately (starved), after which either amino acids (R + L) or insulin was added. Thirty minutes later, the cells were imaged again. Finally, the mTOR inhibitor, Torin1, was added, and after an additional 30 min, the cells were imaged for the last time. Histograms represent changes in the fraction of enzyme‐bound NAD(P)H (a2%) for each condition. Note that insulin and amino acids significantly increased the a2% values, which was reversed by Torin1‐mediated inhibition of mTORC1. Average data from five fields of view per condition are shown. Statistical analyses were performed using Student's two‐tailed unpaired t‐test.
-
CRaptor‐depleted, WT cortical neurons were imaged by 2P‐FLIM before and 30 minutes after treatment with insulin. Inhibiting mTORC1 by depleting Raptor with shRNA made mitochondria insensitive to insulin. Shown here are average data from four fields of view of a single replicate out of a total of three replicates. Western blots are representative of three independent assays. Statistical analyses were performed using Student's two‐tailed unpaired t‐test.
Source data are available online for this figure.
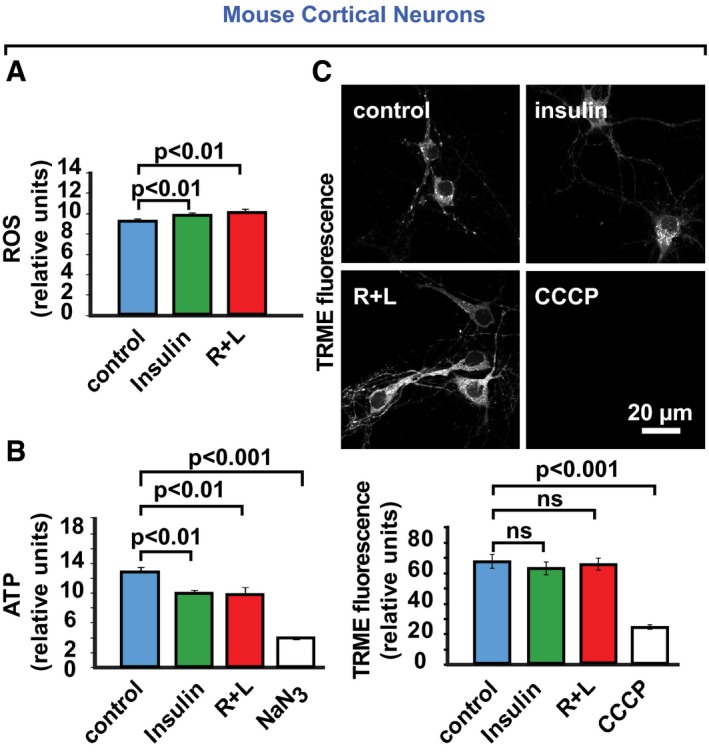
To evaluate the NiMA‐regulated, mitochondrial oxidative pathways in greater detail, we measured nutrient‐induced changes in reactive oxygen species (ROS), ATP production, and oxygen consumption (Suomalainen & Battersby, 2018). The mitochondrial superoxide radical fluorescence sensor, MitoSox Red, indicated an ~20% increase in mitochondrial ROS 1 hour after insulin or R + L stimulation of cultured human (Fig 3A) and mouse (Fig EV1A) neurons. Surprisingly, total cellular ATP levels decreased by ~40% under these conditions (Figs 3A and EV1B), implying that ATP consumption exceeded production after nutrient stimulation. This change paralleled an ~10% increase in extracellular oxygen consumption (Fig 3A). No changes in the mitochondrial membrane potential were observed during the time‐course of these experiments, as measured by tetramethylrhodamine methyl ester (TRME) fluorescence (Fig EV1C).
Figure 3. Lysosomal mTORC1 regulates mitochondrial activity in cultured neurons and in brain.
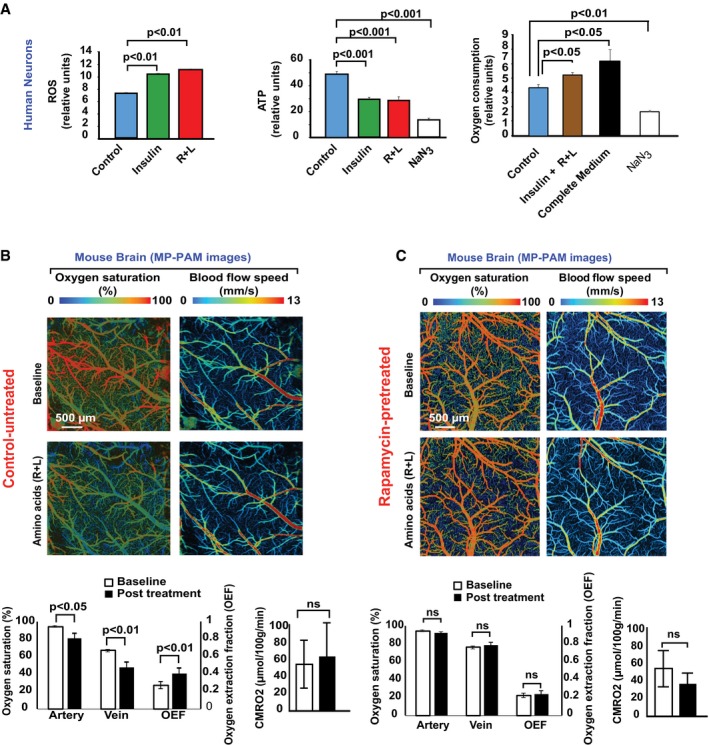
- Human neurons differentiated in culture for 30 days from ReNcell VM neuronal progenitor cells were serum‐starved in Hank's balanced salt solution (HBSS) for 2 h. Next, amino acids (R + L), insulin, insulin + R + L, or the oxidative phosphorylation inhibitor, NaN3, were added, or the HBSS was replaced with complete medium. One hour later, cellular reactive oxygen species (ROS), ATP levels, and oxygen consumption were measured. The data were collected from three independent assays in which each experimental condition contained six to eight replicates. Error bars represent ± s.e.m. Statistical analyses were performed using Student's two‐tailed unpaired t‐test.
- MP‐PAM imaging of wild‐type (WT) mouse cerebral cortex through an open‐skull window 1 h after topical application of amino acids (R + L). A decrease in blood oxygenation of the cortical vasculature was observed, indicating elevated oxygen extraction and consumption due to upregulation of mitochondrial activity. Data were obtained from three mice, each of which was measured once for O2 saturation, oxygen extraction fraction (OEF), and cerebral metabolic rate of oxygen (CMRO2). Error bars represent ± s.e.m.
- MP‐PAM imaging of WT mouse cerebral cortex through an open‐skull window beginning at baseline, which corresponded to 30 min after suppression of mTORC1 activity by a single topical application of 1 μM rapamycin. Baseline levels of O2 saturation and blood flow speed were recorded, after which R + L was applied to the open‐skull window. One hour later, O2 saturation and blood flow speed were recorded again. Data were obtained from four mice, each of which was measured once for O2 saturation, oxygen extraction fraction (OEF), and cerebral metabolic rate of oxygen (CMRO2). Note that no significant changes in O2 saturation or OEF were observed after R + L stimulation, in contrast to what was observed in the absence of rapamycin (Fig 3B). Error bars represent ± s.e.m.
Figure EV1. Nutrients control neuronal mitochondrial activity.
-
A, BWT mouse cortical neurons were serum‐starved in Hank's balanced salt solution for 2 h. Next, amino acids (R + L), insulin, or the oxidative phosphorylation inhibitor, NaN3, was added, and 1 h later, cellular ROS and ATP levels were measured. Error bars represent mean ± s.e.m. Statistical analyses were performed using Student's two‐tailed unpaired t‐test and are representative of three independent assays.
-
CIn otherwise identical experiments, the mitochondrial membrane potential indicator, tetramethylrhodamine ethyl ester (TMRE) was added 1 hour after the amino acids or insulin, or 20 min after the oxidative phosphorylation inhibitor, carbonyl cyanide m‐chlorophenyl hydrazone (CCCP) was added. Thirty minutes later, the cultures were washed to remove unbound TMRE, and cellular TMRE fluorescence was then imaged and quantified. Error bars represent mean ± s.e.m.
We next sought evidence for NiMA in vivo by using MP‐PAM (Cao et al, 2017) to measure oxygen metabolic responses in live mouse brain. MP‐PAM imaging through a cranial window enables simultaneous quantification of hemoglobin concentration (CHb), oxygen saturation (sO2), and cerebral blood flow (CBF; Ning et al, 2015). This approach revealed significant decreases in both arterial and venous sO2, but no significant change in CBF in response to the R + L treatment (Fig 3B). These hemodynamic responses resulted in increased oxygen extraction fraction (OEF), but no significant rise in cerebral metabolic rate of oxygen (CMRO2; Fig 3B). Pre‐application of the mTORC1 inhibitor, rapamycin, prevented all of the statistically significant effects of R+L on MP‐PAM‐measurable parameters (Fig 3C), indicating that mTORC1 controls NiMA not only in vitro, but in vivo as well.
NiMA and mRNA translation are independently regulated by lysosomal mTORC1
Because mTORC1 protein kinase activity is associated with multiple subcellular compartments, most notably lysosomes and the PM (Saci et al, 2011; Betz & Hall, 2013; Menon et al, 2014; Saxton & Sabatini, 2017), we sought to determine where the mTORC1 that regulates NiMA is localized. Accordingly, we forced mTORC1 to accumulate preferentially on lysosomes or PM by lentiviral expression of Flag‐tagged Raptor fused either to a lysosome‐targeting region of Rheb (Flag‐Raptor‐Rheb15) or the PM‐targeting region of H‐Ras (Flag‐Raptor‐H‐Ras25; Sancak et al, 2010). NiMA was stimulated by insulin by ~30% in non‐transduced neurons and neurons expressing Flag‐Raptor‐Rheb15, but was insensitive to insulin in neurons expressing Flag‐Raptor‐H‐Ras25 (Fig 4A). These observations implicate lysosomes as the mTORC1 activation site that leads to NiMA.
Figure 4. Lysosomal, but not mitochondrial mTORC1 controls NiMA.
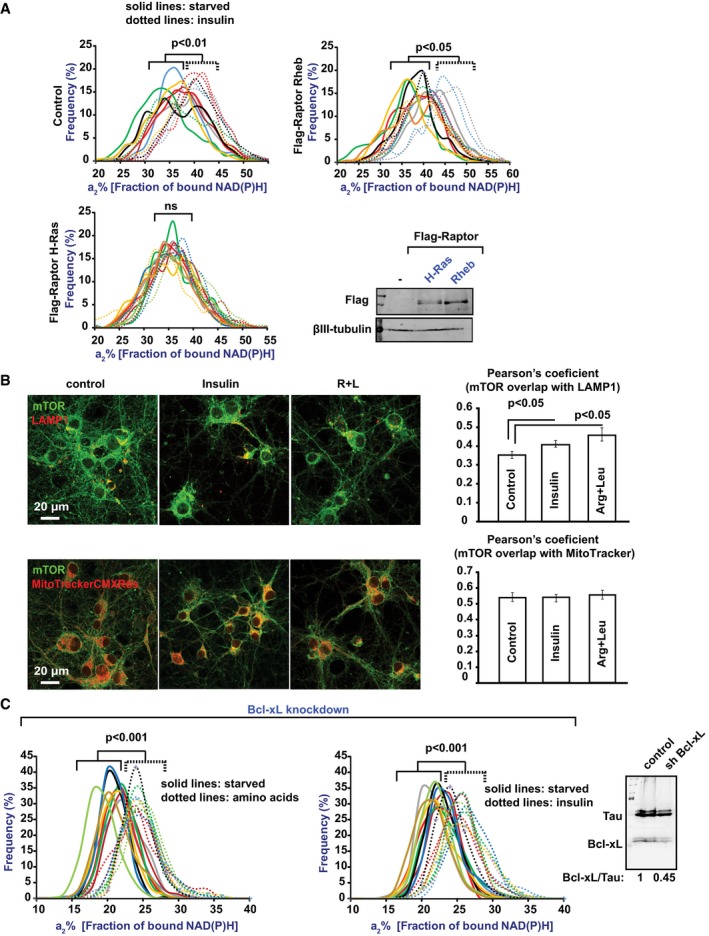
- Human neurons differentiated in culture for 30 days from ReNcell VM neuronal progenitors (Control), or otherwise identical cells expressing Flag‐Raptor fused to either the plasma membrane targeting signal of H‐Ras or the lysosomal targeting signal of Rheb were serum‐starved in Hank's balanced salt solution for 2 h and then imaged by 2P‐FLIM before and 30 min after addition of insulin. Each colored line refers to a single field of view containing 5–15 cells, and each pair of solid and dotted lines (same color) refers to the same field of view. Statistical analyses were performed using Student's two‐tailed unpaired t‐test (ns: not significant). Expression of the Flag‐Raptor fusion proteins was confirmed by Western blotting (right panel). Note that NiMA was supported when mTORC1 was targeted to lysosomes (Flag‐Raptor Rheb15), but not to the plasma membrane (Flag‐Raptor H‐Ras25). Western blots are representative of three independent assays.
- Mouse cortical neurons starved in Hank's balanced salt solution for 2 h were treated with AβOs, insulin, or amino acids (R + L) for 30 min, and then were fixed and double‐labeled with anti‐mTOR, and either anti‐LAMP1 or MitoTracker CMXRos. Error bars represent ± s.e.m. Data are representative of three independent assays.
- Reducing Bcl‐xL expression in WT mouse cortical neurons does not affect NiMA. Western blots are representative of three independent assays. Statistical analyses were performed using Student's two‐tailed unpaired t‐test.
Source data are available online for this figure.
There is also evidence that mTOR controls mitochondrial activity by direct binding to the mitochondrial protein, Bcl‐xL (Ramanathan & Schreiber, 2009), and by regulation of mitochondrial biogenesis and function through a translationally controlled mechanism (Morita et al, 2013). To test whether NiMA entails mTOR interactions with mitochondria in cultured mouse cortical neurons, we first analyzed nutrient‐induced changes in the co‐localization of mTOR with the mitochondrial marker, MitoTracker CMXRos, and with the lysosomal marker, LAMP1. In agreement with others (Menon et al, 2014) and our previous work (Norambuena et al, 2017), we found that insulin or R + L causes ~15–30% increases in the level of lysosomal mTOR. In contrast, nutrients did not induce recruitment of mTOR to mitochondria (Fig 4B). Next, we used 2P‐FLIM to analyze NiMA in mouse neurons depleted of Bcl‐xL by shRNA. As shown in Fig 4C, the mitochondrial responses to either insulin or R + L were unaffected by Bcl‐xL knockdown. These findings imply that NiMA does not require any of the known direct interactions of mTORC1 with mitochondria.
One of the main functions of mTORC1 is the regulation of mRNA translation. This process involves mTORC1‐mediated control of two main downstream targets, the 70 kDa S6 ribosomal protein kinase (S6K) (Saxton & Sabatini, 2017) and the translation regulator, eukaryotic initiation factor 4E (eIF4E), whose activity is inhibited by its binding to 4EBPs, which in turn are regulated by mTORC1 phosphorylation (Ma & Blenis, 2009). As the 4EBP1‐eIF4E interaction has been shown to control mitochondrial biogenesis (Morita et al, 2013), we sought to explore whether mRNA translational functions of mTORC1 are upstream of NiMA. We found that NiMA is unaffected by either antisense‐mediated reduction of S6K or eIF4E (Fig EV2A), or pharmacological inhibition of S6K (Fig EV2B). Furthermore, exposure of neurons to AβOs, insulin, or R + L did not cause detectable changes in 35S‐methionine incorporation into newly synthesized proteins (Fig EV2C). We thus conclude that NiMA and protein synthesis (Morita et al, 2013) are regulated independently by mTORC1.
Figure EV2. NiMA occurs independently of mTOR‐mediated regulation of transcription and translation.
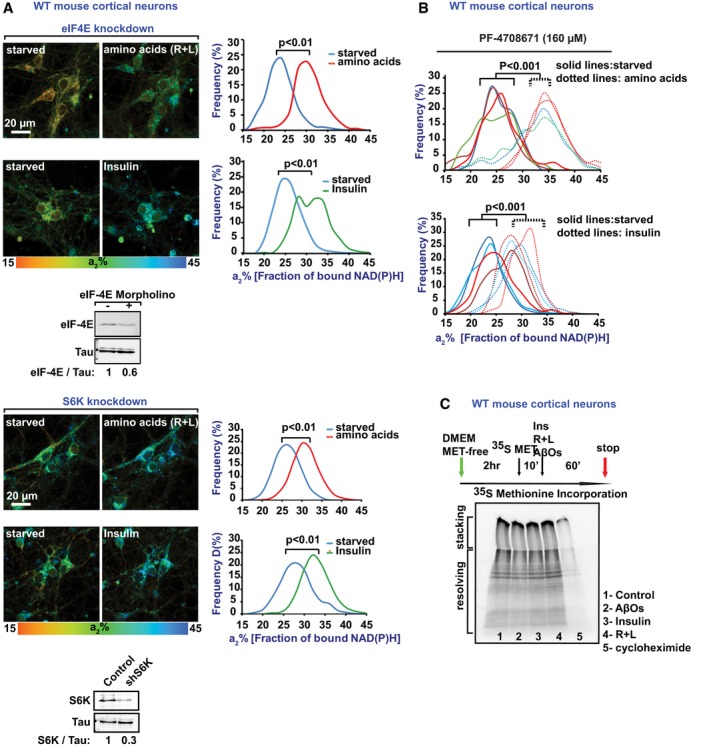
- Reducing expression in cultured mouse neurons of eIF4E (upper panel) or S6K (lower panel), which respectively regulate mRNA and protein synthesis, did not affect NiMA. Average data from three fields of view per condition are shown. Western blots are representative of three independent assays. Statistical analyses were performed using Student's two‐tailed unpaired t‐test.
- Pharmacological inhibition of S6K with PF‐4708671 did not affect NiMA. Each colored line refers to a single field of view containing 2–15 cells, and each pair of solid and dotted lines (same color) refers to the same field of view. Statistical analyses were performed using Student's two‐tailed unpaired t‐test.
- NiMA does not obviously change protein synthesis in WT mouse cortical neurons (10 days in vitro), as judged by SDS gel autoradiography. The autoradiogram image is representative of two independent experiments.
Source data are available online for this figure.
NiMA regulates mitochondrial DNA replication
Normal mitochondrial functioning depends on coordinated expression of > 1,000 nuclear‐encoded genes and those encoded by mitochondrial DNA (mtDNA; Nunnari & Suomalainen, 2012; Suomalainen & Battersby, 2018). As defects in mtDNA maintenance have been linked to aging and neurodegeneration (Trifunovic et al, 2004; Manczak et al, 2011; Nunnari & Suomalainen, 2012), we investigated NiMA's role in mtDNA maintenance. To visualize nucleoids (Lewis et al, 2016), which correspond to mtDNA–protein complexes representing mitochondrial inheritance units (Garrido et al, 2003), we incubated live mouse neurons with 5‐ethyl‐2′‐deoxyuridine (EdU) for 3 h in the absence or presence of a mixture of insulin and R + L (I/R/L). EdU is a thymidine analog that readily incorporates into DNA during active DNA synthesis. EdU can be detected by a copper‐catalyzed reaction that covalently links (“clicks”) the alkyne group in EdU to the picolyl azide group in an Alexa Fluor dye (Rostovtsev et al, 2002; Tornøe et al, 2002; Salic & Mitchison, 2008). Then, mitochondria were labeled with Mitotracker CMXRos, and Alexa Fluor 647‐EdU‐tagged nucleoids were revealed by copper click chemistry by using a Click‐iT Plus EdU Kit. The vast majority of EdU uptake was in perikaryal mitochondria, and almost all neurons had 1–20 EdU‐positive foci (Fig 5A). Quantitation of EdU‐Alexa Fluor 647 fluorescence revealed that I/R/L diminished EdU uptake by nearly 60% compared to controls, but AβOs increased EdU uptake by ~10% and completely blocked the inhibitory effect of I/R/L (Fig 5B).
Figure 5. NiMA control of mitochondrial DNA replication in neurons is disrupted by AβOs.
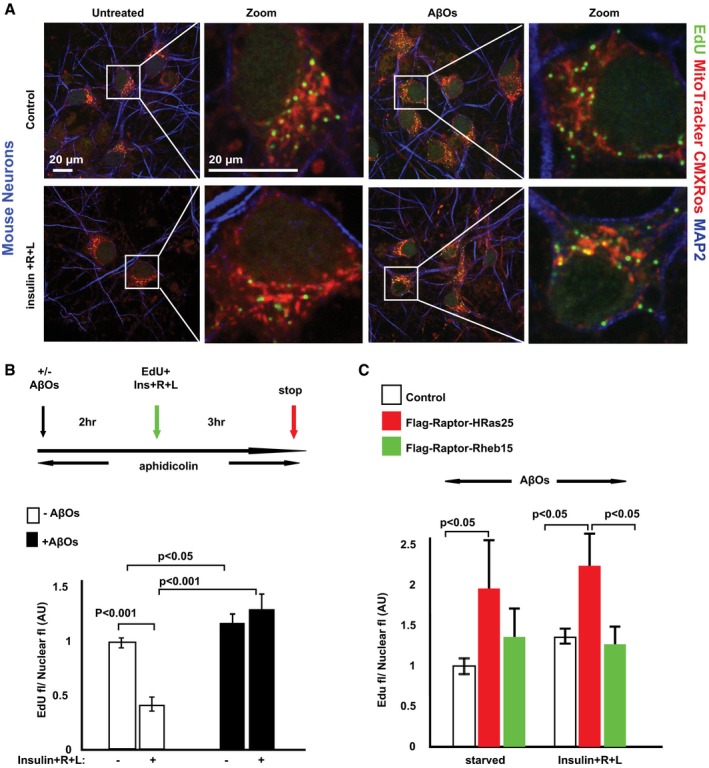
- DNA replication in mitochondrial replisomes was detected in mouse cortical neurons after a 3‐h pulse of the thymidine analog, EdU. Cells were labeled additionally with the mitochondrial marker, MitoTracker CMXRos, and with an antibody to the neuron marker, MAP2.
- Quantification of EdU uptake into mouse cortical neuron replisomes showed that nutrients inhibit mtDNA replication by ˜60%, an effect that was blocked by AβOs. Error bars represent ± s.e.m. Statistical analyses were performed using Student's two‐tailed unpaired t‐test and are representative of three independent assays.
- WT mouse cortical neurons expressing either Flag‐Raptor H‐Ras25 or Flag‐Raptor Rheb15 were serum‐starved in AβO‐containing Hank's balanced salt solution for 2 h. Next, the cells were pulse‐labeled for 3 h with EdU. Note that forcing mTORC1 to the plasma membrane (Flag‐Raptor H‐Ras25) yielded an ˜80% increase in EdU incorporation into mtDNA in the presence of AβOs regardless of whether or not the neurons had been stimulated with insulin + R + L. In contrast, EdU uptake into mitochondrial replisomes was not stimulated by AβOs in neurons whose mTORC1 was forced to lysosomes (Flag‐Raptor‐Rheb15). Error bars represent ± s.e.m.
These effects of AβOs were driven by activation of mTORC1 at the PM, as neurons expressing Flag‐Raptor‐H‐Ras25 by lentiviral transduction showed an ~80% increase in EdU incorporation into mtDNA in the presence of AβOs regardless of whether or not they had been stimulated with I/R/L (Fig 5C). In contrast, EdU uptake into mitochondrial nucleoids was not stimulated by AβOs in cells transduced to express Flag‐Raptor‐Rheb15 to force mTORC1 localization to lysosomes (Fig 5C). Altogether, these observations indicate that lysosomal mTORC1 directly connects insulin and amino acid availability to perikaryal mtDNA synthesis.
NiMA is disrupted by AβOs by a tau‐dependent mechanism
Recent advances in 3D cell culture enabled modeling of human AD progression in vitro (Choi et al, 2014) and allowed us to investigate corresponding mitochondrial dysfunction. Using 2P‐FLIM, we monitored NiMA during spontaneous accumulation of extracellular Aβ around human neurons derived from immortalized neuronal precursor cells. Unmodified ReNcell VM cells were co‐cultured and differentiated in 3D matrices with otherwise identical cells that stably expressed human amyloid precursor protein with the AD‐causing Swedish (K670N/M671L) and London (V717I) mutations plus GFP, and secrete Aβ (ReN‐APPSL cells), or with control cells stably transfected to express only GFP (ReN‐GFP cells) (Choi et al, 2014). After 60 days in vitro (DIV), complete inhibition of NiMA was detected in unmodified ReNcell VM cells that were co‐cultured with ReN‐APPSL cells, but not with ReN‐GFP cells (Fig 6A).
Figure 6. AβOs block NiMA by disrupting mTORC1 activation al lysosomes.
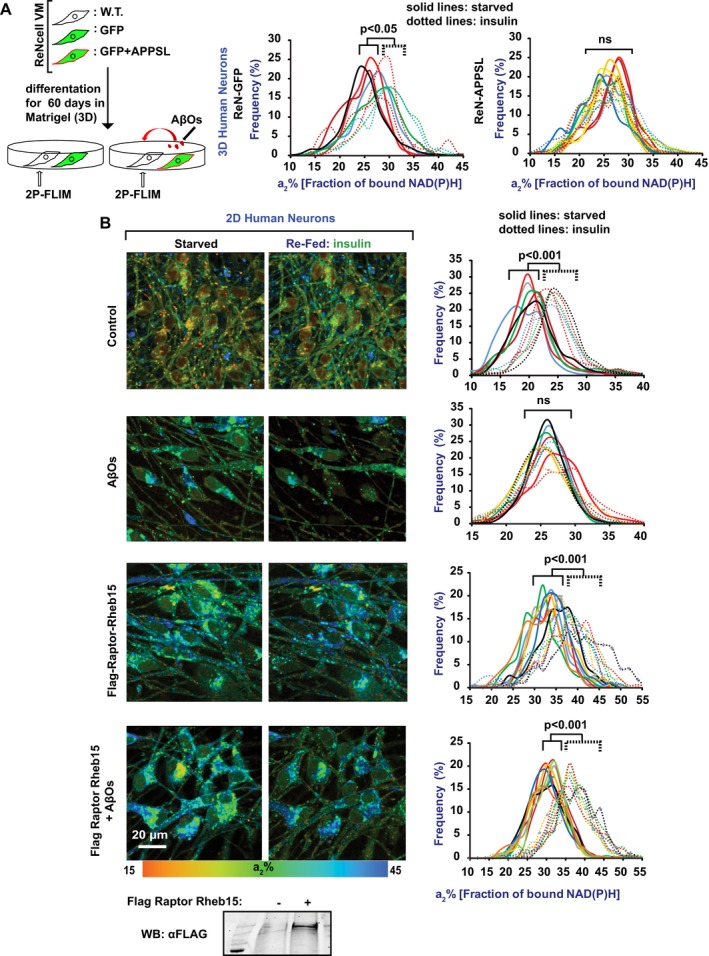
- Unmodified ReNcell VM human neuronal progenitor cells were co‐plated with comparable ReN‐GFP or ReN‐APPSL cells into three‐dimensional Matrigel matrices and differentiated into neurons for 60 days. Cytosolic GFP is produced by both ReN‐GFP and ReN‐APPSL cells, and the latter also produce pathogenic human APP with the Swedish and London mutations, and secrete Aβ that becomes entrapped in the Matrigel (Choi et al, 2014). Following neuronal differentiation, 2P‐FLIM was used to monitor NiMA in the ReNcell VM neurons, which were discriminated from ReN‐GFP and ReN‐APPSL neurons because they lack GFP. Note that NiMA was observed in ReNcell VM neurons when they were co‐cultured with ReN‐GFP neurons, but not when they were co‐cultured with ReN‐APPSL neurons. Each colored line refers to a single field of view containing 5–15 cells, and each pair of solid and dotted lines of the same color refers to the same field of view. Statistical analyses were performed using Student's two‐tailed unpaired t‐test.
- ReNcell VM cells were differentiated into neurons for 30 days in 2D cultures. Subsequent AβO exposure for 16 hours blocked NiMA, but expression of Flag‐Raptor‐Rheb15, which forces mTORC1 to lysosomes, prevented NiMA inhibition by AβOs. Each colored line refers to a single field of view containing 5–15 cells, and each identically colored pair of solid and dotted lines refers to the same field of view. Flag‐Raptor‐Rheb15 expression was confirmed by Western blotting. Statistical analyses were performed using Student's two‐tailed unpaired t‐test. Western blots are representative of three independent assays.
Source data are available online for this figure.
To test whether the NiMA‐inhibiting factors released by ReN‐APPSL cells might correspond to AβOs, control human neurons that had been grown for 30 DIV in 2D cultures were exposed for 16–18 h to AβOs assembled from synthetic Aβ1‐42. NiMA was blocked by the AβOs (Fig 6B). Remarkably, AβOs did not prevent NiMA when mTOR was forced to lysosomes by Flag‐Raptor‐Rheb15 expression (Fig 6B). Because AβOs are known to activate mTORC1 at the PM, but not at lysosomes (Norambuena et al, 2017), we conclude that NiMA prevention by AβOs is caused by mislocalized mTORC1 activation.
Numerous adverse effects of AβOs on neurons are known to require tau (Zempel et al, 2010; DuBoff et al, 2012; Bloom, 2014), and pathological forms of tau can cause mitochondrial dysfunction (Zempel et al, 2010; DuBoff et al, 2012; Bloom, 2014). We therefore tested whether tau is required for NiMA inhibition by AβOs. Insulin and amino acids induced NiMA in tau knockout (KO; Fig 7A) and WT neurons (Fig 1C) equally well, but NiMA was insensitive to AβOs in tau KO neurons (Fig 7B). AβOs therefore must signal through tau to dysregulate NiMA.
Figure 7. AβO‐mediated inhibition of NiMA requires tau.
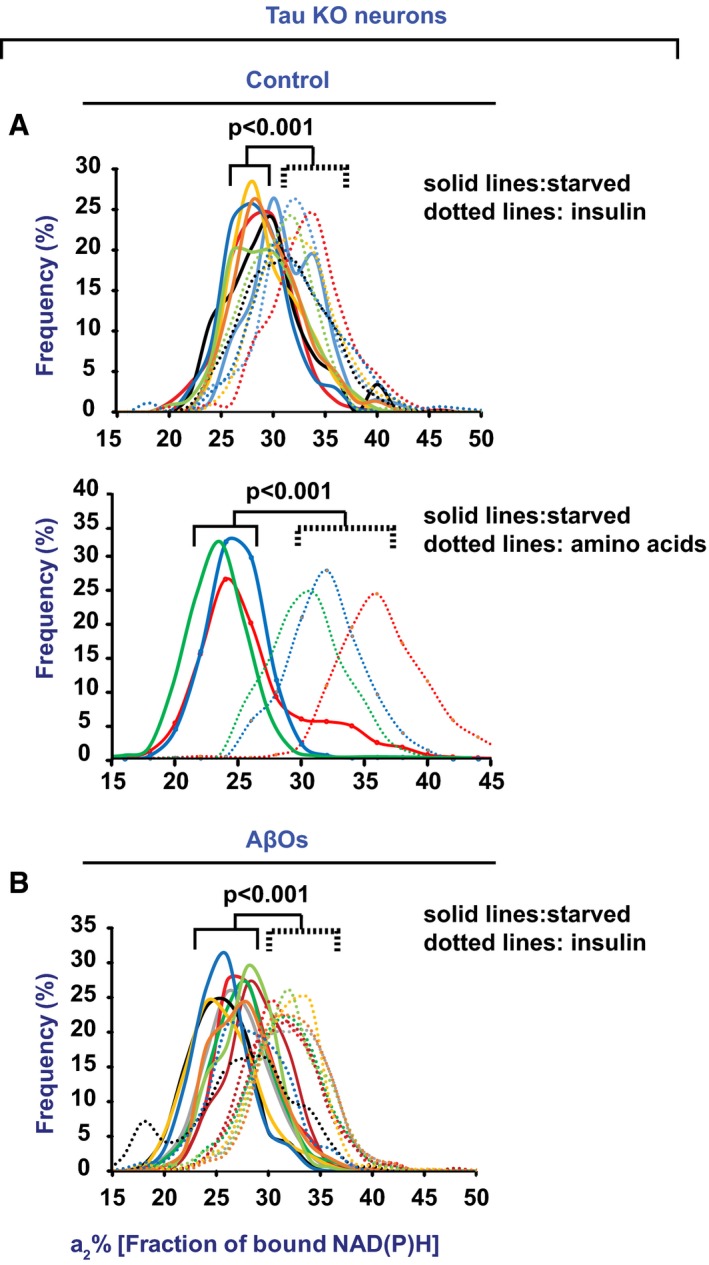
- Cortical mouse neurons from tau knockout (KO) mice were serum‐starved in Hank's balanced salt solution for 2 h. The cells were then imaged for NiMA, after which insulin or amino acids were immediately added, and the cells were then imaged again 30 min later.
- Cortical mouse neurons from tau KO mice were treated with AβOs for 18 h before being serum‐starved in AβO‐containing Hank's balanced salt solution for 2 h. The cells were then imaged for NiMA, after which insulin was immediately added, and the cells were then imaged again 30 min later. Note that NiMA occurred in the absence or presence of AβOs, which inhibited NiMA in wild‐type human neurons (see Fig 6B).
Reduction of lysosomal mTORC1 inhibitors blocks NiMA
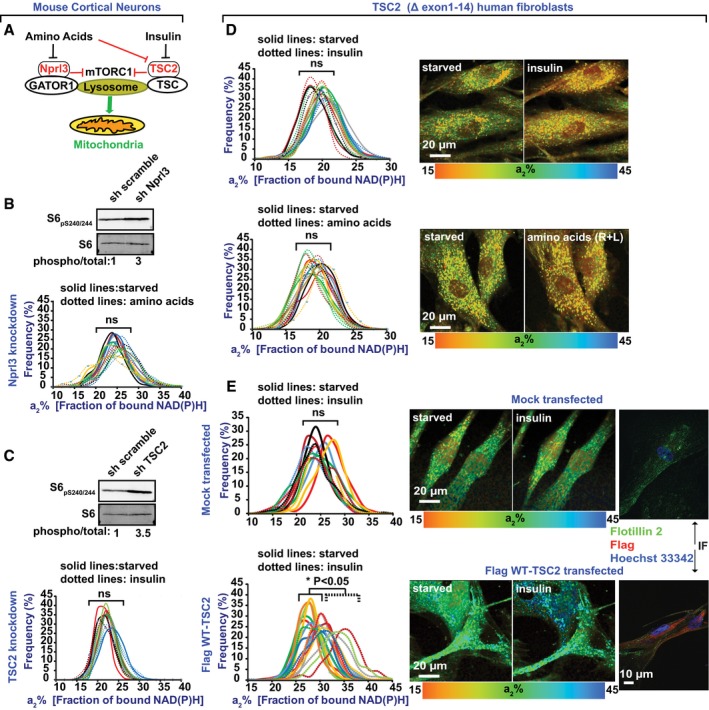
Elevation of lysosomal mTORC1 kinase activity by insulin or amino acids involves translocation of the tuberous sclerosis complex (TSC) from the lysosome surface to cytosol. TSC is a GTPase‐activating complex that negatively regulates mTORC1 by inducing Rheb, a GTPase activator of mTORC1, to hydrolyze GTP (Demetriades et al, 2014; Menon et al, 2014; Saxton & Sabatini, 2017). Lysosomal mTORC1 activation by R + L, but not by insulin, also involves inhibition of the GATOR1 complex on lysosomes (Fig 8A). GATOR1 is a GTPase‐activating complex that negatively regulates mTORC1 by inducing GTP hydrolysis in the GTPase, RagA, another activator of mTORC1 (Bar‐Peled et al, 2013).
Figure 8. NiMA is dysregulated in tuberous sclerosis fibroblasts.
-
A–CWild‐type mouse cortical neurons depleted of Nprl3 or Tsc2 with shRNA had mitochondria that were insensitive to amino acids (R + L) or insulin, respectively. Each colored line refers to a single field of view containing 5–15 cells, and each pair of solid and dotted lines (same color) refers to the same field of view. Knockdown efficiency was monitored by Western blotting of phosphorylated ribosomal S6 protein, a downstream target of the mTORC1‐S6K pathway. Western blots are representative of three independent assays. Statistical analyses were performed using Student's two‐tailed unpaired t‐test.
-
D, E(D) Human fibroblasts deficient in Tsc2 (TSC2 Δexons1–14) were imaged before and 30 min after insulin addition. Lack of Tsc2 made mitochondria insensitive to insulin. (E) Re‐expression of human Tsc2 rescues mitochondrial responses to insulin. Cultures were serum‐starved in Hank's balanced salt solution for 2 h before stimulation with insulin or amino acids and were imaged before and 30 min after stimulation. Each colored line refers to a single field of view containing 2–5 cells, and each pair of solid and dotted lines of the same color refers to the same field of view. Re‐expression of the Flag‐WT Tsc2 was corroborated by indirect immunofluorescence (IF). Statistical analyses were performed using Student's two‐tailed unpaired t‐test.
Source data are available online for this figure.
To seek further evidence that mTORC1 kinase activity at lysosomes is required for NiMA, we interfered with either insulin or R + L‐induced activation of lysosomal mTORC1 by antisense‐mediated reduction of the respective TSC and GATOR1 subunits, Tsc2 and Nprl3 (Norambuena et al, 2017; Saxton & Sabatini, 2017). Mitochondrial activity, as measured by 2P‐FLIM, was insensitive to either insulin or R + L in mouse cortical neurons with reduced Tsc2 or Nprl3 expression, presumably because their lysosomal mTORC1 was constitutively activated, as evidenced by elevated phosphorylation at S240 and S244 of the ribosomal protein, S6, a downstream target of the mTORC1‐S6K pathway (Fig 8B and C).
NiMA is impaired in tuberous sclerosis cells
In humans, loss‐of‐function mutations in TSC1 or TSC2 trigger benign, tuber‐like tumors in brain, heart, kidney, and skin, and TSC patients are prone to cognitive deficits (Prather & de Vries, 2004), autism (Smalley, 1998), epilepsy (Thiele, 2004), and other neurological symptoms (Orlova & Crino, 2010). Several upstream regulators of Tsc1/2 have been identified (Orlova & Crino, 2010), but just a few downstream targets, including Rheb, are known. Since redistribution of Tsc1/2 from lysosomes to cytosol promotes mTORC1 activation (Demetriades et al, 2014; Menon et al, 2014), we assayed for NiMA in human fibroblasts derived from TSC patients. As shown in Fig 8D, neither insulin nor R+L increased mitochondrial activity in human Tsc2‐deficient fibroblasts, but re‐expressing WT human Tsc2 in these cells restored NiMA. Mitochondria were also insensitive to insulin stimulation in fibroblasts from a patient with mutations in the TSC1 gene (Fig EV3). Taken together, the data about Tsc2 and Nprl3 emphasize that malfunctioning of lysosomal mTORC1 can cause mitochondria to be pathologically refractory to nutrient signaling in at least two disease contexts—in AD, in which AβOs working through tau to cause mTORC1 activation at the PM at the expense of lysosomal activation; and in tuberous sclerosis, due to genetic loss of functional TSC complex.
Figure EV3. NiMA is dysregulated in tuberous sclerosis fibroblasts derived from a patient expressing a mutated Tsc1 protein.
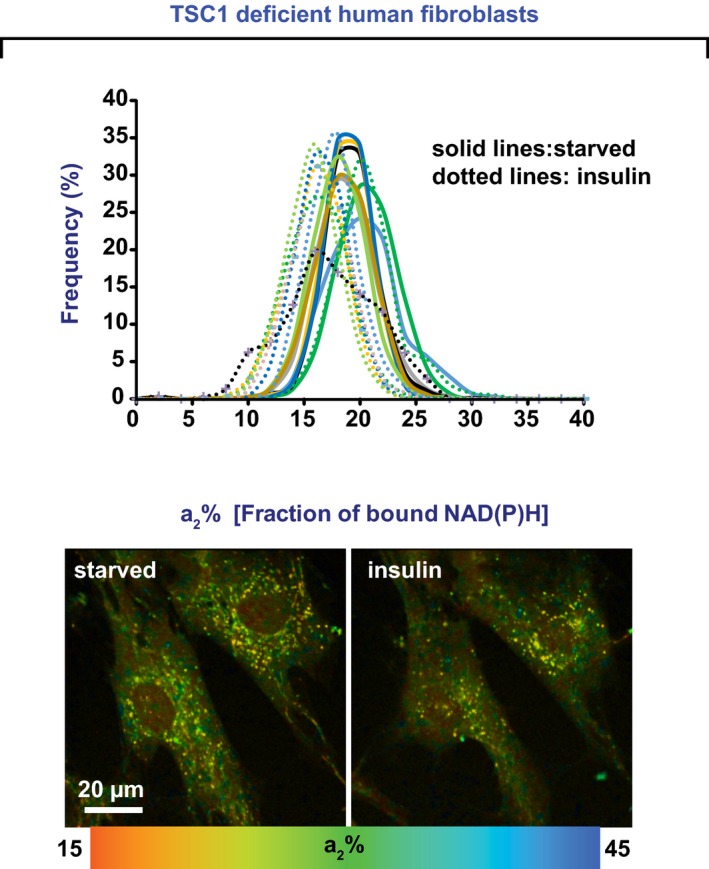
Human fibroblasts with a TSC1 gene polymorphism were imaged before and 30 min after insulin addition. Mutations in Tsc1 rendered mitochondria insensitive to insulin. Each colored line refers to a single field of view containing two to five cells, and each pair of solid and dotted lines of the same color refers to the same field of view. Statistical analyses were performed using Student's two‐tailed unpaired t‐test.
Discussion
It is becoming increasingly apparent that organelles “talk” to each other to regulate key cellular functions (Murley & Nunnari, 2016; Quirós et al, 2016; Valm et al, 2017), but the mechanisms involved and potential roles in disease pathogenesis remain largely unexplored. Using a 2P‐FLIM assay for label‐free imaging of mitochondrial activity in live cells (Lakowicz, 2006; Alam et al, 2017; Wallrabe et al, 2018) (Fig 1A and B), we describe here a previously unknown form of inter‐organelle communication, from lysosomes to mitochondria, and reveal details of its function and mechanism of action, and how its dysregulation may represent a seminal process in AD pathogenesis and a defining molecular defect in tuberous sclerosis.
We found that perikaryal mitochondria in neurons quickly respond to nutrient and hormone availability by a process requiring activation of lysosomal mTORC1. This communication pathway, which we call NiMA for Nutrient‐induced Mitochondrial Activity, is inhibited in neurons by AβOs because they activate mTORC1 at the PM, but not at lysosomes (Norambuena et al, 2017). Moreover, we found that mitochondria in cultured cell models of human tuberous sclerosis are non‐responsive to nutrients because of TSC1/2 mutations that cause constitutive activation of lysosomal mTORC1. Besides defining a novel lysosome‐to‐mitochondria signaling pathway whose dysregulation leads to AD and tuberous sclerosis, this study reveals a novel function of mTORC1.
So far, the best characterized mechanism regulating mTORC1 involves activation of its kinase activity at the lysosome surface by insulin, amino acids, and other nutrients. Activated lysosomal mTORC1 regulates protein synthesis and inhibits autophagy (Saxton & Sabatini, 2017). Our observations described here establish NiMA as a novel biological process fully dependent on the proper positioning on lysosomes and activation of mTORC1 there. Importantly, NiMA is completely insensitive to the expression of two regulators of protein synthesis, S6K and 4EBPs‐eIF4E, that function downstream of mTORC1 (Fig EV2).
Given that mTOR is a key modulator of aging (Johnson et al, 2013) and plays a major regulatory role in the complex cellular machinery that transduces nutrient detection into myriad cellular responses (Efeyan et al, 2015), it is not surprising that dysregulation of NiMA can underlie disease pathogenesis. We previously showed that AβOs, which are essential for initiating AD, dysregulate mTORC1 function by reducing its presence on lysosomes and stimulating its kinase activity at the PM, but not at lysosomes (Norambuena et al, 2017). As a consequence, AβOs unleash a signaling pathway that leads to neuronal CCR, a harbinger of neuron death in AD (Arendt et al, 2010; Norambuena et al, 2017). Now we report that AβOs, by ectopically activating mTORC1 at the PM at the expense of lysosomes, also suppress NiMA. It is reasonable to speculate that AβOs therefore generate a starving phenotype in AD neurons. In addition, we analyzed NiMA in human fibroblasts from patients carrying loss‐of‐function mutations in either TSC1 or TSC2 genes. Such cells have a non‐functional TSC complex, which is a direct target for Akt kinase activity stimulated by insulin (Zhang et al, 2009). It is therefore noteworthy that mitochondrial activity in TSC2 mutant cells was completely insensitive to insulin stimulation and that insulin responsiveness in such cells was recovered by expression of WT Tsc2 (Fig 8D and E).
The microtubule‐associated protein, tau, which forms neurofibrillary tangles in AD, mediates several adverse effects of AβOs (Bloom, 2014), and pathological tau has been linked to mitochondrial dysfunction in AD (DuBoff et al, 2012). Although NiMA proceeds independently of tau expression, the AβO‐mediated inhibition of NiMA occurs by a tau‐dependent mechanism. A likely explanation for this is that tau is required for selective activation of PM mTORC1 by AβOs (Norambuena et al, 2017). Although the mechanism that explains how AβOs and tau work coordinately to cause toxic mTORC1 activation at the PM is unknown, the findings described here add NiMA to a growing list of damaging AβO‐induced effects on neurons that require tau at early stages of AD pathogenesis (Bloom, 2014).
The results of this study, which are summarized in Fig 9, also demonstrate that AβOs act as a two‐edged sword to dysregulate mTORC1. By activating PM mTORC1, AβOs cause neuronal CCR, which frequently precedes and is a likely cause of substantial neuron death in AD (Arendt et al, 2010; Norambuena et al, 2017). As demonstrated here, stimulation of PM mTORC1 by AβOs also inhibits NiMA. Importantly, both CCR and NiMA inhibition proceed by tau‐dependent mechanisms, further emphasizing how Aβ and tau work coordinately during AD pathogenesis (Bloom, 2014).
Figure 9. NiMA: A novel communication pathway between lysosomes and mitochondria is disrupted by AβOs in Alzheimer's disease.
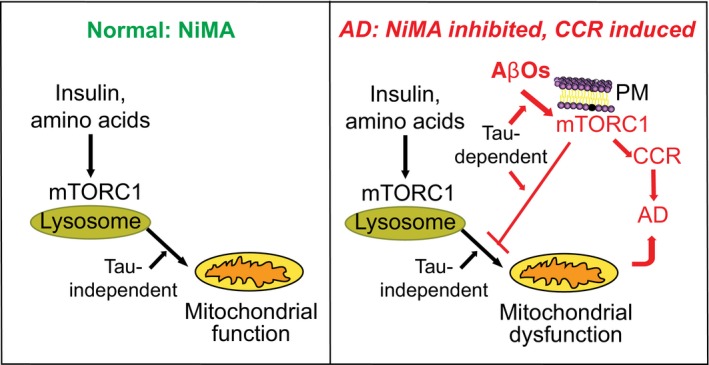
Under physiological conditions, activation of lysosomal mTORC1 by amino acids or insulin directly stimulates mitochondrial oxidative pathways and (not illustrated here) regulates mtDNA synthesis. Insulin‐regulated and amino acid‐regulated mitochondrial functions are blocked by AβOs, which stimulate translocation of mTORC1 to PM, where mTOR kinase activity triggers cell cycle re‐entry (CCR), a frequent prelude to neuron death in Alzheimer's disease (AD). In doing so, AβOs also interfere with NiMA. Thus, AβOs initiate two parallel, interconnected pathways that together lead to neuronal dysfunction in AD.
FDG‐PET studies of human brain indicate a role for reduced energy metabolism in AD. Deficient brain energy metabolism is linked to neuronal mtDNA mutations that affect posterior cingulate neurons. These observations highlight a maternally inherited risk factor in AD and suggest that alterations in neuronal mtDNA maintenance account, at least in part, for brain energy metabolism deficiencies (Mosconi et al, 2007; Liang et al, 2008). As proper maintenance of mitochondria requires nuclear‐encoded gene expression, it is possible that NiMA influences mitochondria–nucleus communication (Quirós et al, 2016), and as a consequence, expression of essential genes involved in mitochondrial biogenesis and activity. NiMA deficiencies thus may be an early molecular signature of AD.
Materials and Methods
Cell lines
Human neurons were differentiated from ReNcell VM neuronal precursor cells (EMD Millipore) as described earlier (Choi et al, 2014). For 2D differentiation, the cells were plated into 35‐mm glass‐bottom dishes with DMEM/F12 differentiation media (Gibco) supplemented with 2 μg/ml heparin (STEMCELL Technologies), 2% (v/v) B27 neural supplement (Gibco), and 1% (v/v) penicillin/streptomycin/amphotericin B solution (Lonza) without growth factors. One‐half volume of the differentiation media was changed every 3 days for 3–7 weeks (Choi et al, 2014).
Human tuberous sclerosis fibroblasts lacking exons 1–14 of the TSC2 gene (catalog number GM04520) or with a polymorphisms in TSC1 gene (catalog number GM06149) were obtained from the Coriell Institute and were cultured according to the vendor's specifications in Eagle's minimal essential medium (Gibco) supplemented with 15% Optima fetal bovine serum (Atlanta Biologicals).
3D human neuron cultures
Unmodified ReNcell VM cells were co‐cultured in 3D Matrigel matrices with modified ReNcell VM cells that stably express GFP (ReN‐GFP), or human APP with familial AD Swedish (K670N/M671L) and London (V717I) mutations plus GFP (ReN‐APPSL). Briefly, Matrigel stock solution (BD Biosciences) was diluted with ice‐cold ReNcell differentiation medium (1:15 dilution ratio) and then vortexed with the cell pellets for 20 s. The final cell concentration in the mixtures was ~2 × 10⁶ cells per ml (50% unmodified ReNcell VM, 50% ReN‐G or ReN‐APPSL). The cell/Matrigel mixtures were immediately transferred into 35‐mm dishes (200 μl/well) using pre‐chilled pipettes. Thick 3D cultures and differentiation were followed exactly as described earlier (Choi et al, 2014). For 2P‐FLIM, data were collected from the unmodified, GFP‐free ReNcell VM cells in the co‐cultures.
Cultured mouse neurons
Brain cortices were dissected from E17/18 WT (C57/Bl6) or tau KO mice, and primary neuron cultures were prepared as described previously (Norambuena et al, 2017). Experiments were performed using cultures grown for at least 10 days in Neurobasal medium (Gibco) supplemented with B27 (Gibco) before being used for experiments. Lentivirus transductions were performed 3 days in advance of all other experimental procedures.
NADH and NADPH measurement
Time‐correlated single photon counting (TCSPC) fluorescence lifetime microscopy (FLIM)
Fluorescence lifetime microscopy was recorded on a Zeiss LSM‐780 NLO confocal/multi‐photon microscopy system comprising an inverted Axio Observer Z1 microscope, an X‐Cite 120PC Q mercury arc light source (Excelitas Technologies) for cell selection, a motorized stage for automated scanning, an IR Chameleon Vision‐II ultrafast Ti:sapphire laser for multi‐photon excitation (Coherent), a Zeiss 40X 1.3 NA oil immersion Planapo objective, an environmental chamber (PeCon GmbH, Germany) that envelops the microscope stage to control temperature and CO2 level, and a three‐channel FLIM system based on three HPM‐100‐40 GaAsP‐based hybrid detectors and three SPC‐150 TCSPC boards (Becker & Hickl). The SPC‐150 boards are synchronized with the two‐photon excitation laser and the Zeiss LSM‐780 NLO scan head signal.
Imaging
Human and mouse neurons, and human tuberous sclerosis fibroblasts were grown in 35‐mm glass‐bottom dishes and maintained at 37°C in 5% CO2/95% air on the stage of the Zeiss LSM‐780 NLO microscope. All cultures were serum‐starved in Hank's balanced salt solution (HBSS) for 2 h before stimulation with insulin or amino acids, and imaged before and 30 min after stimulation. The laser was tuned to 740 nm with an average power of 7 mW at the specimen plane, and NAD(P)H fluorescence was collected using a 440–480 nm emission filter. For each experiment, 5–10 fields of view were recorded in the descanned mode, and then each field of view was subjected to a 40‐s acquisition in the non‐descanned mode. The laser power and acquisition time were selected to ensure enough photons per pixel while avoiding photodamage to cells. Next, ROIs corresponding to mitochondria were selected from the NAD(P)H photon image for lifetime analysis. Both the lifetimes and fractions of free and enzyme‐bound NAD(P)H were calculated on a per‐pixel basis, from which pseudocolor images of the bound NAD(P)H and histograms of the frequency distribution of a2% (fraction of bound NAD(P)H) were generated. Nutrients (1 μM insulin plus 0.8 mM l‐leucine [Sigma‐Aldrich catalog numbers I5500 and L8000, respectively] and 0.4 mM l‐arginine [Acros Organics catalog number 105001000]) and other reagents were added to the cultures as indicated.
The relative contributions of NADPH and NADH to the signal detected by 2P‐FLIM were analyzed as established previously by others (Blacker et al, 2014). Our custom software automatically retrieved those values.
Processing
Fluorescence lifetime microscopy images were processed with SPCImage software (v5; Becker & Hickl) with non‐linear least square for optimal fitting. Data images were exported for analysis using SPCImage to establish the free and enzyme‐bound fractions of NAD(P)H. The intensity images were used to document mitochondrial morphology and to generate ROIs with a custom plug‐in for ImageJ (http://imagej.net/Welcome) to capture the discrete and heterogeneous nature of mitochondrial dynamics. A custom ImageJ macro extracted parameters of interest, most notably the fraction of enzyme‐bound NAD(P)H. A custom macro in Microsoft Excel further processed the data by individual ROI and produced histograms, charts, and statistics, followed by merging the different fields of view for charting.
Co‐localization assays
Wild‐type mouse cortical neurons grown on glass‐bottom dishes were loaded with 10 nM MitoTracker Red CMXRos (Invitrogen catalog number M7512) for 60 min at 37°C. Sequential imaging of those organelle tracers and NAD(P)H was achieved by two‐photon microscopy. Co‐localization of mTOR with LAMP1 or MitoTracker CMXRos was quantified by the Manders coefficient plug‐in (http://www.uhnresearch.ca/facilities/wcif/software/Plugins/Manders_Coefficients.html) for ImageJ (http://rsbweb.nih.gov/ij/index.html), which is based on the Pearson correlation coefficient (Dunn et al, 2011).
Other fluorescence microscopy procedures
Human tuberous sclerosis fibroblasts
Cells growing on #1.5 thickness, 12‐mm round glass coverslips in 24‐well dishes were transfected with 0.5 μg of pcDNA3 Flag TSC2 using Lipofectamine 2000 (Thermo Fisher) following manufacturer recommendations. Expression of exogenously encoded TSC2 was monitored 24 h later by immunofluorescence. Cells were rinsed in PBS and fixed for 15 min in 4% paraformaldehyde. Next, they were washed and permeabilized in washing buffer (0.2% Tween‐20 in PBS) three times for 5 min each and incubated for 60 min in blocking buffer (PBS version; LI‐COR Biosciences). Fixed cells were then incubated for 1 h each with primary and secondary antibodies diluted into blocking buffer supplemented with Tween‐20 to 0.2%, with several PBS washes after each antibody step. Finally, coverslips were mounted onto glass slides using Fluoromount‐G (Thermo Fisher). Samples were imaged on a Nikon Eclipse Ti inverted microscope equipped with a Yokogawa CSU‐X1 spinning disk head, 60X 1.4 NA Plan Apo objective, a Hamamatsu Flash 4.0 scientific CMOS camera, and 405, 488, 561, and 640 nm lasers.
Mitochondrial DNA (mtDNA) replication experiments
To visualize mtDNA replication we used the Click‐iT® Plus EdU (Molecular Probes catalog numbers C10640 for immunofluorescence microscopy and C10356 for quantitation) as described by others (Lewis et al, 2016). Briefly, WT mouse cortical neurons grown on glass coverslips or in 96‐well plates (black plate, clear bottom, Costar catalog number 3603) were serum‐starved in HBSS for 2 h in the presence or absence of AβOs (see below) and in the presence of 7.5 μM aphidicolin (Sigma Aldrich cat. # 178273) to inhibit nuclear DNA replication before cells were treated for 3 h with nutrients (1 μM insulin plus 0.8 mM l‐leucine [Sigma‐Aldrich catalog numbers I5500 and L8000, respectively] and 0.4 mM l‐arginine [Acros Organics catalog number 105001000)]). For immunofluorescence, cells were incubated with 100 nM MitoTracker Red CMXRos (Invitrogen catalog number M7512) for 30 min before being assayed. The immunofluorescence labeling procedure was as described for human tuberous sclerosis fibroblasts.
Multi‐parametric photoacoustic microscopy (MP‐PAM)
Twelve‐ to sixteen‐week‐old male CD‐1 mice were used in this study. All animal procedures were approved by the Institutional Animal Care and Use Committee at the University of Virginia. Following scalp hair removal, a surgical incision was made in the scalp and the skull was cleaned. Then, the skull region over the ROI (3 × 3 mm2) was carefully removed to expose the cortex for topical application of nutrients. After craniotomy, the anesthetized mouse was transferred to a stereotaxic instrument. The animal body temperature was maintained at 37°C via a heating pad, and the local brain temperature was also maintained at 37°C via the temperature‐controlled water tank. Ultrasound gel was applied between the open‐skull window and water tank for acoustic coupling. Following the baseline imaging, the ultrasound gel was gently removed and a mixed solution of arginine (0.4 mM) and leucine (0.8 mM) was applied topically. The exposed mouse cortex was treated with the nutrient solution for 1 h. Then, the ROI was covered again with ultrasound gel and subjected to post‐treatment MP‐PAM imaging (Cao et al, 2017).
Amyloid‐β oligomers (AβOs)
Lyophilized, synthetic Aβ1–42 (AnaSpec) was dissolved in 1,1,1,3,3,3‐hexafluoro‐2‐propanol (Sigma‐Aldrich) to ~1 mM and evaporated overnight at room temperature. The dried powder was resuspended for 5 min at room temperature in 40–50 μl dimethylsulfoxide to ~1 mM and sonicated for 10 min in a water bath. To prepare oligomers, the dissolved, monomeric peptide was diluted to ~400 μl (100 μM final concentration) in Neurobasal medium (Gibco), incubated 24–48 h at 4°C with rocking, and then centrifuged at 14,000 g for 15 min to remove fibrils. For all experiments, AβOs were diluted into tissue culture medium to a final concentration of ~1.5 μM total Aβ1–42.
Antibodies
See Table EV1.
Lentivirus production and infection
Lentiviral particles for shRNA knockdowns and Flag‐Raptor fusion protein expression in mouse cortical neurons or human neurons were prepared as follows. The pBOB‐NepX or pLKO.1 expression plasmids, and the packaging vectors, pSPAX2 and pMD2.G (Addgene plasmids 12260 and 12259, respectively), were transfected using Lipofectamine 3000 (Thermo Fisher) into HEK293T cells grown in 15‐cm Petri dishes to ~80% confluence in DMEM (Gibco) supplemented with 10% HyClone cosmic calf serum (GE Healthcare). Each transfection was with 15 μg total DNA at a 50%/37.5%/12.5% ratio of expression vector/pSPAX2/pMD2.G. Lentivirus‐conditioned medium was collected 48 and 72 h after the start of transfection. Lentiviral particles were concentrated in a Beckman Coulter Optima LE‐80K Ultracentrifuge for 2 h at 23,000 rpm (95,000 gav) at 4°C in an SW28 rotor, resuspended in 400 μl Neurobasal medium, and stored at −80°C in 20 μl aliquots. Cultured neurons were transduced in Neurobasal/B27 medium with a viral MOI of 5 and incubated for 72 h before assays were performed.
Reactive oxygen species (ROS), oxygen, and ATP accumulation assays
Wild‐type mouse cortical neurons or human neurons (differentiated for 30–35 days) grown in 96‐well plates (black plate, clear bottom, Costar catalog number 3603) were serum‐starved in HBSS for 1 h in the presence of 100 nM MitoSOX Red (Thermo Fisher). Unbound tracker was washed out by replacing labeling media with HBSS for another hour. MitoSOX Red fluorescence intensity (a readout for ROS accumulation) was analyzed 1 h after experimental treatments using a SpectraMax i3X microplate reader (Molecular Devices) tuned at 510 nm for excitation and 600 nm for emission. Oxygen consumption and ATP were assayed using the Extracellular O2 Consumption Assay (Abcam catalog number ab197243) and ATPlite 1step Luminescence Assay System (PerkinElmer), respectively.
Tetramethylrhodamine ethyl ester perchlorate (TMRE) live cell imaging
Mitochondrial membrane potential was analyzed in mouse cortical neurons or human neurons (differentiated for 30–35 days) grown on the aforementioned 96‐well plates. Cells were serum‐starved in HBSS for 2 or 2.67 h before being treated with nutrients for 1 h or with 50 μM carbonyl cyanide m‐chlorophenyl hydrazone (CCCP; Sigma‐Aldrich catalog number C2759) for 20 min. Then, cells were incubated with 200 nM TMRE (Sigma‐Aldrich catalog number 87917) for 30 min at 37°C. Finally, the unbound dye was washed out and TMRE fluorescence was analyzed in the SpectraMax i3X microplate reader tuned at 550 nm for excitation and 575 nm for emission.
35S Methionine radiolabeling
Wild‐type mouse cortical neurons were incubated in methionine‐free and cysteine‐free DMEM (Gibco catalog number 21013‐024) supplemented with 0.26 mM L‐cysteine (Sigma‐Aldrich catalog number 168149) for 2 h, followed by metabolic labeling of the cells with 100 mCi/ml [35S]‐methionine (PerkinElmer catalog number NEG009C) for 1 or 10 min in the absence or presence of nutrients, as indicated. Cells were then lysed immediately, and radiolabeled proteins were resolved by SDS–PAGE. Autoradiographs were obtained by scanning gels in a STORM 840 imager (Molecular Dynamics).
cDNA constructs and shRNA sequences
For mouseTsc2 knockdowns, the following oligonucleotide‐targeting sequence—5′ GGT GAA GAG AGC CGT ATC 3′—was inserted into the pLKO.1 vector (Addgene plasmid 10878; gift from Dr. David Root).
Plasmids to knock down mouse Raptor were obtained from Addgene (plasmids 21339 and 21340; gifts from Dr. David Sabatini) and mouse Rictor were obtained from Addgene (plasmid 21341; gift from Dr. David Sabatini). Knockdown efficiency was monitored by immunoblotting (see below) for Raptor.
The following plasmids were purchased from The RNAi Consortium of the Broad Institute: (i) Mouse Nprl3 (TRCN0000175195); (ii) Human Raptor (TRCN0000039772); (iii) Human Rictor (TRCN0000074291); and (iv) Mouse Bcl‐xL (TRCN0000033500).
To knock down eIF4E, WT mouse cortical neurons were treated with 100 nM of a proprietary Vivo‐Morpholinos (gift from Gene Tools, LLC) for 96 h.
The pLJM1 Flag‐Raptor‐Rheb15 and pLJM1 Flag‐Raptor‐H‐Ras25 lentiviral expression constructs were obtained from Addgene (plasmids 19312 and 26637, respectively; gifts from Dr. David Sabatini).
The pcDNA3 Flag TSC2 was obtained from Addgene (plasmid 14129; gift from Dr. Brendan Manning).
Immunoblotting
Samples were resolved by SDS–PAGE using 10 or 12% acrylamide/bis‐acrylamide gels (Bio‐Rad) and transferred to 0.22 μm nitrocellulose (Bio‐Rad). Membranes were blocked with Odyssey blocking buffer (LI‐COR Biosciences) and were incubated with primary antibodies and secondary IRDye‐labeled antibodies (see Table EV1) diluted into antibody buffer (Odyssey blocking buffer diluted 1:1 in PBS/0.2% Tween‐20). All antibody incubations were for 1 h at room temperature or overnight at 4°C, and three washes of 5 minutes each with PBS/0.1% Tween‐20 were performed after each antibody step. Membranes were dried between sheets of filter paper prior to quantitative imaging with an Odyssey imaging station (LI‐COR Biosciences).
Statistics
For 2P‐FLIM assays, statistical analyses were performed using Student's two‐tailed unpaired t‐test for experiments with a single treatment unless otherwise stated. Since there were thousands of ROIs obtained per image, the average of the ROIs for each field of view was calculated to reduce the sample size and thus the quantity of false positives. All data obtained follow the assumptions of normal distributions. All data displayed follow a frequency distribution relative to a2% bound to NADPH.
The paired t‐test was used for analyzing bar graphs shown in Figs 1C and 3A–C, and 4B, and 5B and C, and EV1A–C.
For MP‐PAM assays, vessel segmentations and quantitative analysis were done following our established protocol (Cao et al, 2017). The paired t‐test was used for comparing the cerebral oxygen metabolism before and after application of the compounds, which is shown in Fig 3B and C.
Author contributions
AN conceived, designed, and initiated the study; performed most of the experiments; and in concert with GSB had primary responsibility for all experiments, analyzing all data, and writing the paper. HW conceived, performed, and analyzed 2P‐FLIM experiments. RC and SH performed and analyzed experiments involving MP‐PAM. DBW prepared human and mouse neuron cultures. ZS and AP provided extensive technical support for 2P‐FLIM. AS performed experiments involving metabolic radiolabeling. DYK and RET provided human ReN‐APPSL and ReN‐GFP cells, and contributed to the design of experiments involving those cells. All authors read, edited, and approved submission of the manuscript.
Conflict of interest
The authors declare that they have no conflict of interest.
Supporting information
Expanded View Figures PDF
Table EV1
Source Data for Expanded View
Review Process File
Source Data for Figure 2
Source Data for Figure 4
Source Data for Figure 6
Source Data for Figure 8
Acknowledgments
We are grateful for financial support from the Alzheimer's and Related Diseases Research Award Fund (grant 17‐5 to AN), the Owens Family Foundation (GSB), NIH/NIA (grant RF1 AG051085 to GSB, R21 AG052062 to SH, P01 AG015379 and RF1 AG048080 to DYK and RET, and R01 AG014713 to DYK), NIH/Office of the Director for funds to purchase a Zeiss 780 microscope that was used throughout these studies (equipment grant S10‐OD016446; AP, PI), the Cure Alzheimer's Fund (GSB, DYK and RET), the Alzheimer's Association (grants ZEN‐16‐363266 to GSB), BrightFocus Foundation (DYK), Webb and Tate Wilson (GSB), the Virginia Chapter of the Lady's Auxiliary of the Fraternal Order of Eagles (GSB), and the University of Virginia President's Fund for Excellence (GSB). We also thank Lauren Saunders Rudenko, Erin Kodis, Shahzad Khan, Eric Swanson, Jamison Burks, John Lazo, and Elizabeth Sharlow for their intellectual and technical contributions to this work. Vivo‐Morpholinos targeting eIF4E were a gift from Gene Tools, LLC.
The EMBO Journal (2018) 37: e100241
See also: https://doi.org/10.15252/embj.2018100839 (November 2018)
Contributor Information
Andrés Norambuena, Email: an2r@virginia.edu.
George S Bloom, Email: gsb4g@virginia.edu.
References
- Alam SR, Wallrabe H, Svindrych Z, Chaudhary AK, Christopher KG, Chandra D, Periasamy A (2017) Investigation of mitochondrial metabolic response to doxorubicin in prostate cancer cells: an NADH, FAD and tryptophan FLIM assay. Sci Rep 7: article number: 10451 [DOI] [PMC free article] [PubMed] [Google Scholar]
- Arendt T, Brückner MK, Mosch B, Lösche A (2010) Selective cell death of hyperploid neurons in Alzheimer's disease. Am J Pathol 177: 15–20 [DOI] [PMC free article] [PubMed] [Google Scholar]
- Arias E, Koga H, Diaz A, Mocholi E, Patel B, Cuervo AM (2015) Lysosomal mTORC2/PHLPP1/Akt regulate chaperone‐mediated autophagy. Mol Cell 59: 270–284 [DOI] [PMC free article] [PubMed] [Google Scholar]
- Bar‐Peled L, Chantranupong L, Cherniack AD, Chen WW, Ottina KA, Grabiner BC, Spear ED, Carter SL, Meyerson M, Sabatini DM (2013) A Tumor suppressor complex with GAP activity for the Rag GTPases that signal amino acid sufficiency to mTORC1. Science 340: 1100–1106 [DOI] [PMC free article] [PubMed] [Google Scholar]
- Betz C, Hall MN (2013) Where is mTOR and what is it doing there? J Cell Biol 203: 563–574 [DOI] [PMC free article] [PubMed] [Google Scholar]
- Blacker TS, Mann ZF, Gale JE, Ziegler M, Bain AJ, Szabadkai G, Duchen MR (2014) Separating NADH and NADPH fluorescence in live cells and tissues using FLIM. Nat Commun 5: 3936 [DOI] [PMC free article] [PubMed] [Google Scholar]
- Bloom GS (2014) Amyloid‐β and tau: the trigger and bullet in Alzheimer's disease pathogenesis. JAMA Neurol 71: 505–508 [DOI] [PMC free article] [PubMed] [Google Scholar]
- Burté F, Carelli V, Chinnery PF, Yu‐Wai‐Man P (2014) Disturbed mitochondrial dynamics and neurodegenerative disorders. Nat Rev Neurol 11: 11–24 [DOI] [PubMed] [Google Scholar]
- Caccamo A, Majumder S, Richardson A, Strong R, Oddo S (2010) Molecular interplay between mammalian target of rapamycin (mTOR), amyloid‐β, and Tau. J Biol Chem 285: 13107–13120 [DOI] [PMC free article] [PubMed] [Google Scholar]
- Caccamo A, Magrì A, Medina DX, Wisely EV, Lopez‐Aranda MF, Silva AJ, Oddo S (2013) mTOR regulates tau phosphorylation and degradation: implications for Alzheimer's disease and other tauopathies. Aging Cell 12: 370–380 [DOI] [PMC free article] [PubMed] [Google Scholar]
- Calkins MJ, Manczak M, Mao P, Shirendeb U, Reddy PH (2011) Impaired mitochondrial biogenesis, defective axonal transport of mitochondria, abnormal mitochondrial dynamics and synaptic degeneration in a mouse model of Alzheimer's disease. Hum Mol Genet 20: 4515–4529 [DOI] [PMC free article] [PubMed] [Google Scholar]
- Cao R, Li J, Ning B, Sun N, Wang T, Zuo Z, Hu S (2017) Functional and oxygen‐metabolic photoacoustic microscopy of the awake mouse brain. NeuroImage 150: 77–87 [DOI] [PMC free article] [PubMed] [Google Scholar]
- Choi SH, Kim YH, Hebisch M, Sliwinski C, Lee S, D'Avanzo C, Chen H, Hooli B, Asselin C, Muffat J, Klee JB, Zhang C, Wainger BJ, Peitz M, Kovacs DM, Woolf CJ, Wagner SL, Tanzi RE, Kim DY (2014) A three‐dimensional human neural cell culture model of Alzheimer's disease. Nature 515: 274–278 [DOI] [PMC free article] [PubMed] [Google Scholar]
- De Felice FG, Ferreira ST (2014) Inflammation, defective insulin signaling, and mitochondrial dysfunction as common molecular denominators connecting type 2 diabetes to Alzheimer Disease. Diabetes 63: 2262–2272 [DOI] [PubMed] [Google Scholar]
- Demetriades C, Doumpas N, Teleman AA (2014) Regulation of TORC1 in response to amino acid starvation via lysosomal recruitment of TSC2. Cell 156: 786–799 [DOI] [PMC free article] [PubMed] [Google Scholar]
- DuBoff B, Götz J, Feany MB (2012) Tau promotes neurodegeneration via DRP1 mislocalization in vivo . Neuron 75: 618–632 [DOI] [PMC free article] [PubMed] [Google Scholar]
- DuBoff B, Feany M, Götz J (2013) Why size matters – balancing mitochondrial dynamics in Alzheimer's disease. Trends Neurosci 36: 325–335 [DOI] [PubMed] [Google Scholar]
- Dunn KW, Kamocka MM, McDonald JH (2011) A practical guide to evaluating colocalization in biological microscopy. Am J Physiol Cell Physiol 300: C723–C742 [DOI] [PMC free article] [PubMed] [Google Scholar]
- Ebner M, Sinkovics B, Szczygieł M, Ribeiro DW, Yudushkin I (2017) Localization of mTORC2 activity inside cells. J Cell Biol 216: 343–353 [DOI] [PMC free article] [PubMed] [Google Scholar]
- Efeyan A, Comb WC, Sabatini DM (2015) Nutrient‐sensing mechanisms and pathways. Nature 517: 302–310 [DOI] [PMC free article] [PubMed] [Google Scholar]
- Garrido N, Griparic L, Jokitalo E, Wartiovaara J, van der Bliek AM, Spelbrink JN (2003) Composition and dynamics of human mitochondrial nucleoids. Mol Biol Cell 14: 1583–1596 [DOI] [PMC free article] [PubMed] [Google Scholar]
- Hansson Petersen CA, Alikhani N, Behbahani H, Wiehager B, Pavlov PF, Alafuzoff I, Leinonen V, Ito A, Winblad B, Glaser E, Ankarcrona M (2008) The amyloid beta‐peptide is imported into mitochondria via the TOM import machinery and localized to mitochondrial cristae. Proc Natl Acad Sci USA 105: 13145–13150 [DOI] [PMC free article] [PubMed] [Google Scholar]
- Johnson SC, Rabinovitch PS, Kaeberlein M (2013) mTOR is a key modulator of ageing and age‐related disease. Nature 493: 338–345 [DOI] [PMC free article] [PubMed] [Google Scholar]
- Lakowicz JR (2006) Principles of fluorescence spectroscopy principles of fluorescence spectroscopy. Singapore: Springer. [Google Scholar]
- Lewis SC, Uchiyama LF, Nunnari J (2016) ER‐mitochondria contacts couple mtDNA synthesis with Mitochondrial division in human cells. Science 353: aaf5549 [DOI] [PMC free article] [PubMed] [Google Scholar]
- Liang WS, Reiman EM, Valla J, Dunckley T, Beach TG, Grover A, Niedzielko TL, Schneider LE, Mastroeni D, Caselli R, Kukull W, Morris JC, Hulette CM, Schmechel D, Rogers J, Stephan DA (2008) Alzheimer's disease is associated with reduced expression of energy metabolism genes in posterior cingulate neurons. Proc Natl Acad Sci USA 105: 4441–4446 [DOI] [PMC free article] [PubMed] [Google Scholar]
- Liu Q, Chang JW, Wang J, Kang SA, Thoreen CC, Markhard A, Hur W, Zhang J, Sim T, Sabatini DM, Gray NS (2010) Discovery of 1‐(4‐(4‐propionylpiperazin‐1‐yl)‐3‐(trifluoromethyl)phenyl)‐9‐(quinolin‐3‐yl)benzo[h][1,6]naphthyridin‐2(1H)‐one as a highly potent, selective mammalian target of rapamycin (mTOR) inhibitor for the treatment of cancer. J Med Chem 53: 7146–7155 [DOI] [PMC free article] [PubMed] [Google Scholar]
- Ma XM, Blenis J (2009) Molecular mechanisms of mTOR‐mediated translational control. Nat Rev Mol Cell Biol 10: 307–318 [DOI] [PubMed] [Google Scholar]
- Manczak M, Anekonda TS, Henson E, Park BS, Quinn J, Reddy PH (2006) Mitochondria are a direct site of A beta accumulation in Alzheimer's disease neurons: implications for free radical generation and oxidative damage in disease progression. Hum Mol Genet 15: 1437–1449 [DOI] [PubMed] [Google Scholar]
- Manczak M, Calkins MJ, Reddy PH (2011) Impaired mitochondrial dynamics and abnormal interaction of amyloid beta with mitochondrial protein Drp1 in neurons from patients with Alzheimer's disease: implications for neuronal damage. Hum Mol Genet 20: 2495–2509 [DOI] [PMC free article] [PubMed] [Google Scholar]
- Menon S, Dibble CC, Talbott G, Hoxhaj G, Valvezan AJ, Takahashi H, Cantley LC, Manning BD (2014) Spatial control of the TSC complex integrates insulin and nutrient regulation of mtorc1 at the lysosome. Cell 156: 1771–1785 [DOI] [PMC free article] [PubMed] [Google Scholar]
- Morita M, Gravel SP, Chénard V, Sikström K, Zheng L, Alain T, Gandin V, Avizonis D, Arguello M, Zakaria C, McLaughlan S, Nouet Y, Pause A, Pollak M, Gottlieb E, Larsson O, St‐Pierre J, Topisirovic I, Sonenberg N (2013) MTORC1 controls mitochondrial activity and biogenesis through 4E‐BP‐dependent translational regulation. Cell Metab 18: 698–711 [DOI] [PubMed] [Google Scholar]
- Mosconi L, Brys M, Switalski R, Mistur R, Glodzik L, Pirraglia E, Tsui W, De Santi S, de Leon MJ (2007) Maternal family history of Alzheimer's disease predisposes to reduced brain glucose metabolism. Proc Natl Acad Sci USA 104: 19067–19072 [DOI] [PMC free article] [PubMed] [Google Scholar]
- Murley A, Nunnari J (2016) The emerging network of mitochondria‐organelle contacts. Mol Cell 61: 648–653 [DOI] [PMC free article] [PubMed] [Google Scholar]
- Ning B, Sun N, Cao R, Chen R, Kirk Shung K, Hossack JA, Lee J‐M, Zhou Q, Hu S (2015) Ultrasound‐aided multi‐parametric photoacoustic microscopy of the mouse brain. Sci Rep 5: 18775 [DOI] [PMC free article] [PubMed] [Google Scholar]
- Norambuena A, Wallrabe H, McMahon L, Silva A, Swanson E, Khan SSS, Baerthlein D, Kodis E, Oddo S, Mandell JWJW, Bloom GSGS (2017) mTOR and neuronal cell cycle reentry: how impaired brain insulin signaling promotes Alzheimer's disease. Alzheimers Dement 13: 152–167 [DOI] [PMC free article] [PubMed] [Google Scholar]
- Nunnari J, Suomalainen A (2012) Mitochondria: in sickness and in health. Cell 148: 1145–1159 [DOI] [PMC free article] [PubMed] [Google Scholar]
- Oddo S (2012) The role of mTOR signaling in Alzheimer's disease. Front Biosci 4: 941–952 [DOI] [PMC free article] [PubMed] [Google Scholar]
- Orlova KA, Crino PB (2010) The tuberous sclerosis complex. Ann NY Acad Sci 1184: 87–105 [DOI] [PMC free article] [PubMed] [Google Scholar]
- Pigino G, Morfini G, Atagi Y, Deshpande A, Yu C, Jungbauer L, LaDu M, Busciglio J, Brady S (2009) Disruption of fast axonal transport is a pathogenic mechanism for intraneuronal amyloid beta. Proc Natl Acad Sci USA 106: 5907–5912 [DOI] [PMC free article] [PubMed] [Google Scholar]
- Prather P, de Vries PJ (2004) Behavioral and cognitive aspects of tuberous sclerosis complex. J Child Neurol 19: 666–674 [DOI] [PubMed] [Google Scholar]
- Quirós PM, Mottis A, Auwerx J (2016) Mitonuclear communication in homeostasis and stress. Nat Rev Mol Cell Biol 17: 213–226 [DOI] [PubMed] [Google Scholar]
- Ramanathan A, Schreiber SL (2009) Direct control of mitochondrial function by mTOR. Proc Natl Acad Sci USA 106: 22229–22232 [DOI] [PMC free article] [PubMed] [Google Scholar]
- Rostovtsev VV, Green LG, Fokin VV, Sharpless KB (2002) A stepwise huisgen cycloaddition process: copper(I)‐catalyzed regioselective ‘ligation’ of azides and terminal alkynes. Angew Chem Int Ed Engl 41: 2596–2599 [DOI] [PubMed] [Google Scholar]
- Saci A, Cantley LC, Carpenter CL (2011) Rac1 regulates the activity of mTORC1 and mTORC2 and controls cellular size. Mol Cell 42: 50–61 [DOI] [PMC free article] [PubMed] [Google Scholar]
- Salic A, Mitchison TJ (2008) A chemical method for fast and sensitive detection of DNA synthesis in vivo . Proc Natl Acad Sci USA 105: 2415–2420 [DOI] [PMC free article] [PubMed] [Google Scholar]
- Sancak Y, Bar‐Peled L, Zoncu R, Markhard AL, Nada S, Sabatini DM (2010) Ragulator‐rag complex targets mTORC1 to the lysosomal surface and is necessary for its activation by amino acids. Cell 141: 290–303 [DOI] [PMC free article] [PubMed] [Google Scholar]
- Saxton RA, Sabatini DM (2017) mTOR signaling in growth, metabolism, and disease. Cell 168: 960–976 [DOI] [PMC free article] [PubMed] [Google Scholar]
- Smalley SL (1998) Autism and tuberous sclerosis. J Autism Dev Disord 28: 407–414 [DOI] [PubMed] [Google Scholar]
- Suomalainen A, Battersby BJ (2018) Mitochondrial diseases: the contribution of organelle stress responses to pathology. Nat Rev Mol Cell Biol 19: 77–92 [DOI] [PubMed] [Google Scholar]
- Thiele EA (2004) Managing epilepsy in tuberous sclerosis complex. J Child Neurol 19: 680–686 [DOI] [PubMed] [Google Scholar]
- Tornøe CW, Christensen C, Meldal M (2002) Peptidotriazoles on solid phase: [1,2,3]‐Triazoles by regiospecific copper(I)‐catalyzed 1,3‐dipolar cycloadditions of terminal alkynes to azides. J Org Chem 67: 3057–3064 [DOI] [PubMed] [Google Scholar]
- Trifunovic A, Wredenberg A, Falkenberg M, Spelbrink JN, Rovio AT, Bruder CE, Bohlooly‐Y M, Gidlöf S, Oldfors A, Wibom R, Törnell J, Jacobs HT, Larsson N‐G (2004) Premature ageing in mice expressing defective mitochondrial DNA polymerase. Nature 429: 417–423 [DOI] [PubMed] [Google Scholar]
- Valm AM, Cohen S, Legant WR, Melunis J, Hershberg U, Wait E, Cohen AR, Davidson MW, Betzig E, Lippincott‐Schwartz J (2017) Applying systems‐level spectral imaging and analysis to reveal the organelle interactome. Nature 546: 162–167 [DOI] [PMC free article] [PubMed] [Google Scholar]
- Vyas S, Zaganjor E, Haigis MC (2016) Mitochondria and cancer. Cell 166: 555–566 [DOI] [PMC free article] [PubMed] [Google Scholar]
- Wallrabe H, Svindrych Z, Alam SR, Siller KH, Wang T, Kashatus D, Hu S, Periasamy A (2018) Segmented cell analyses to measure redox states of autofluorescent NAD(P)H, FAD & Trp in cancer cells by FLIM. Sci Rep 8: article number: 79 [DOI] [PMC free article] [PubMed] [Google Scholar]
- Wang X, Su B, Lee H, Li X, Perry G, Smith Ma, Zhu X (2009) Impaired balance of mitochondrial fission and fusion in Alzheimer's disease. J Neurosci 29: 9090–9103 [DOI] [PMC free article] [PubMed] [Google Scholar]
- Zempel H, Thies E, Mandelkow E, Mandelkow E‐M (2010) A oligomers cause localized Ca2+ elevation, missorting of endogenous tau into dendrites, tau phosphorylation, and destruction of microtubules and spines. J Neurosci 30: 11938–11950 [DOI] [PMC free article] [PubMed] [Google Scholar]
- Zhang HH, Huang J, Düvel K, Boback B, Wu S, Squillance RM, Wu CL, Manning BD (2009) Insulin stimulates adipogenesis through the Akt‐TSC2‐mTORC1 pathway. PLoS One 4: e6189 [DOI] [PMC free article] [PubMed] [Google Scholar]
Associated Data
This section collects any data citations, data availability statements, or supplementary materials included in this article.
Supplementary Materials
Expanded View Figures PDF
Table EV1
Source Data for Expanded View
Review Process File
Source Data for Figure 2
Source Data for Figure 4
Source Data for Figure 6
Source Data for Figure 8