

Abstract
Fibroblast growth factor 21 (Fgf21) is a liver‐derived, fasting‐induced hormone with broad effects on growth, nutrient metabolism, and insulin sensitivity. Here, we report the discovery of a novel mechanism regulating Fgf21 expression under growth and fasting‐feeding. The Sel1L‐Hrd1 complex is the most conserved branch of mammalian endoplasmic reticulum (ER)‐associated degradation (ERAD) machinery. Mice with liver‐specific deletion of Sel1L exhibit growth retardation with markedly elevated circulating Fgf21, reaching levels close to those in Fgf21 transgenic mice or pharmacological models. Mechanistically, we show that the Sel1L‐Hrd1 ERAD complex controls Fgf21 transcription by regulating the ubiquitination and turnover (and thus nuclear abundance) of ER‐resident transcription factor Crebh, while having no effect on the other well‐known Fgf21 transcription factor Pparα. Our data reveal a physiologically regulated, inverse correlation between Sel1L‐Hrd1 ERAD and Crebh‐Fgf21 levels under fasting‐feeding and growth. This study not only establishes the importance of Sel1L‐Hrd1 ERAD in the liver in the regulation of systemic energy metabolism, but also reveals a novel hepatic “ERAD‐Crebh‐Fgf21” axis directly linking ER protein turnover to gene transcription and systemic metabolic regulation.
Keywords: ER quality control, FGF21, gene transcription, metabolism, Sel1L‐Hrd1 ERAD
Subject Categories: Membrane & Intracellular Transport; Metabolism; Post-translational Modifications, Proteolysis & Proteomics
Introduction
The liver regulates growth and systvemic energy homeostasis through inter‐organ communication via the secretion of growth factors, hormones, and peptides. The “starvation hormone” Fgf21 is predominantly secreted from the liver, activating energy‐saving pathways that reduce activity, growth, and anabolic reactions, while increasing insulin sensitivity, lipolysis, and adipose tissue browning (BonDurant et al, 2017; Fisher et al, 2012; Inagaki et al, 2008). Recent reports have shown the therapeutic potential of Fgf21 in a variety of human disease conditions such as diabetes, obesity, and cardiovascular disorders (Kharitonenkov & Adams, 2014; Zhao et al, 2012). Expression of Fgf21 is primarily known to be induced in response to metabolic cues such as fasting by a synergistic interaction between the nuclear receptor peroxisome proliferator‐activated receptor α (Pparα) and the recently identified ER‐resident transcription factor cAMP‐responsive element‐binding protein 3‐like protein 3, hepatocyte‐specific (Creb3l3 or Crebh) (Badman et al, 2007; Hondares et al, 2010; Inagaki et al, 2007; Kim et al, 2014; Omori et al, 2001). Unlike Pparα, Crebh encodes an ER membrane‐anchored transcription factor, which requires regulated intramembrane proteolysis at the Golgi to generate the Crebh N‐terminal fragment (Crebh‐N) (Vecchi et al, 2009; Zhang et al, 2012a,b; Zhang et al, 2006). Subsequently, Crebh‐N goes to the nucleus and is believed to recruit and form a complex with Pparα, which induces transcriptional activation of the Fgf21 gene (Kim et al, 2014; Nakagawa et al, 2014). While it is well known that Fgf21 expression is induced by the nuclear receptor Pparα during fasting, how Fgf21 expression is regulated and the importance of CREBH under physiological contexts remains to be established.
In this study, we identified a surprising link between Fgf21 gene transcription and a principal ER quality control machinery, known as ER‐associated degradation (ERAD). ERAD is responsible for recognizing and retro‐translocating protein substrates, misfolded or not, from the ER for cytosolic proteasomal degradation (Guerriero & Brodsky, 2012; Qi et al, 2017). The most conserved ERAD system in mammals is the Sel1L‐Hrd1 protein complex: Hrd1 being the E3 ubiquitin ligase, and Sel1L being its essential cofactor. Studies from yeast and mammalian systems have suggested that the single‐spanning ER transmembrane protein Sel1L is required for the stability of Hrd1 as well as substrate recruitment and selection (Mehnert et al, 2015; Mueller et al, 2008; Sun et al, 2014; Vashistha et al, 2016). Germline deletion of Sel1L or Hrd1 in mice leads to embryonic lethality (Francisco et al, 2010; Yagishita et al, 2005), and acute deletion of either gene in adult mice leads to premature death (Fujita et al, 2015; Sun et al, 2014).
Subsequent characterization of cell type‐specific Sel1L‐knockout (Ji et al, 2016; Sha et al, 2014; Shi et al, 2017; Sun et al, 2016, 2014, 2015) and Hrd1‐knockout (Fujita et al, 2015; Kong et al, 2016; Wu et al, 2014; Xu et al, 2016; Yang et al, 2014) mouse models, including gene deletion in adipocytes, immune cells, enterocytes, and various neurons, has revealed the significance of Sel1L‐Hrd1 ERAD in a cell type‐ and substrate‐specific manner in vivo (Qi et al, 2017). For example, mice with Sel1L deficiency in adipocytes exhibit lipodystrophy and postprandial hyperlipidemia due to the ER retention of lipoprotein lipase (LPL) (Sha et al, 2014). Further, mice with Sel1L ablation in arginine‐vasopressin (AVP) neurons progressively develop polyuria and polydipsia—characteristics of diabetes insipidus, due to a maturation defect of AVP precursor, proAVP, in the ER (Shi et al, 2017). Similarly, mice with Sel1L ablation in proopiomelanocortin (POMC) neurons develop hyperphagia and obesity even under low‐fat chow diet due to ER retention of POMC prohormone (Kim et al, 2018).
In the characterization of hepatocyte‐specific Sel1L‐deficient mice, we discovered that the Sel1L‐Hrd1 ERAD complex plays a key role in regulating Fgf21 transcription and growth in a Crebh‐dependent manner. ER‐resident Crebh is an unstable protein with a half‐life of about 1 h and is targeted for proteasomal degradation by the Sel1L‐Hrd1 ERAD complex. In the absence of Sel1L, Crebh accumulates intracellularly, leading to a marked elevation of Fgf21 gene transcription in the liver and circulating Fgf21 levels. Our data further show that physiological effect of hepatic Sel1L‐Hrd1 ERAD is indeed mediated, at least partially, through the CREBH‐FGF21 axis. Pointing to the physiological significance of Sel1L‐Hrd1 ERAD, we further showed that hepatic Sel1L‐Hrd1 protein complex represses the expression of the Crebh‐Fgf21 axis during growth and fasting‐feeding. Thus, this study identifies the Sel1L‐Hrd1 ERAD complex as a key repressor of Fgf21 transcription in the liver.
Results
Expression of Sel1L‐Hrd1 ERAD in the liver is responsive to physiological signals
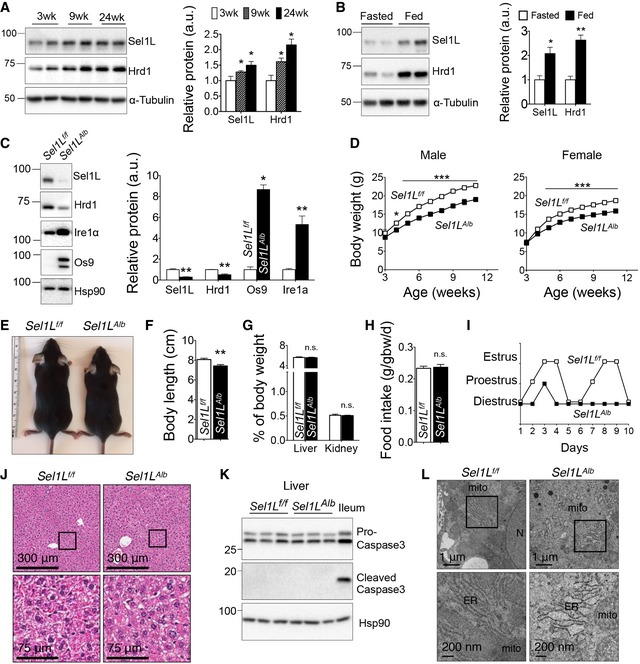
As the liver plays a vital role in nutrient metabolism, we speculate that the levels of Sel1L‐Hrd1 ERAD in the liver may fluctuate in response to metabolic signals during growth and fasting‐feeding. Indeed, protein levels of hepatic Sel1L and Hrd1 were steadily elevated during growth from 3 to 24 weeks of age (Fig 1A) and were significantly higher during feeding than after an overnight fast (Fig 1B). mRNA level of Hrd1, but not Sel1L, was also elevated during growth and feeding (Appendix Fig S1A and B).
Figure 1. Liver‐specific Sel1L deficiency in mice (Sel1L Alb) causes growth retardation.
-
AWestern blot analysis and quantitation of Sel1L‐Hrd1 ERAD proteins in the livers of WT mice at 3, 9 and 24 weeks of age (n = 3–6 per group, 2 independent repeats).
-
BWestern blot analysis and quantitation of Sel1L‐Hrd1 ERAD proteins in the livers of 10‐week‐old WT mice under fasted (overnight) or ad libitum fed conditions (n = 3–6 per group, 2 independent repeats).
-
CWestern blot analysis and quantitation of ERAD proteins in Sel1L f/f and Sel1L Alb livers (n = 4 per group, 3 independent repeats).
-
DGrowth curves of male (n = 10 each) and female (n = 7 each) mice.
-
E, FRepresentative images (E) and nose‐to‐anus length (F) of male mice at 6 weeks of age (n = 6–10 per group).
-
GOrgan‐to‐body‐weight ratios of liver and kidney in 6‐week‐old male mice (n = 6 per group, 3 independent repeats).
-
HDaily food intake (g/day) normalized to gram of body weight (gbw) (n = 3 per group, measured over 3 days).
-
IRepresentative estrus cycle mapping in 2‐ to 4‐month‐old females (n = 6 per group).
-
JH&E images of paraffin‐embedded liver sections from 9‐week‐old mice (n = 4 per group, 3 independent repeats).
-
KWestern blot analysis of cell death (cleaved and pro‐caspase‐3) in livers of 9‐week‐old mice, with WT ileum as positive control (n = 3 per group, 3 independent repeats).
-
LRepresentative transmission electron microscope (TEM) images obtained from 9‐week‐old female mice livers (n = 10–12 cells from one mouse each). N, nucleus; mito, mitochondria; ER, endoplasmic reticulum.
Growth retardation of Sel1L Alb mice
To explore the role of hepatic Sel1L‐Hrd1 ERAD in vivo, we generated liver‐specific Sel1L knockout mice (Sel1L Alb) by crossing Sel1L f/f with the hepatocyte‐specific driver mouse line expressing Cre recombinase under the albumin promoter (Appendix Fig S1C). Sel1L was specifically deleted in the liver (Fig 1C), but not in other tissues such as small intestine (Appendix Fig S1D–F). The protein level of the E3 ligase Hrd1 was significantly reduced by 50% in the absence of Sel1L, while its mRNA level was increased by 2.5‐fold (Fig 1C and Appendix Fig S1G). On the other hand, protein levels of the previously published Sel1L‐Hrd1 ERAD substrate Ire1α and Os9 (Sha et al, 2014; Sun et al, 2015) were increased by 5‐ to 10‐fold in the Sel1L Alb liver (Fig 1C), while their mRNA levels were only modestly upregulated (Appendix Fig S1G).
Interestingly, both male and female Sel1L Alb mice showed significant growth retardation postweaning compared to their WT littermates on regular chow diet (Fig 1D). This growth retardation was due to shorter stature as demonstrated by body length measurements (Fig 1E and F), while ratios of organ to body weights for the liver and kidneys were unaffected (Fig 1G). Daily food intake was comparable (Fig 1H) between the two genotypes. Female Sel1L Alb mice at 2–4 months of age had reduced estrous cycle, which normally lasted 4–5 days in Sel1L f/f littermates (Fig 1I) and hence were largely infertile, but not the males.
Histological examination of the Sel1L Alb livers revealed no obvious abnormalities (Fig 1J), and there was no increase in cell death as measured by TUNEL staining (Fig EV1A) and caspase‐3 cleavage (Fig 1K), nor inflammation as measured by the expression of various inflammatory genes (Fig EV1B). ER stress was only moderately increased in the Sel1L‐deficient hepatocytes, as measured by Ire1α phosphorylation and Xbp1 mRNA splicing in the livers of 9‐week‐old Sel1L Alb mice (Fig EV1C and D) as well as in Sel1L Alb primary hepatocytes (Fig EV1E). Morphologically, the ER in Sel1L Alb hepatocytes was dilated (Fig 1L). These observations are in line with our previous reports in several cell types such as adipocytes and enterocytes that Sel1L deficiency in vivo is associated with a mild adaptive UPR, and uncoupled from inflammation and cell death (Qi et al, 2017; Sha et al, 2014; Sun et al, 2016, 2014, 2015). Taken together, these data demonstrate that Sel1L deficiency in the liver leads to growth retardation without overt inflammation or cell death.
Figure EV1. Lack of cell death, inflammation, and overt ER stress in Sel1L‐deficient hepatocytes.
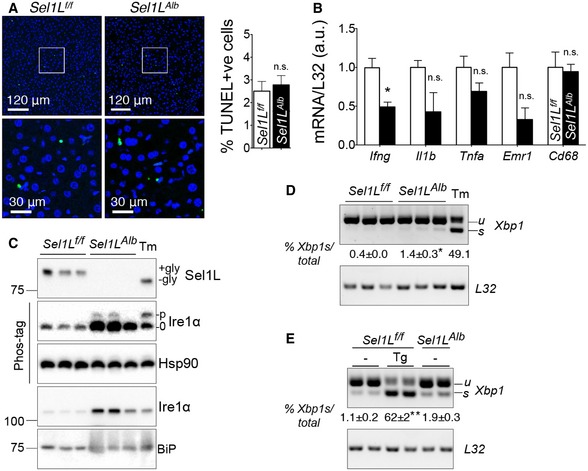
- TUNEL staining of paraffin‐embedded livers of 9‐week‐old mice with quantitation shown on the right (n = 4 per group, 2 independent repeats).
- qPCR analysis of inflammation associated hepatic gene expression in Sel1L f/f and Sel1L Alb mice (n = 4 per group, 3 independent repeats).
- Western blot analysis of Sel1L and UPR proteins (Ire1α and BiP) in the livers of 9‐week‐old mice (n = 3 per group, 3 independent repeats). +/− Gly refers to proteins with or without glycosylation; and p/0 refers to phosphorylated or non‐phosphorylated Ire1α. WT mice injected i.p. with tunicamycin (Tm, 1.5 μg/g body weight) for 72 h were included as a control.
- RT–PCR analysis of Xbp1 splicing in the livers of 9‐week‐old mice (n = 3 per group, 3 independent repeats); u/s/t refers to unspliced/spliced/total Xbp1. WT mice injected i.p. with tunicamycin (Tm, 1.5 μg/g body weight) for 72 h were included as a control.
- RT–PCR analysis of Xbp1 splicing in primary mouse hepatocytes (n = 2 per group, 2 independent repeats). WT primary hepatocytes treated with 200 nM thapsigargin (Tg) for 6 h were included as a control. Quantitation of the percent of Xbp1s in total Xbp1 mRNA is shown below.
Elevated Fgf21 levels in the absence of Sel1L
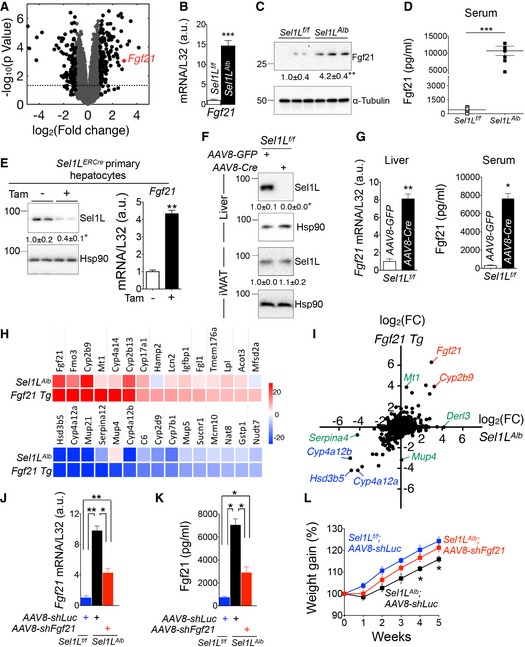
To explore how deletion of Sel1L in the liver has such a profound effect on growth, we performed transcriptomics analysis of the livers from Sel1L Alb mice and their control littermates at 9 weeks of age. A total of 169 genes were significantly upregulated, while 129 genes were significantly downregulated (P < 0.05, black dots represent fold change > 2) in Sel1L Alb livers (Fig 2A). Gene set enrichment analysis confirmed significant upregulation of “protein processing in the ER”, in keeping with the notion that Sel1L deficiency triggers cellular adaptation in hepatocytes. Additionally, various key metabolic pathways, including “insulin sensitivity”, “PI3K‐Akt pathways”, “steroid hormone synthesis”, and more, were significantly affected in Sel1L Alb livers (Appendix Fig S2A).
Figure 2. Elevated Fgf21 expression in the liver as well as circulating Fgf21 in the absence of Sel1L.
-
AVolcano plot depicting transcriptomics data from the livers of 9‐week‐old Sel1L f/f and Sel1L Alb mice (n = 3 per group); dotted line marks P = 0.05; black dots represent fold change > 2.
-
B, CqPCR (B) and Western blot (C) analyses of Fgf21 expression in 9‐week‐old livers (n = 3–6 per group, 3 independent repeats).
-
DELISA analysis of Fgf21 in serum from 8‐ to 9‐week‐old mice (n = 6–7 per group).
-
EProtein levels of Sel1L (left panel) and mRNA levels of Fgf21 (right panel) in primary mouse hepatocytes isolated from the tamoxifen‐inducible Sel1L‐knockout Sel1L ERCre mice (2 independent repeats).
-
F, GAcute loss‐of‐function model where 8‐week‐old Sel1L f/f mice were injected i.v. with either AAV8‐Cre or control AAV8‐GFP: (F) Western blot analysis of hepatic and control adipose Sel1L protein (n = 3 per group); and (G) qPCR analysis of hepatic Fgf21 expression and ELISA analysis of serum Fgf21 (n = 3 per group, 2 independent repeats).
-
HHeatmaps of top 15 significantly upregulated and downregulated genes in Fgf21 Tg livers and their expression levels in Sel1L Alb livers (n = 3 per group).
-
IScatter plot depicting the logarithmic fold change (FC) for 16,402 genes in Sel1L Alb and Fgf21 transgenic (Tg) livers (n = 3 per group); genes that are highly upregulated or downregulated in both datasets are marked in red and blue, respectively; genes that are upregulated unique to each data set (e.g., Derl3 for Sel1L‐Hrd1 ERAD‐deficient liver) are marked in green.
-
J–LData from rescue experiments where 5‐week‐old Sel1L f/f and Sel1L Alb mice were injected i.v. with AAV8‐shFgf21 or control AAV8‐shLuc: (J‐K) qPCR analysis of Fgf21 mRNA (J) and ELISA analysis of Fgf21 in serum (K) 3 weeks after injection (n = 4 per group). (L) Weight gain curve after injection (n = 7 per group).
Interestingly, Fgf21, a fasting‐induced hormone, was one of the top hits among the most highly upregulated genes in Sel1L Alb mice (Fig 2A). Quantitative PCR (qPCR) and Western blot analyses showed a 13‐ and 4‐fold increase of Fgf21 mRNA and protein levels, respectively, in the Sel1L Alb livers (Fig 2B and C). Strikingly, serum levels of Fgf21 were elevated by over 20‐fold in Sel1L Alb mice, reaching to ~ 10 ng/ml vs. ~ 0.5 ng/ml in WT littermates (Fig 2D). As a control, Fgf21 expression in brown and white adipose was not changed (Appendix Fig S2B).
To exclude potential developmental defects associated with chronic Sel1L deletion, we performed acute Sel1L deletion in the following two experiments. First, we cultured primary hepatocytes from a tamoxifen‐inducible Sel1L‐floxed mouse model (Sel1L ERCre) and found that Fgf21 expression was significantly increased upon the addition of tamoxifen (Fig 2E). Second, we injected 8‐week‐old Sel1L f/f mice once i.v. with adeno‐associated virus serotype 8 (AAV8)‐expressing Cre recombinase (or control GFP). Acute injection of AAV8‐Cre abolished Sel1L protein level specifically in the liver, not in white adipose tissue (Fig 2F) 2–3 weeks’ postinjection. Similar to the chronic Sel1L Alb model, acute Sel1L deletion led to an 8‐fold increase of hepatic Fgf21 mRNA, and a profound 14‐fold elevation of circulating Fgf21 levels (Fig 2G). Hence, these data firmly establish the key role of hepatic Sel1L‐Hrd1 ERAD in regulating Fgf21 levels in both chronic and acute Sel1L‐deficient models.
We next performed an unbiased comparison of genome‐wide expression analyses of genes that were altered in Sel1L Alb livers to genome‐wide expression analysis of genes altered in Fgf21‐overexpressing transgenic mouse livers (Fgf21 Tg; GEO dataset series GSE39313). Indeed, the two datasets showed a large overlap among the top 15 upregulated or downregulated hepatic genes (Fig 2H and Appendix Fig S2C). This analysis further revealed a positive correlation between the genes altered in both datasets, as evident from the polarization of the scatter plot toward the top‐right and bottom‐left quadrants (Fig 2I). Several examples of shared genes are highlighted in red (upregulated) and blue (downregulated) while those unique to each dataset, i.e., close to either axis, are marked in green (Fig 2I). Therefore, Sel1L deficiency in the liver results in elevated Fgf21 expression and circulating Fgf21.
Systemic metabolic changes of Sel1L Alb mice are in part mediated by Fgf21
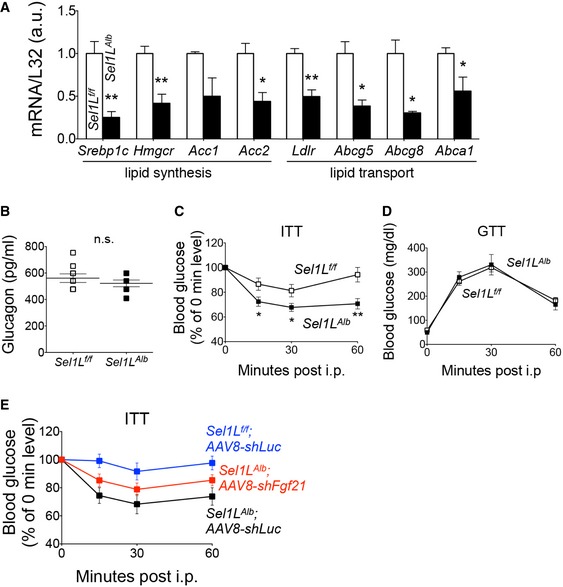
To further establish the causal link between elevated Fgf21 levels and Sel1L deficiency‐associated systemic changes, we injected Sel1L Alb mice with AAV8 encoding shRNA against Fgf21 or control luciferase (luc). As a result of this knockdown, both the hepatic mRNA and circulating levels of Fgf21 in these mice were reduced by around 60% (Fig 2J–K) while having no effect on the Sel1L‐Hrd1 protein levels in the liver (Appendix Fig S3A). Interestingly, this knockdown partially reversed the growth retardation (Fig 2L) and rescued the reduced female fertility (Appendix Fig S3B) of the Sel1L Alb mice.
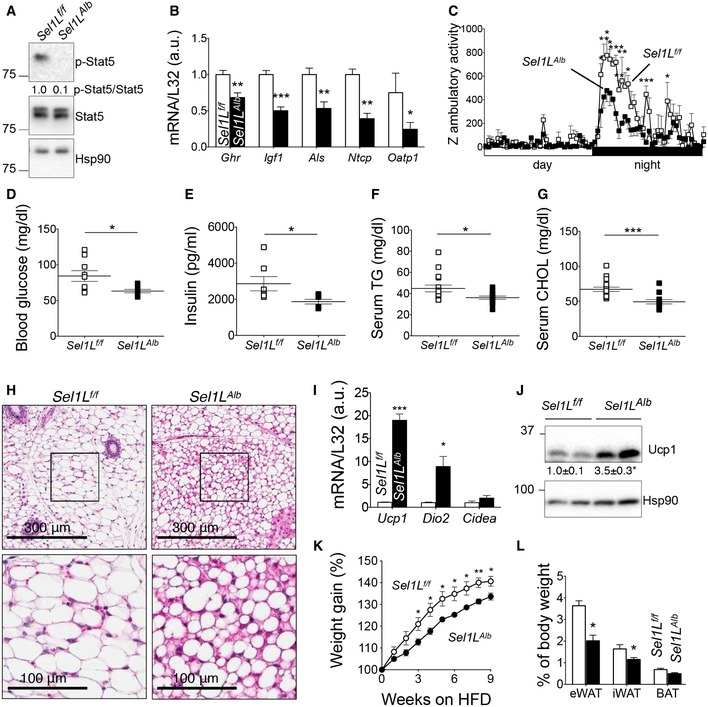
To provide further evidence for the Sel1L‐Fgf21 link, we next asked whether Sel1L Alb mice phenocopy Fgf21 gain‐of‐function models. Fgf21 has many metabolic effects aimed at promoting organismal adaptation to starvation (BonDurant et al, 2017; Potthoff et al, 2012). Importantly, similar to our Sel1L Alb mice, Fgf21 transgenic mice also exhibited growth retardation, which was partially mediated by Stat5‐dependent signaling pathways (Inagaki et al, 2008; Kharitonenkov et al, 2005; Owen et al, 2014; Zhang et al, 2012a,b). Indeed, in line with Fgf21 gain‐of‐function models, Stat5 phosphorylation was markedly decreased in Sel1L Alb livers (Fig 3A) with diminished expression of various growth‐related, p‐Stat5‐associated genes such as Growth hormone receptor (Ghr), Insulin‐like growth factor‐1 (Igf1), Acid labile subunit (Als), Na + ‐taurocholate cotransporting polypeptide (Ntcp), and Organic anion transporter family member‐1 (Oatp1) (Fig 3B). Moreover, in line with the suppressive effect of Fgf21 on hepatic lipogenesis (Chau et al, 2010; Zhu et al, 2014), many genes involved in hepatic lipid synthesis and transport, including Sterol regulatory element‐binding protein‐1c (Srebp1c), 3‐Hydroxy‐3‐methylglutaryl‐CoA reductase (Hmgcr), Acetyl‐CoA carboxylase‐1/2 (Acc1/2), Low‐density lipoprotein receptor (Ldlr), ATP binding cassette subfamily G member‐5/8 (Abcg5/8), and ATP binding cassette subfamily A member‐1 (Abca1), were significantly downregulated in Sel1L Alb livers compared to those of their WT littermates (Fig EV2A).
Figure 3. Sel1L Alb mice phenocopy Fgf21‐gain‐of‐function mice.
-
AWestern blot analysis of p‐Stat5 in livers of 9‐week‐old mice (n = 3 per group, 3 independent repeats), with quantitation of the ratio of p‐Stat5 to total Stat5 shown below the blot.
-
BqPCR analysis of p‐Stat5‐associated growth genes in the livers of 9‐week‐old mice (n = 6 per group, 2 independent repeats).
-
CZ ambulatory activity of 9‐week‐old male mice as measured over 24 h (n = 4 males per group).
-
D–GBlood glucose (D), serum insulin (E), serum triglyceride (TG) (F), serum cholesterol (CHOL) (G) levels in 9‐week‐old mice after 6 h fasting (n = 6–10 per group).
-
HH&E images of inguinal white adipose tissue (iWAT) from 8‐week‐old mice (n = 3 per group, 2 independent repeats).
-
IqPCR analysis of browning‐related genes in iWAT (n = 3–6 per group).
-
JWestern blot analysis of Ucp1 in iWAT of 8‐week‐old mice (n = 3–4 per group, 3 independent repeats).
-
KWeight gain curve of male mice after 60% high‐fat diet (HFD) starting at 5 weeks of age (n = 4 per group, 2 independent repeats).
-
LAdipose tissue weight normalized to body weight in male mice following 9 weeks of HFD feeding (n = 4 per group).
Figure EV2. Hepatic Sel1L‐Hrd1 ERAD‐deficient mice have altered metabolism.
-
AqPCR analysis of lipid synthesis and transport genes in 9‐week‐old mice (n = 6 per group, 2 independent repeats).
-
BSerum glucagon levels after 6 h of fast in the morning (n = 5–6 per group).
-
C, DInsulin tolerance test (ITT) (C) and glucose tolerance test (GTT) (D) of 10‐week‐old male mice (n = 6 per group).
-
EInsulin tolerance test (ITT) 3 weeks after i.v. injection (n = 5–6 per group) with AAV8‐shFgf21 or control AAV8‐shLuc.
In mice, Fgf21 is known to induce torpor, a hibernation‐like energy‐conserving, low‐activity physical state (Bookout et al, 2013; Inagaki et al, 2007). Indeed, Sel1L Alb mice exhibited lower ambulatory activity compared to that of WT littermates (Fig 3C). Moreover, similar to Fgf21 gain‐of‐function mouse models (Inagaki et al, 2007; Kharitonenkov et al, 2005; Owen et al, 2014), Sel1L Alb mice exhibited reduced blood glucose levels (Fig 3D), lower serum insulin levels (Fig 3E) with comparable serum glucagon levels (Fig EV2B), and significantly decreased serum triglyceride and cholesterol levels (Fig 3F and G) compared to wild‐type littermates. Additionally, Sel1L Alb mice exhibited improved insulin sensitivity, but comparable glucose tolerance (Fig EV2C and D). This improved insulin sensitivity phenotype was also partially reversed upon AAV‐mediated Fgf21 knockdown (Fig EV2E) in Sel1L Alb mice.
Fgf21 is known to affect white adipose tissue browning (BonDurant et al, 2017; Fisher et al, 2012; Hondares et al, 2010; Owen et al, 2014; Park et al, 2016a). Histological assessment of inguinal white adipose tissue depots from Sel1L Alb mice revealed smaller lipid droplets (Fig 3H), which was confirmed by immunostaining for the lipid droplet marker perilipin (Appendix Fig S4A and B). Indeed, in the inguinal white adipose tissues of Sel1L Alb mice, expression levels of genes associated with browning such as Uncoupling protein‐1 (Ucp1) and Iodothyronine deiodinase‐2 (Dio2) were significantly elevated by ~ 20‐ and ~ 10‐fold, respectively (Fig 3I). Protein levels of Ucp1 were tripled in inguinal white adipose tissues of Sel1L Alb mice (Fig 3J).
Fgf21 is also considered as an anti‐obesity hormone owing to its ability to confer resistance to diet‐induced weight gain (Kharitonenkov et al, 2005). In keeping with this, Sel1L Alb mice exhibited significantly reduced weight gain (Fig 3K) upon being fed a 60% high‐fat diet, along with significantly reduced fat depots (Fig 3L and Appendix Fig S4C) and improved insulin sensitivity (Appendix Fig S4D), overall suggestive of an ameliorated response to diet‐induced obesity. Therefore, we conclude that the metabolic phenotypes of Sel1L Alb mice are in part mediated through Fgf21.
Crebh, not Pparα, accumulates intracellularly in the absence of Sel1L
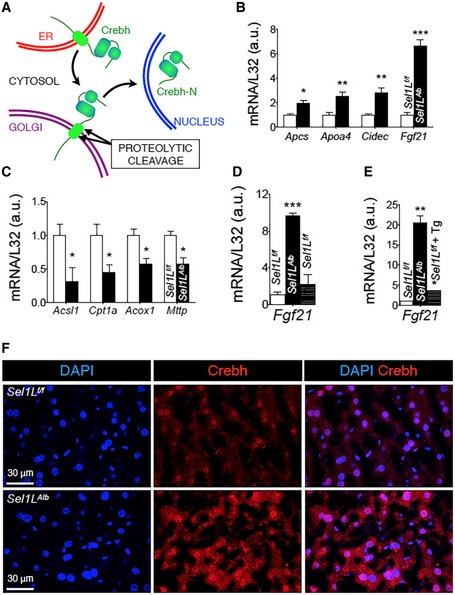
We next explored how Sel1L or Sel1L‐Hrd1 ERAD is linked to Fgf21 in the liver. Fgf21 expression is transcriptionally controlled synergistically by nuclear receptor Pparα and Crebh. The schematic model depicting the intracellular trafficking of Crebh from ER to Golgi, proteolytic cleavage at Golgi and nuclear entry is shown in Fig EV3A. Additionally, Fgf21 expression may also be regulated via transcription factors such as Xbp1s in response to ER stress (De Sousa‐Coelho et al, 2012, 2013; Kim et al, 2013b; Laeger et al, 2014; Wan et al, 2014); however, the physiological significance of these regulators remains to be established.
Figure EV3. Hepatic Sel1L regulates protein stability and activity of Crebh, not Pparα.
-
ASchematic diagram showing the intracellular trafficking of ER‐resident Crebh protein to the Golgi for proteolysis, leading to the generation of Crebh‐N. Crebh‐N subsequently translocates into the nucleus to activate gene transcription.
-
B, CqPCR analysis of Crebh (B) and Pparα (C) target genes in WT and Sel1L Alb livers of 9‐week‐old mice (n = 4 per group, 2 independent repeats).
-
DqPCR analysis of hepatic Fgf21 expression in the livers of 9‐week‐old Sel1L f/f and Sel1L Alb mice (n = 3 per group, 2 independent repeats). WT mice injected i.p. with tunicamycin (Tm, 1.5 μg/g body weight) for 72 h were included as a control.
-
EqPCR analysis of Fgf21 expression in primary hepatocytes (n = 2 per group, 2 independent repeats). WT primary hepatocytes treated with 200 nM thapsigargin (Tg) for 6 h are included as a control.
-
FRepresentative immunostaining images (zoomed out from Fig 4H) from 8‐week‐old liver cryosections.
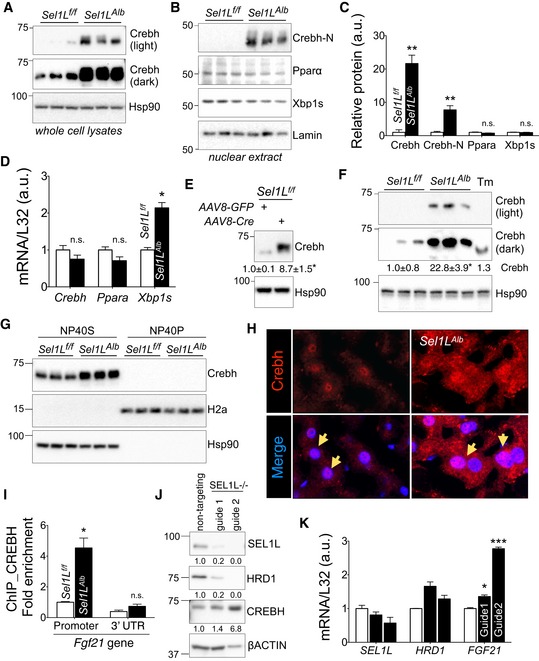
Excitingly, Crebh protein levels were significantly elevated (> 20‐fold) in the livers of Sel1L Alb mice at 9 weeks of age (Fig 4A and quantitated in Fig 4C). By contrast, the protein levels of Pparα and Xbp1s were unchanged (Fig 4B and quantitated in Fig 4C). Importantly, this Crebh protein accumulation was due to a post‐transcriptional mechanism as the mRNA levels of Crebh were not affected by Sel1L deficiency (Fig 4D). Moreover, the nuclear, active form of Crebh (Crebh‐N) was also significantly upregulated by ~ 8‐fold in Sel1L Alb livers (Fig 4B and quantitated in Fig 4C). Similar induction of Crebh protein was observed in the livers of adult mice with acute deletion of Sel1L (Fig 4E).
Figure 4. Sel1L deficiency leads to the accumulation of Crebh in the liver.
-
A–CWestern blot analysis of Crebh, Crebh‐N, Pparα, and Xbp1s in whole cell lysates (A) and nuclear extracts (B) in WT and Sel1L Alb livers (n = 3 per group, 3 independent repeats) with quantitation shown in (C).
-
DqPCR analysis of Crebh, Ppara, and Xbp1s in WT and Sel1L Alb livers (n = 4–6 per group, 2 independent repeats).
-
EWestern blot analysis of Crebh in acute Sel1L loss‐of‐function model as described in Fig 2F and G (n = 3 per group).
-
FWestern blot analysis of Crebh protein in 9‐week‐old mice (n = 3 per group, 2 independent repeats). WT mice injected i.p. with tunicamycin (Tm, 1.5 μg/g body weight) for 72 h were included as a control.
-
GWestern blot analysis of Crebh in the livers of 9‐week‐old mice after NP‐40‐detergent fractionation into NP‐40 soluble (NP‐40S) and pellet (NP‐40P) (n = 3 per group, 2 independent repeats).
-
HRepresentative confocal images of Crebh in the liver cryosections of 8‐week‐old mice (zoomed out versions in Fig EV3F). Note that a fraction of hepatocytes is binucleated. nellow arrows represent Crebh staining inside in the hepatocyte nucleus.
-
IChIP analysis of Crebh binding onto the Fgf21 promoter in the livers of 9‐week‐old mice, normalized first to 5% input group and then to no‐antibody ChIP samples (n = 3 pooled per group, 2 independent repeats).
-
J, KWestern blot analysis of SEL1L, HRD1, and CREBH proteins (J) and qPCR analysis of SEL1L, HRD1, and FGF21 (K) in human Hep3B hepatocytes upon CRISPR deletion of SEL1L with two different guides.
QPCR analysis further confirmed that, in addition to Fgf21, several other known Crebh target genes, such as Amyloid P component, serum (Apcs), Apolipoprotein‐A4 (Apoa4), and Cell death inducing DFFA like effector c (Cidec) (Park et al, 2016a,b; Xu et al, 2014; Zhang et al, 2006), were also significantly upregulated in Sel1L Alb livers (Fig EV3B). In contrast, canonical Pparα targets such as Acyl‐CoA synthetase long‐chain family member 1 (Acsl1), Carnitine palmitoyltransferase 1A (Cpt1a), Acyl‐CoA oxidase 1 (Acox1), and Microsomal triglyceride transfer protein (Mttp) were significantly downregulated in Sel1L Alb livers (Fig EV3C).
As Fgf21 expression is reportedly induced by ER stress (Jiang et al, 2014; Kim et al, 2013a; Schaap et al, 2013), we next compared the effect of Sel1L‐Hrd1 ERAD deficiency to pharmacological UPR activation on Crebh accumulation and Fgf21 expression. First, the Crebh protein accumulation in Sel1L Alb livers was much higher than that in the livers of wild‐type mice challenged with the potent pharmacological ER stress inducer tunicamycin (Fig 4F). Additionally, the transcriptional induction of Fgf21 in Sel1L Alb livers or primary hepatocytes was much more pronounced compared to that in tunicamycin‐challenged WT liver or in thapsigargin‐treated WT primary hepatocytes (Fig EV3D and E), in spite of much higher ER stress observed in the latter (Fig EV1C–E). We conclude that hepatic Sel1L‐Hrd1 ERAD regulates Fgf21 induction through a mechanism involving Crebh, but independently of Pparα‐ or ER stress.
Like the other recently characterized Sel1L‐Hrd1 ERAD substrate Ire1α (Sun et al, 2015), the accumulated Crebh protein in Sel1L‐deficient hepatocytes remained soluble in mild detergent NP‐40 (Fig 4G), suggesting that Crebh does not form insoluble aggregates in the absence of Sel1L‐Hrd1 ERAD. Moreover, confocal immunostaining of Crebh further demonstrated the intracellular accumulation of Crebh protein including in the nucleus of Sel1L Alb hepatocytes when compared to WT livers (Fig 4H and zoomed‐out images shown in Fig EV3F). Chromatin immunoprecipitation (ChIP) of Crebh revealed increased binding of Crebh onto the proximal promoter of the Fgf21 gene in Sel1L Alb liver vs. WT liver (Fig 4I).
Finally, to demonstrate a similar mechanism in human hepatocytes, we knocked out Sel1L via the CRISPR/Cas9 system in the human hepatoma cell line Hep3B. Acute deletion of Sel1L significantly increased CREBH protein level and Fgf21 gene expression (Fig 4J–K). Taken together, we conclude that Sel1L deficiency in the liver leads to intracellular and nuclear accumulation of Crebh in both mice and humans.
ER‐resident Crebh is an endogenous Sel1L‐Hrd1 ERAD substrate
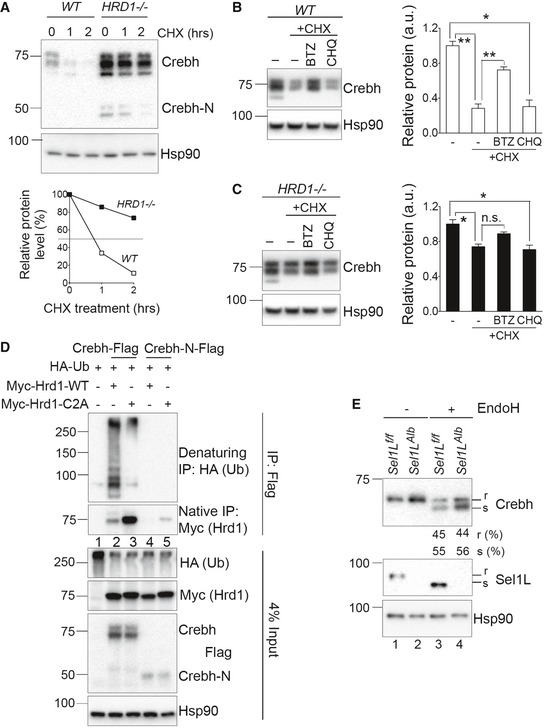
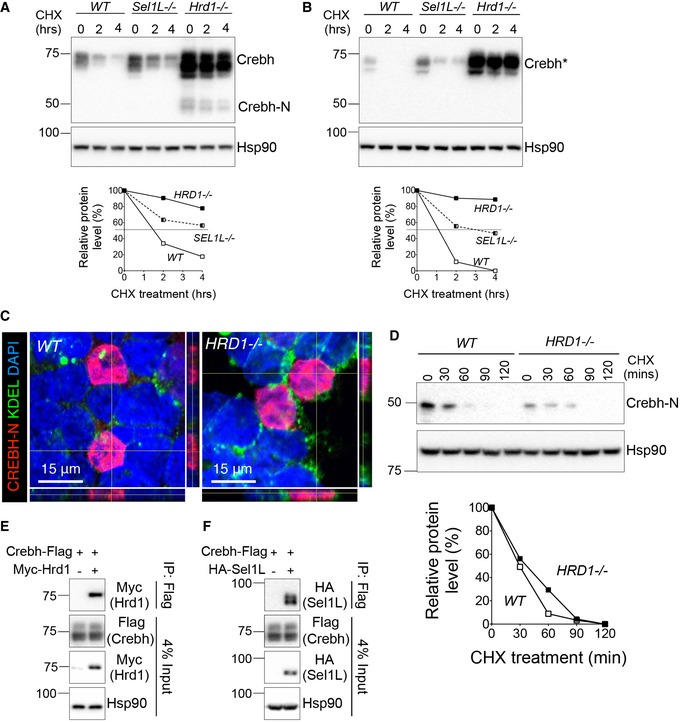
A marked accumulation of Crebh protein in Sel1L‐deficient cells prompted us to test the hypothesis that Crebh is a bona fide endogenous Sel1L‐Hrd1 ERAD substrate in the liver. In keeping with our hypothesis, a previous study showed that Crebh is degraded by proteasomes (Bailey et al, 2007), but the nature and significance of this degradation event remains unknown. Indeed, Crebh protein was unstable with a half‐life of about 45 min in Crebh‐transfected HEK293T cells treated with the translation inhibitor cycloheximide (Fig 5A). Crebh protein became greatly stabilized with half‐lives of over 4 h in SEL1L −/− and HRD1 −/− cells (Figs 5A and EV4A). Notably, accumulation and stabilization of Crebh protein were more pronounced in HRD1 −/− cells than in SEL1L −/− cells, potentially owing to the residual Hrd1 protein in SEL1L−/− cells (Fig 1C; Kim et al, 2018).
Figure 5. Crebh is an Sel1L‐Hrd1 ERAD substrate.
-
AWestern blot analysis of Crebh protein half‐life in transfected WT and HRD1−/− HEK293T cells treated with cycloheximide (CHX) for indicated times. The decay of protein from one experiment is shown below.
-
B, CWestern blot analysis and quantitation of Crebh in Crebh‐transfected WT (B) and HRD1 −/− (C) HEK293T cells pre‐treated with the proteasomal inhibitor bortezomib (BTZ) or lysosomal inhibitor chloroquine (CHQ) for 2 h and then with CHX for additional 1 h (n = 2 per group, 2 independent repeats).
-
DWestern blot analysis of Crebh ubiquitination following immunoprecipitation (IP) of Crebh‐Flag and Crebh‐N‐Flag in HEK293T cells transfected with indicated plasmids. Samples were boiled with SDS before IP for denaturing IP and not so for native IP. These cells were treated with proteasomal inhibitor BTZ for the last 6 h prior to immunoprecipitation.
-
EWestern blot analysis of endoglycosidase H (endoH) sensitivity of Crebh in the livers of 9‐week‐old mice; “r” refers to endoH‐cleavage‐resistant species and “s” refers to endoH‐cleavage‐sensitive species (n = 3 per group, 2 independent repeats).
Figure EV4. Crebh, and not Crebh‐N, is an ERAD substrate.
-
A, BWestern blot analysis of Crebh (A) and cleavage‐defective‐Crebh (B, Crebh*) half‐life in transfected WT, Sel1L −/− , and Hrd1 −/− N2a cells treated with cycloheximide (CHX) for indicated times. The decay of Crebh proteins is shown below.
-
CRepresentative immunostaining images of transfected Crebh‐N‐Flag protein 24‐h posttransfection into WT and HRD1 −/− HEK293T cells.
-
DWestern blot analysis and quantitation of Crebh‐N protein decay in Crebh‐N‐Flag‐transfected WT and HRD1 −/− HEK293T cells with cycloheximide (CHX) treatment for the indicated times, with quantitation shown below.
-
E, FCo‐immunoprecipitation analysis of Crebh with Hrd1 (E) and Sel1L (F) when co‐expressed in HEK293T cells.
As Crebh is cleaved in the Golgi to generate N‐terminal fragment Crebh‐N, we next generate cleavage‐defective Crebh by mutating its S1P and S2P cleavage sites (Zhang et al, 2006). Indeed, similar to wild‐type Crebh, non‐cleavable Crebh mutant was unstable and became stabilized in the absence of Sel1L and Hrd1 (Fig EV4B). Moreover, unlike Crebh, steady‐state protein levels and half‐life of Crebh‐N protein were not affected by Hrd1 deficiency (Fig EV4C and D). Hence, these data point to the specificity of the Sel1L‐Hrd1 ERAD effect toward ER‐resident Crebh, not cleaved the Crebh‐N fragment.
To further examine the contribution of proteasomes vs. lysosomes in the clearance of Crebh protein, we treated Crebh‐transfected cells with proteasome inhibitor bortezomib (BTZ) or lysosomal inhibitor chloroquine (CHQ) in the presence of cycloheximide (CHX). BTZ, but not CHQ, stabilized Crebh protein (Fig 5B). Moreover, the effect of BTZ on Crebh protein was dampened in HRD1‐deficient cells (Fig 5C), further supporting the notion that degradation of Crebh is largely mediated by the Sel1L‐Hrd1 ERAD complex.
Crebh interacted strongly with both Hrd1 and Sel1L under regular native immunoprecipitation conditions (Fig EV4E and F and Lane 2, Fig 5D). Additionally, following lysate denaturing prior to immunoprecipitation, robust ubiquitination of Crebh protein was detected and blocked upon expression of catalytically inactive Hrd1 C2A mutant (top panel Lanes 1–3, Fig 5D). In contrast, Crebh‐N did not interact strongly with, nor was ubiquitinated by, Hrd1 (Lanes 4–5, Fig 5D). Together, these data demonstrate that Crebh is targeted for proteasomal degradation by Sel1L‐Hrd1 ERAD, requiring the activity of Hrd1 E3 ligase.
Sel1L‐Hrd1 ERAD deficiency does not affect the ER‐to‐Golgi trafficking of Crebh
Although ER stress was previously reported to be required for the ER exit of Crebh (Zhang et al, 2006), a recent study suggested that may not be the case, but rather Crebh constitutively migrates to the Golgi (Xu et al, 2014). Does Sel1L‐Hrd1 ERAD affect ER‐to‐Golgi trafficking of Crebh? As Crebh undergoes N‐linked glycosylation in the ER, a step required for its ER exit to Golgi (Bailey et al, 2007; Chan et al, 2010), we next tested the endoglycosidase H (endoH) sensitivity of Crebh protein to distinguish ER‐ vs. Golgi‐resident Crebh. Interestingly, despite having elevated total protein level at the basal state, Sel1L‐deficient liver exhibited a similar percent of endoH resistant to sensitive Crebh protein to that in WT liver (Lanes 3 vs. 4, Fig 5E). Indeed, at the steady state, nearly 50% of CREBH were endoH resistant, i.e., at the Golgi, regardless of ERAD status, suggesting that a large portion of CREBH constitutively exits the ER. As a control, Sel1L as an ER‐resident protein was completely endoH sensitive (Lanes 1 vs. 3, Fig 5E). Hence, our data suggest that Sel1L‐Hrd1 ERAD does not regulate the trafficking of Crebh from the ER to Golgi.
Crebh links hepatic Sel1L‐Hrd1 ERAD to Fgf21 and systemic metabolic regulation
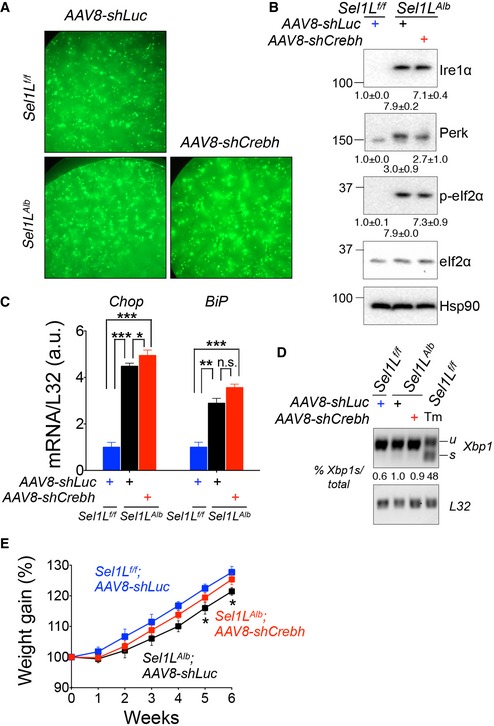
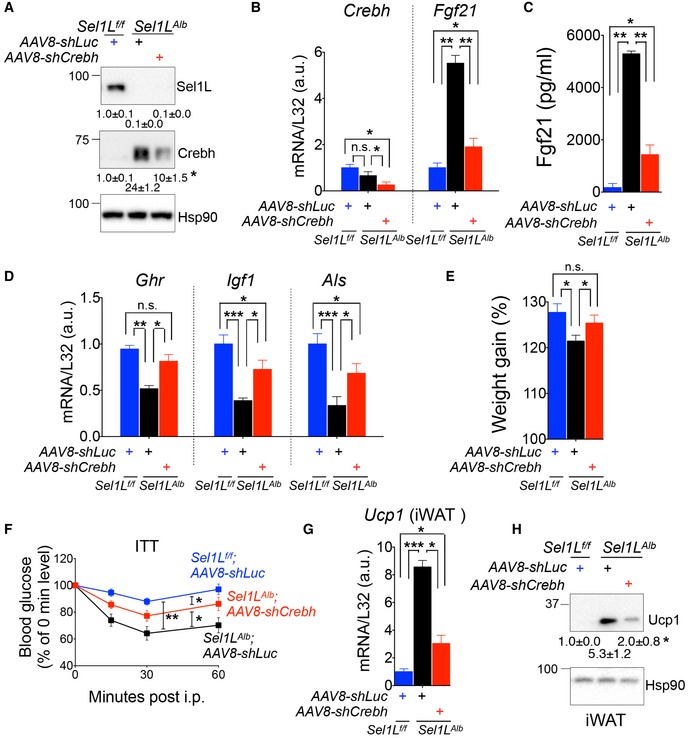
To demonstrate whether Crebh indeed links Sel1L‐Hrd1 ERAD to Fgf21 and systemic metabolic regulation, we deleted Crebh in the livers of Sel1L Alb mice by i.v. injecting GFP‐encoding AAV8 expressing shRNA against Crebh (shCrebh) or control luciferase (shLuc). Five weeks after AAV injection, GFP‐positive livers were observed in all cohorts (Fig EV5A). shCrebh injection resulted in a ~ 60% reduction of Crebh protein and mRNA levels in Sel1L Alb livers (Fig 6A and B), and in conjunction, both mRNA and circulating levels of Fgf21 in Sel1L Alb mice were reduced by ~ 75% (Fig 6B and C). Importantly, the ER stress response markers such as Xbp1 mRNA splicing and Ire1a/Perk pathway activation were not affected by Crebh knockdown in shCrebh‐injected Sel1L Alb livers compared to the shLuc‐injected Sel1L Alb livers (Fig EV5B–D), further underscoring that the effect of Sel1L‐Hrd1 ERAD on Fgf21 is largely uncoupled from ER stress.
Figure EV5. Crebh deletion does not affect ER stress level in Sel1 LA lb liver.
-
ARepresentative images of livers from Sel1L f/f and Sel1L Alb mice (n = 6 per group) post‐AAV‐shRNA‐GFP injection showing green (GFP positive) livers.
-
B–DWestern blot analysis (B), qPCR analysis (C), and RT–PCR analysis of Xbp1 mRNA splicing (D) of hepatic UPR markers in Sel1L f/f and Sel1L Alb mice 5 weeks post‐one i.v. AAV8‐shCrebh or control AAV8‐shLuc injection (n = 3 per group, 2 independent repeats). Quantitation of protein levels (B) and the percent of Xbp1s in total Xbp1 mRNA (D) is shown below. WT mice injected i.p. with tunicamycin (Tm, 1.5 μg/g body weight) for 72 h were included as a control.
-
EWeekly weight gain post‐i.v. injection (n = 10 per group) with AAV8‐shFgf21 or control AAV8‐shLuc.
Figure 6. Crebh links hepatic Sel1L‐Hrd1 ERAD to Fgf21.
-
AWestern blot analysis of hepatic Sel1L and Crebh 5 weeks postinjection (n = 3 mice each, 2 independent repeats).
-
B, CqPCR analysis of Crebh and Fgf21 mRNA (B) and ELISA analysis of circulating Fgf21 (C) 5 weeks postinjection (n = 3 per group, 2 independent repeats).
-
DqPCR analysis of hepatic growth‐associated genes 5 weeks after injection (n = 6 per group).
-
EWeight gain 6 weeks postinjection (n = 10 per group).
-
FInsulin tolerance test (ITT) 5 weeks after injection (n = 10 per group).
-
G, HqPCR (G) and Western blot analysis (H) of Ucp1 levels in inguinal white adipose tissue (iWAT) 5 weeks postinjection (n = 3 per group, 2 independent repeats).
Upon Crebh deletion, the expression levels of p‐Stat5‐dependent, growth‐associated genes were also elevated in Sel1L Alb mice compared to those receiving shLuc (Fig 6D). Indeed, Sel1L Alb mice with Crebh deletion showed better weight gain than Sel1L Alb mice injected with shLuc control (Figs 6E and EV5E). Moreover, deletion of Crebh in Sel1L Alb mice also partially reversed the insulin sensitivity of Sel1L Alb mice (Fig 6F). Lastly, Crebh knockdown markedly reduced the Ucp1 expression in white adipose tissue that was observed in Sel1L Alb mice (Fig 6G and H). Hence, hepatic Sel1L‐Hrd1 ERAD regulates growth and systemic metabolism, at least in part, via the suppression of the “Crebh‐Fgf21” axis.
Sel1L‐Hrd1 ERAD suppresses “Crebh‐Fgf21” axis under multiple physiological contexts
The above results pointed to Sel1L‐Hrd1 ERAD as a key regulator of the “Crebh‐Fgf21” axis with significant impact on systemic metabolism. We next asked whether there is a correlation between Sel1L‐Hrd1 ERAD and Crebh‐Fgf21 under two physiological settings—fasting‐feeding and growth.
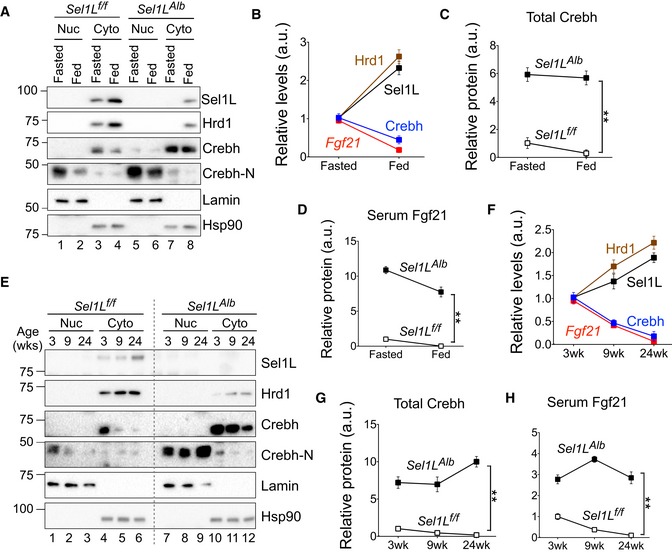
During feeding, hepatic Sel1L and Hrd1 levels were markedly higher than during fasting (Fig 1B and Lanes 3 vs. 4, Fig 7A), while protein levels of Crebh and Crebh‐N exhibited the opposite trend (Lanes 3 vs. 4 and 1 vs. 2, Fig 7A). Indeed, there was negative correlation between Sel1L‐Hrd1 proteins and Crebh protein/Fgf21 mRNA levels under fasting‐feeding (Fig 7B). Furthermore, Crebh protein level was highly elevated and remained largely constant during fasting‐feeding in Sel1L‐deficient liver (Lanes 7–8 vs. 3–4, Fig 7A and quantitated in Fig 7C), suggesting that Sel1L‐Hrd1 ERAD is largely responsible for the decline of Crebh protein level in the fed state. Consequently, the circulating levels of Fgf21 were also greatly elevated in both fasted and fed states of Sel1L‐deficient mice (Fig 7D).
Figure 7. Sel1L‐Hrd1 ERAD represses Crebh and Fgf21 under fasting‐feeding and growth.
-
AWestern blot analysis of hepatic Sel1L‐Hrd1 ERAD and Crebh of nuclear (Nuc) and cytosolic (Cyto) fractions from 10‐week‐old Sel1L f/f and Sel1L Alb mice under overnight fasted or fed states.
-
BQuantitation of levels of Sel1L/Hrd1/Crebh proteins and Fgf21 mRNA in the livers of 10‐week‐old Sel1L f/f mice.
-
CQuantitation of total Crebh (Crebh+Crebh‐N) protein levels in the livers of 10‐week‐old Sel1L f/f and Sel1L Alb mice.
-
DSerum Fgf21 levels in 10‐week‐old Sel1L f/f and Sel1L Alb mice.
-
E–HSimilar to (A–D) with the exception that these experiments were done with the livers from Sel1L f/f and Sel1L Alb mice at 3, 9, and 24 weeks of age.
During growth, hepatic Sel1L and Hrd1 proteins also steadily increased with age from 3 to 24 weeks (Fig 1A and Lanes 4–6, Fig 7E), while protein levels of both Crebh and Crebh‐N steadily decreased (Lanes 1–6, Fig 7E). There was a negative correlation between Sel1L‐Hrd1 proteins and Crebh protein/Fgf21 mRNA levels in WT mice during growth (Fig 7F). Importantly, in the Sel1L Alb mice, the decline of hepatic Crebh protein was markedly blunted by the Sel1L deficiency (Lanes 7–12 vs. 1–6, Fig 7E and quantitated in Fig 7G). This results in highly elevated circulating Fgf21 levels over the different ages of the Sel1L Alb mice, unlike the gradual decline with age in WT mice (Fig 7H).
Therefore, these data not only demonstrate an inverse association between hepatic Sel1L‐Hrd1 ERAD and Crebh protein levels under various physiological setting, but also establish Sel1L‐Hrd1 ERAD as a key repressor of the “Crebh‐Fgf21” axis during growth and fasting‐feeding.
Discussion
The liver controls overall energy metabolism and regulates a wide range of key processes in the body, including growth and fasting‐feeding cycle (Lajtha et al, 1976). The hepatokine Fgf21 is a key metabolic endocrine hormone involved in inter‐organ crosstalk and is considered as a potent therapeutic agent for the treatment of obesity and obesity‐associated diabetes (Fisher & Maratos‐Flier, 2016). This study reports Sel1L‐Hrd1 ERAD as a key physiological repressor of Fgf21 gene transcription in the nucleus under various metabolic states in the body. Indeed, our data reveal a common mechanism by which diverse physiological contexts such as fasting‐feeding and growth integrate at the level of Sel1L‐Hrd1 ERAD via the control of Crebh protein abundance on the ER membrane to regulate Fgf21 gene transcription (Fig 8). This metabolic tuning of Fgf21 levels by Sel1L‐Hrd1 ERAD plays a key role in setting the normal growth and physiological paradigm in the body, as evident from the strong metabolic phenotypes of Sel1L Alb mice.
Figure 8. Model: Hepatic Sel1L‐Hrd1 ERAD regulates systemic metabolism via modulation of the “Crebh‐Fgf21” axis in physiological contexts.
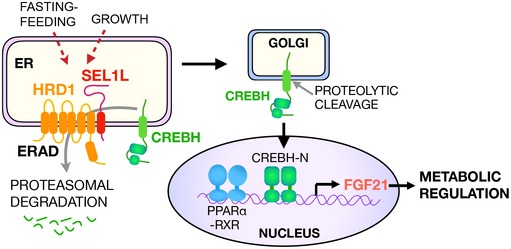
Model depicting how physiological signals such as growth and fasting‐feeding are integrated at the ER membrane via the Sel1L‐Hrd1 ERAD complex in liver to regulate CREBH protein turnover at the ER membrane, and Fgf21 transcription and metabolic states in the body. New findings elucidated by this study are highlighted in red arrows.
Our study reveals that growth and feeding can both increase the expression of the Sel1L‐Hrd1 ERAD protein complex in the ER, which in turn negatively regulates the protein level of Crebh and Fgf21 gene transcription. ER‐resident Crebh protein is unstable, and its abundance is tightly controlled by the Sel1L‐Hrd1 protein complex. Indeed, Crebh or Fgf21 deletion in Sel1L‐deficient mice significantly reverses or attenuates some growth and metabolic phenotypes of the hepatic Sel1L‐deficient mice, suggesting that hepatic Sel1L‐Hrd1 ERAD effect is at least partially mediated through the “Crebh‐Fgf21” axis. The impact of Sel1L‐Hrd1 ERAD deficiency on Crebh and Fgf21 induction is profound, as demonstrated by the dramatic elevation of serum Fgf21 levels (~ 10 ng/ml), nearly reaching those in models of transgenic Fgf21‐overexpression or pharmacological administration (~ 10–25 ng/ml). Therefore, systemic energy homeostasis and Fgf21 expression, both in the liver and circulation, is tightly linked to the activity of hepatic Sel1L‐Hrd1 ERAD, the expression of which, in turn, may be responsive to the metabolic state of the body. For example, specific hormones and metabolites (such as insulin, glucagon, leptin, corticosterone, glucose, fatty acids) associated with fasting‐feeding and/or growth may be involved in the transcriptional regulation of Sel1L and/or Hrd1. In this regard, further investigation will be needed to dissect the molecular pathways that link physiological cues to hepatic ERAD gene expression.
An outstanding question remains as to which transcription factor—Crebh or Pparα—is the more pertinent regulator of Fgf21 expression in the liver in response to physiological cues. A recent study showed that Crebh is required for transcriptional activation of Fgf21 by Pparα by forming the Crebh‐Pparα complex and also by regulating the expression of Pparα (Kim et al, 2014). Our study demonstrates a profound effect of Sel1L‐Hrd1 ERAD on Fgf21 gene transcription via Crebh, but not Pparα, during growth and fasting‐feeding. Although our study does not exclude the importance of Pparα in Fgf21 transcription, it reveals another layer of regulation of Fgf21 expression during fasting‐feeding and growth, centered at the level of ER membrane.
ERAD is often considered to be responsible for clearing “misfolded” proteins from the ER, and hence, ERAD deficiency is mostly known to cause the accumulation of misfolded proteins and thereby trigger ER stress. Indeed, one recurrent question associated with ERAD‐deficient models is whether the presumptive induction of ER stress in ERAD deficiency is the true cause of observed phenotypes. Our data show that the effect of ER stress on Crebh and Fgf21 expression pales when compared to that of Sel1L‐Hrd1 ERAD deficiency in the liver or hepatocytes. Moreover, our data showed that Sel1L deficiency only triggers very moderate ER stress response, likely due to cellular adaptation as shown in other cell types (Kim et al, 2018; Shi et al, 2017). Hence, while modest but tonic ER stress may contribute somewhat to the overall phenotype of the Sel1L‐deficient mice, the marked elevation of Fgf21 is likely a direct result of Crebh stabilization and accumulation in the absence of Sel1L‐Hrd1 ERAD. Indeed, a recent study reported that ER stress is dispensable for Crebh activation in the liver (Xu et al, 2014). Providing further support to our model, none of the previous hepatic UPR mouse models showed metabolic phenotypes similar to our hepatocyte‐specific Sel1L‐Hrd1 ERAD‐deficient system or to the Fgf21 gain‐of‐function mouse models (Hur et al, 2012; Jurczak et al, 2012; Lee et al, 2008; Olivares & Henkel, 2015; So et al, 2012; Zhang et al, 2011). For example, genetic ablation of the UPR sensor Ire1α alters lipid metabolism and ketogenic programs in the liver (So et al, 2012; Zhang et al, 2011). Silencing a major Ire1α effector X‐box Binding Protein‐1 (Xbp1) in the liver leads to marked disequilibrium in lipid homeostasis and impaired recovery from pharmacologically induced ER stress (Olivares & Henkel, 2015). Thus, we believe that mammalian Sel1L‐Hrd1 ERAD in the liver plays an intimate and critical role in growth and fasting‐feeding by directly regulating the activity of the “Crebh‐Fgf21” axis. Additionally, liver‐specific deletion of Autophagy‐related‐7 (Atg7) appears to lead to improved energy metabolism in the body owing to mitochondrial defect‐associated Fgf21 production (Kim et al, 2013a). While we did not find any mitochondrial structural defects in our Sel1L‐deficient livers, further investigation will be done to assess the relative importance and potential crosstalk between these two, distinct cellular quality control pathways in modulating Fgf21 expression under physiological contexts.
Overall, this study delineates a novel role of Sel1L‐Hrd1 ERAD in the liver and, importantly, establishes Sel1L‐Hrd1 ERAD‐mediated Crebh degradation as an important regulatory mechanism underlying Fgf21 transcription regulation. This novel “ERAD‐Crebh‐Fgf21” cascade from the ER to the nucleus (Fig 8) represents another beautiful example of the regulation of cellular, and in this case, systemic response by Sel1L‐Hrd1 ERAD and may provide with multiple components that could be utilized for therapeutic intervention in diseases associated with growth and metabolic defects.
Materials and Methods
Mice
The Sel1L f/f mice (Sun et al, 2014) were crossed with mice expressing Albumin‐promoter‐driven Cre on the C57BL/6J background (JAX 003574, B6.Cg‐Tg(Alb‐Cre)21Mgn/J) to generate hepatocyte‐specific Sel1L‐deficient mice (Sel1L Alb) and its WT littermates Sel1L f/f. Due to the infertility of Sel1L Alb female mice, only male Sel1L Alb mice were used for breeding. Mice were fed a low‐fat diet (13% fat, 57% carbohydrate, and 30% protein, LabDiet 5LOD) or a high‐fat diet (60% fat, 20% carbohydrate, and 20% protein) where indicated. Comprehensive Lab Animal Monitoring System (CLAMS, Columbus Instruments) was used with 1‐day acclimatization period followed by 1‐day measurement for metabolic cage analyses studies. Mice were housed on a regular 12‐h light/dark cycle and regulated temperature (22°C). All animal procedures were done in accordance with the IACUC at Cornell University (2007‐0051) and University of Michigan Medical School (PRO00006888). Mice were routinely fasted in the morning for 5–6 h before sacrifice except as whenever stated (e.g., longer fasting or ad libitum). Mice were fasted for 6 h before ITT and 16 h overnight before GTT experiments. Cervical dislocation was used for euthanasia, and tissues were immediately either fixed or frozen in liquid nitrogen upon collection. Vaginal smears were examined on a daily basis for estrus cycle analysis.
Based on sample size formula of power analysis, 4–6 mice per group is the minimal number of animals to obtain statistical significance. A total of 4–10 mice was routinely used in each study to ensure adequate power. No samples or animals were excluded from analyses. Mice in each group were randomly chosen for experiment, matching in age, genotype, and gender. The investigators were not blinded during experiments and result assessment.
Serum metabolite analysis
Multiplex analysis was carried out with appropriate standards and blanks for serum insulin and glucagon measurement. Serum triglycerides (TG) and cholesterol (CHOL) were measured by IDEXX Laboratories. Blood glucose was measured via the TrueTest Glucometer. Serum levels of Fgf21 were measured by ELISA analyses as per the protocol provided by the mouse Fgf21 ELISA kit (R&D Systems MF2100).
Western blot analysis
Protein extraction from cell and tissue lysates and Western blotting following SDS–PAGE separation (and phos‐tag gel for p‐Ire1α) were performed as previously described (Qi et al, 2011; Sha et al, 2009; Yang et al, 2010). The quantification of signals was done using Bio‐Rad ImageLab software, and protein levels among samples were normalized to Hsp90, β‐actin, or α‐tubulin as loading controls. The commercially available antibodies used are as follows: Flag (1:500 for staining, 1:5,000 for Western blot; Sigma F1804); HA (1:3,000; Sigma H9658); Myc (1:1,000; Sigma); Ucp1 (1:10,000; Sigma U6382); Hsp90 (1:4,000; Santa Cruz sc‐7947); α‐tubulin (1:2,000; Santa Cruz sc‐5286); lamin (1:1,000; Santa Cruz sc‐6215); Xbp1 (1:1,000; Santa Cruz sc‐7160); BiP (1:1,000; Santa Cruz sc‐1051); KDEL (1:500; Abcam ab50601); Sel1L (1:2,000; Abcam ab78298); Os9 (1:5,000; Abcam ab109510); β‐actin (1:10,000, Abcam ab20272); Crebh (1:1,000 for Western, 1:100 for immunostaining; Kerafast EWS101); Fgf21 (1:1,000; R&D AF3057); Pparα (1:500; Millipore MAB3890); Perilipin (1:200; Cell Signaling 9349); phospho‐Stat5 (1:1,000; Cell Signaling 9359); Stat5 (1:1,000; Cell Signaling #94205); Ire1α (1:2,000; Cell Signaling 3294); Perk (1:1,000; Cell Signaling 3192); p‐eIf2α (1:1,000; Cell Signaling 9721); eIF2α (1:2,000; Cell Signaling 9722); caspase‐3 (1:1,000; Cell Signaling 9665); cleaved‐caspase‐3 (1:1,000; Cell Signaling 9661). Hrd1 antibody (1:300) was kindly provided by Dr. Richard Wojcikiewicz (SUNY Upstate Medical University); H2a antibody (1:5,000) was kindly provided by Dr. Yihong Ye (NIDDK). Secondary antibodies for Western blot were goat anti‐rabbit IgG‐HRP and goat anti‐mouse IgG‐HRP (1:5,000; Bio‐Rad), and donkey anti‐goat IgG‐HRP (1:5,000; Jackson ImmunoResearch). Secondary antibodies for immunostaining were anti‐mouse IgG Cy3 and FITC; anti‐rabbit IgG Alexa Fluor 488, Alexa Fluor 594, Alexa Fluor 647; and anti‐goat IgG Alexa Fluor 594, Alexa Fluor 680 (all 1:500; Jackson ImmunoResearch).
Immunoprecipitation
Cells/tissue were lysed in a buffer containing 150 mM NaCl, 50 mM Tris–HCl pH 7.5, 1 mM EDTA, 1% NP‐40, protease inhibitors and phosphatase inhibitors, and 10 mM N‐ethylmaleimide. A total of 2–6 mg protein lysates was incubated with antibody‐coated agarose beads overnight with gentle rocking at 4°C. Immuno‐complexes were washed in a buffer containing 137 mM NaCl, 20 mM Tris–HCl pH 7.5, 2 mM EDTA, and 10% glycerol and eluted by boiling at 95°C for 5 min in SDS sample buffer. For “denaturing” immunoprecipitation conditions in Fig 5D, lysis was first carried out in 200 μl of above stated buffer with 5 mM DTT and 1% SDS, and denatured for 10 min at 95°C before diluting 1:5 with lysis buffer and continuing with antibody incubation.
Detergent solubility analysis
Frozen liver tissue was weighed and homogenized as previously described in NP‐40 lysis buffer. The lysate volume was then normalized by tissue weight and protein concentration via Bradford assay. The lysate was then centrifuged for 10 min at 12,000 g, and the supernatant collected was the NP‐40‐Soluble fraction after addition of 5× SDS‐containing sample buffer and heating at 65°C for 15 min. The pellet obtained was re‐suspended in 1× SDS sample buffer with a volume normalized to its corresponding soluble fraction and boiled at 95°C for 30 min to form the NP‐40‐Insoluble/Pellet fraction.
Nuclear fractionation
Nuclear fractionation of the liver was performed as previously described (Sha et al, 2009).
RNA extraction, RT, and qPCR
Total RNA was extracted from liver tissues and cells using Trizol and BCP phase separation reagent, and RNA quality was measured via OD. RT–PCR for Xbp1 splicing was performed as previously described (Sha et al, 2009). qPCR analysis was carried out using Taq polymerase, oilgo‐dT primer, SYBR‐Green‐based master mix, and Applied Biosystems qPCR machine. All PCR data were normalized to the ribosomal L32 gene expression level. qPCR primer sequences are as follows: Sel1L F: TGGGTTTTCTCTCTCTCCTCTG, R: CCTTTGTTCCGGTTACTTCTTG; Hrd1 F: AGCTACTTCAGTGAACCCCACT, R: CTCCTCTACAATGCCCACTGAC; Os9 F: GCTGGCTGACTGATGAGGAT, R: CGGTAGTTGCTCTCCAGCTC; Ire1α F: CTGTGGTCAAGATGGACTGG, R: GAAGCGGGAAGTGAAGTAGC; BiP F: TGTGGTACCCACCAAGAAGTC, R: TTCAGCTGTCACTCGGAGAAT; Chop F: TATCTCATCCCCAGGAAACG, R: GGGCACTGACCACTCTGTTT; Fgf21 F: CTGGGGGTCTACCAAGCATA, R: CACCCAGGATTTGAATGACC; Ghr F: AGCCTCGATTCACAAGTGTCG, R: GATGACCAATTCTTGCAGCTTG; Igf1 F: GCTCTTCAGTTCGTGTGTGGAC, R: TTGGGCTGTCAGTGTGGCGC; Als F: AACCTCAGGAATAACTCCTTGC, R: CACCGGCTGGCAGTCATCTCCC; Oatp1 F: CCTCAGCTGTACAATGATTGCC, R: TTTTGGTTCAATGCAGGGTTG; Ntcp F: GAAGTCCAAAAGGCCACACTATGT, R: ACAGCCACAGAGAGGGAGAAAG; Abcg5 F: TCAATGAGTTTTACGGCCTGAA, R: GCACATCGGGTGATTTAGCA; Abcg8 F: TGCCCACCTTCCACATGTC, R: ATGAAGCCGGCAGTAAGGTAGA; Ldlr F: AGGCTGTGGGCTCCATAGG, R: TGCGGTCCAGGGTCATCT; Hmgcr F: CTTGTGGAATGCCTTGTGATTG, R: AGCCGAAGCAGCACATGAT; Srebp1c F: GGAGCCATGGATTGCACATT, R: CCTGTCTCACCCCCAGCATA; Abca1 F: GCTTGTTGGCCTCAGTTAAGG, R: GTAGCTCAGGCGTACAGAGAT; Crebh F: CAGCTCAAGAAAGCAGGAAG, R: AGCTGCTCCAGAAGAGACAA; Ppara F: GCGTACGGCAATGGCTTTAT, R: GAACGGCTTCCTCAGGTTCTT; Ucp1 F: CCAGTGGATGTGGTAAAAACAA, R: TCAAAGCACACAAACATGATGA; Dio2 F: CAGTGTGGTGCACGTCTCCAATC, R: TGAACCAAAGTTGACCACCAG; Cidea F: TGCTCTTCTGTATCGCCCAGT, R: GCCGTGTTAAGGAATCTGCTG; Apcs F: ACAGTCCGTGGTATGGAAGA, R: TGGGGCTTTCACAGTGTATT; Apoa4 F: CCAGCTAAGCAACAATGCCA, R: TGGAAGAGGGTACTGAGCTGC; Cidec F: ATGGACTACGCCATGAAGTCT, R: CGGTGCTAACACGACAGGG; Acc1 F: ATGGGCGGAATGGTCTCTTTC, R: TGGGGACCTTGTCTTCATCAT; Acc2 F: CACCATCCGTGAAAACATCA, R: AGCAGCTGAGCCACCTGTAT; Xbp1 F: ACACGCTTGGGAATGGACAC, R: CCATGGGAAGATGTTCTGGG; Acsl1: F: AACGATGTACGATGGCTTCC, R: CATATGGCTGGTTTGGCTTT; Acox1: F: GATGTGACCCTTGGCTCTGT, R: AGAGATTCGGCCTCTCTGTG; Cpt1a F: ATGACGGCTATGGTGTTTCC, R: GGCTTGTCTCAAGTGCTTCC; Mttp: F: TACCCGTTCTTGGTCTGCAT, R: TCTGGCTGAGGTGGGAATAC.
Primary hepatocyte culture
Mice (6–8 weeks of age) were euthanized with isoflurane inhalation, and the liver was perfused first with warm calcium/magnesium‐free HBSS containing 25 mM HEPES, EDTA, 1% penicillin‐streptomycin, and then with warm calcium/magnesium‐free HBSS containing 25 mM HEPES, 2 mM CaCl2, 1% penicillin‐streptomycin, and 0.75 mg/ml collagenase (Sigma‐Aldrich C8051). After removal and mechanical dispersion of the swollen, digested liver, cells were suspended in ice‐cold plating medium (DMEM with 2% sodium pyruvate, 2% penicillin‐streptomycin, 10% heat‐inactivated FBS, 1 μM dexamethasone, and 0.1 μM insulin) and passed through a 70‐μm cell strainer. The cells were then pelleted by centrifugation for 3 min at 60 × g at 11°C and re‐suspended buffered Percoll before pelleting by centrifugation for 4 min at 800 × g at 11°C. The final cells were washed thrice in plating medium (centrifugation for 3 min at 60 × g at 11°C), viability‐checked (via trypan blue exclusion as > 80%), and plated on 6‐well plates. Once the cells attached well (2–4 h after plating), the plating medium was replaced with culture medium (DMEM containing 2% sodium pyruvate, 2% penicillin‐streptomycin, 0.2% BSA, 0.1 μM dexamethasone, and 1 nM insulin). Before treatment with nutrients/hormones, the cells were kept in starvation media (no serum/growth factors/hormones) for 4 h.
Chromatin immunoprecipitation
Chromatin IP from liver tissue was carried out as per the protocol previously described (Murgatroyd et al, 2012) using 1:250–500 dilution of the Crebh antibody, regular Protein A agarose beads (Invitrogen) instead of magnetic beads, and phenol–chloroform‐based DNA extraction in place of columns. The final precipitated DNA was amplified via qPCR using following primers: Fgf21 promoter (positions −8 to −125 relative to transcribed region) F: ATCCCCAGCTGAGAAGACAC, R: GCCCTTTTCATTCAGACCCC; end of Fgf21 coding sequence (positions +1,214 to +1,439 relative to transcribed region) F: AAGGCTCTACCATGCTCAGG, R: CGTCTGCCTCAGAAGGACTC.
Immunostaining and histology
For H&E staining, tissues upon dissection were directly placed in 10% neutral‐buffered formalin, stored at 4°C, and processed by the Michigan Histology Core for paraffin embedding, section cutting and H&E staining on a fee‐for‐service basis. For other in vivo staining, livers on anesthetized mice were perfused first with PBS and then with 4% paraformaldehyde for fixation. After further overnight fixation, the tissues were dehydrated overnight in 15% sucrose solution and then frozen in Tissue‐Tek O.C.T. Compound. 5‐μm sections were cut using a cryotome for further staining. During immunocytochemistry, cells were cultured on poly‐l‐lysine‐coated coverslips and were fixed in 4% formalin for 10 min. For paraffin‐embedded sections, boiling in 1 mM EDTA for 25 min was done for antigen retrieval. For cryosections and cells, permeabilization was carried out in 0.3% Triton X‐100 and 0.3% glycine for 10 min at room temperature. Thereafter, the sections/cells were incubated in blocking solution (1% donkey serum, 0.03% Triton X‐100 in PBS) for 40–60 min at room temperature, and then incubated with primary antibodies for 24–72 h, as needed at 4°C in humidified chambers. Thereafter, they were washed thrice with PBST (0.03% Triton X‐100 in PBS) and incubated with secondary antibodies for 2 h at room temperature. Counterstaining and mounting were performed using hard‐set mounting medium containing DAPI (Vector H‐1200). Fluorescent samples were imaged with Nikon A1 Confocal Microscope at the University of Michigan Imaging Core using identical imaging parameters within each experiment. H&E‐stained samples were scanned using Aperio Scanscope (Leica Biosystems). Images were processed using ImageJ plugin (FIJI).
TUNEL assay
Paraffin‐embedded liver sections were subjected to TUNEL assay as per manufacturer's protocol using the In‐Situ Cell Death detection kit (Roche, 11684795910). Images were obtained by Zeiss LSM710 Confocal Microscope at the Cornell University Biotechnology Resource Center Imaging Facility.
Transmission electron microscopy
The livers of anesthetized mice were perfused via the hepatic portal vein first with Sorenson's buffer to wash out the blood and then with 2.5% glutaraldehyde and 4% paraformaldehyde in 0.1 M Na‐cacodylate buffer as fixative. The liver was then cut into tiny pieces (about 1–2 mm cubes) and soaked overnight in the same fixative. Thereafter, the samples were submitted to the University of Michigan Histology and Imaging Core for washing, embedding, sectioning, and imaging via transmission electron microscopy (TEM).
Cell lines and transfection
Cells lines were cultured in DMEM (Corning, NY) containing 1% penicillin/streptomycin, 1% sodium pyruvate, and heat‐inactivated 10% FBS (GIBCO). Cells were transfected within 16–22 h after plating with Lipofectamine 2000 and harvested around 24 h after. Human hepatoma Hep3B cells were used to generate CRISPR knockouts of SEL1L via lentiviral packaging system with guide sequences ACTGCAGGCAGAGTAGTTGC and GACATCAGATGAGTCAGTAA. HRD1 −/− HEK293T cells were previously described (Shi et al, 2017), and Sel1L −/− and Hrd1 −/− N2a cells were previously described (Kim et al, 2018). An attempt to overexpress Sel1L in cells resulted in complications in cell survival, an issue currently under further investigation.
Plasmids
All Crebh plasmid constructs (Crebh, Crebh‐N) were generated as described (Zhang et al, 2006). The pAAV8‐D(+)‐U6‐siRNA‐CMV‐GFP vector was purchased from Addgene. Myc‐tagged WT and mutant (C2A) Hrd1 constructs were kindly provided by Dr. Yihong Ye (NIDDK). pcDNA3‐HA‐Ub was a kind gift from Dr. Hideki Nishitoh (University of Miyazaki, Japan). Sequences used for mutagenesis to generate cleavage‐defective Crebh (mutating to Alanines the RNNNRNL of the S1P cleavage site to ANNNANA and the LP of the S2P cleavage site to AA) are as follows, with the new Alanines underlined: CCTCATCATCGCCGCCTCCATCAGCCCTTTTGGCCCCAACAAAACCGAGAGCCCTGGGGACTTTGCGCCTGTAGCAGTGTTCTCCGCAACTGCGCACAACGATG.
AAV‐mediated gene delivery
siRNA sequences against mouse Fgf21 (GGGATTCAACACAGGAGAAAC) encoding siRNA, Crebh (TCGAGAAAAAAGACATAGCGGCTGGAAAGATCTCTTGAATCTTTCCAGCCGCTATGTCA) encoding the hairpin shRNA, and control luciferase (GTTGCGCGGAGGAGTTGTG) were cloned into pAAV8‐D(+)‐U6‐siRNA‐CMV‐GFP vector via BamHI and EcoRI restriction sites. AAV was generated from these plasmids at the Harvard Children's Hospital Virus Core (Boston, MA) on a fee‐for‐service basis. AAV8 was injected once into 5‐ to 8‐week‐old mice via the tail vein at the dose of 5–10 × 1011 viral genome copies/mouse. Blood was collected via a small nick in the tail for subsequent ELISA analysis of circulating Fgf21 levels after 2 or more weeks’ postinjection.
Microarray analysis
Liver tissues were snap‐frozen in liquid nitrogen. RNA was extracted as described above followed by DNaseI (New England Biolabs) digestion. RNA quality and concentration were measured using an Agilent 2100 bioanalyzer. Microarray analysis was carried out as previously described (Sun et al, 2012) and is deposited as GSE118658.
Statistical analysis
All results have been expressed as mean ± SEM unless otherwise stated. Comparisons between groups are done by paired two‐tailed Student's t‐test or two‐way ANOVA as needed. All experiments have been repeated at least twice or thrice and performed with multiple independent biological samples from which representative data have been shown.
Author contributions
AB designed and performed most experiments; SS designed and performed experiments with human hepatocytes; HW and ML provided technical assistant; QL provided reagents; SK performed microarray analyses; LY and KZ provided reagents and discussion; AB and LQ wrote the manuscript; everybody commented on and approved the manuscript.
Conflict of interest
The authors declare that they have no conflict of interest.
Supporting information
Appendix
Expanded View Figures PDF
Review Process File
Acknowledgements
We thank Drs. Richard Wojcikiewicz and Yihong Ye for reagents, and Drs. Gerald Duhammel, Jiandie Lin, Peter Arvan, Robert Weiss, Kenneth Simpson, and Natasza Kurpios for insightful discussions and comments; the Histology and Vision Research Core Facilities at University of Michigan Medical School for their assistance and other members of Qi/Arvan laboratories for comments and technical assistance. This work is supported by NIH R01DK099593 (L.Y.), R01DK090313 (K.Z.), R01GM113188, R01DK105393, R01DK120330, R01DK120047, University of Michigan Protein Folding Diseases Initiative, and American Diabetes Association (ADA) 1‐12‐CD‐04 (L.Q.). A.B. is supported by AHA Predoctoral Fellowship grant #16PRE29750001 (2016–2018). S.S. was an International Predoctoral Fellow of the Howard Hughes Medical Institute (2012–2015) and is a Helen Hay Whitney Postdoctoral Fellow (2017–2020). L.Q. is the recipient of the Junior Faculty and Career Development Awards from American Diabetes Association (ADA).
The EMBO Journal (2018) 37: e99277
See also: https://doi.org/10.15252/embj.201898942 (November 2018) and https://doi.org/10.15252/embj.2018100676 (November 2018)
Contributor Information
Qiaoming Long, Email: qmlong@suda.edu.cn.
Ling Qi, Email: lingq@med.umich.edu.
References
- Badman MK, Pissios P, Kennedy AR, Koukos G, Flier JS, Maratos‐Flier E (2007) Hepatic fibroblast growth factor 21 is regulated by PPARalpha and is a key mediator of hepatic lipid metabolism in ketotic states. Cell Metab 5: 426–437 [DOI] [PubMed] [Google Scholar]
- Bailey D, Barreca C, O'Hare P (2007) Trafficking of the bZIP transmembrane transcription factor CREB‐H into alternate pathways of ERAD and stress‐regulated intramembrane proteolysis. Traffic 8: 1796–1814 [DOI] [PubMed] [Google Scholar]
- BonDurant LD, Ameka M, Naber MC, Markan KR, Idiga SO, Acevedo MR, Walsh SA, Ornitz DM, Potthoff MJ (2017) FGF21 regulates metabolism through adipose‐dependent and ‐independent mechanisms. Cell Metab 25: 935–944.e4 [DOI] [PMC free article] [PubMed] [Google Scholar]
- Bookout AL, de Groot MH, Owen BM, Lee S, Gautron L, Lawrence HL, Ding X, Elmquist JK, Takahashi JS, Mangelsdorf DJ, Kliewer SA (2013) FGF21 regulates metabolism and circadian behavior by acting on the nervous system. Nat Med 19: 1147–1152 [DOI] [PMC free article] [PubMed] [Google Scholar]
- Chan CP, Mak TY, Chin KT, Ng IO, Jin DY (2010) N‐linked glycosylation is required for optimal proteolytic activation of membrane‐bound transcription factor CREB‐H. J Cell Sci 123: 1438–1448 [DOI] [PubMed] [Google Scholar]
- Chau MD, Gao J, Yang Q, Wu Z, Gromada J (2010) Fibroblast growth factor 21 regulates energy metabolism by activating the AMPK‐SIRT1‐PGC‐1alpha pathway. Proc Natl Acad Sci USA 107: 12553–12558 [DOI] [PMC free article] [PubMed] [Google Scholar]
- De Sousa‐Coelho AL, Marrero PF, Haro D (2012) Activating transcription factor 4‐dependent induction of FGF21 during amino acid deprivation. Biochem J 443: 165–171 [DOI] [PubMed] [Google Scholar]
- De Sousa‐Coelho AL, Relat J, Hondares E, Perez‐Marti A, Ribas F, Villarroya F, Marrero PF, Haro D (2013) FGF21 mediates the lipid metabolism response to amino acid starvation. J Lipid Res 54: 1786–1797 [DOI] [PMC free article] [PubMed] [Google Scholar]
- Fisher FM, Kleiner S, Douris N, Fox EC, Mepani RJ, Verdeguer F, Wu J, Kharitonenkov A, Flier JS, Maratos‐Flier E, Spiegelman BM (2012) FGF21 regulates PGC‐1alpha and browning of white adipose tissues in adaptive thermogenesis. Genes Dev 26: 271–281 [DOI] [PMC free article] [PubMed] [Google Scholar]
- Fisher FM, Maratos‐Flier E (2016) Understanding the physiology of FGF21. Annu Rev Physiol 78: 223–241 [DOI] [PubMed] [Google Scholar]
- Francisco AB, Singh R, Li S, Vani AK, Yang L, Munroe RJ, Diaferia G, Cardano M, Biunno I, Qi L, Schimenti JC, Long Q (2010) Deficiency of suppressor enhancer lin12 1 like (SEL1L) in mice leads to systemic endoplasmic reticulum stress and embryonic lethality. J Biol Chem 285: 13694–13703 [DOI] [PMC free article] [PubMed] [Google Scholar]
- Fujita H, Yagishita N, Aratani S, Saito‐Fujita T, Morota S, Yamano Y, Hansson MJ, Inazu M, Kokuba H, Sudo K, Sato E, Kawahara KI, Nakajima F, Hasegawa D, Higuchi I, Sato T, Araya N, Usui C, Nishioka K, Nakatani Y, et al (2015) The E3 ligase synoviolin controls body weight and mitochondrial biogenesis through negative regulation of PGC‐1beta. EMBO J 34: 1042–1055 [DOI] [PMC free article] [PubMed] [Google Scholar]
- Guerriero CJ, Brodsky JL (2012) The delicate balance between secreted protein folding and endoplasmic reticulum‐associated degradation in human physiology. Physiol Rev 92: 537–576 [DOI] [PMC free article] [PubMed] [Google Scholar]
- Hondares E, Rosell M, Gonzalez FJ, Giralt M, Iglesias R, Villarroya F (2010) Hepatic FGF21 expression is induced at birth via PPARalpha in response to milk intake and contributes to thermogenic activation of neonatal brown fat. Cell Metab 11: 206–212 [DOI] [PMC free article] [PubMed] [Google Scholar]
- Hur KY, So JS, Ruda V, Frank‐Kamenetsky M, Fitzgerald K, Koteliansky V, Iwawaki T, Glimcher LH, Lee AH (2012) IRE1alpha activation protects mice against acetaminophen‐induced hepatotoxicity. J Exp Med 209: 307–318 [DOI] [PMC free article] [PubMed] [Google Scholar]
- Inagaki T, Dutchak P, Zhao G, Ding X, Gautron L, Parameswara V, Li Y, Goetz R, Mohammadi M, Esser V, Elmquist JK, Gerard RD, Burgess SC, Hammer RE, Mangelsdorf DJ, Kliewer SA (2007) Endocrine regulation of the fasting response by PPARalpha‐mediated induction of fibroblast growth factor 21. Cell Metab 5: 415–425 [DOI] [PubMed] [Google Scholar]
- Inagaki T, Lin VY, Goetz R, Mohammadi M, Mangelsdorf DJ, Kliewer SA (2008) Inhibition of growth hormone signaling by the fasting‐induced hormone FGF21. Cell Metab 8: 77–83 [DOI] [PMC free article] [PubMed] [Google Scholar]
- Ji Y, Kim H, Yang L, Sha H, Roman CA, Long Q, Qi L (2016) The Sel1L‐Hrd1 endoplasmic reticulum‐associated degradation complex manages a key checkpoint in B cell development. Cell Rep 16: 2630–2640 [DOI] [PMC free article] [PubMed] [Google Scholar]
- Jiang S, Yan C, Fang QC, Shao ML, Zhang YL, Liu Y, Deng YP, Shan B, Liu JQ, Li HT, Yang L, Zhou J, Dai Z, Liu Y, Jia WP (2014) Fibroblast growth factor 21 is regulated by the IRE1alpha‐XBP1 branch of the unfolded protein response and counteracts endoplasmic reticulum stress‐induced hepatic steatosis. J Biol Chem 289: 29751–29765 [DOI] [PMC free article] [PubMed] [Google Scholar]
- Jurczak MJ, Lee AH, Jornayvaz FR, Lee HY, Birkenfeld AL, Guigni BA, Kahn M, Samuel VT, Glimcher LH, Shulman GI (2012) Dissociation of inositol‐requiring enzyme (IRE1alpha)‐mediated c‐Jun N‐terminal kinase activation from hepatic insulin resistance in conditional X‐box‐binding protein‐1 (XBP1) knock‐out mice. J Biol Chem 287: 2558–2567 [DOI] [PMC free article] [PubMed] [Google Scholar]
- Kharitonenkov A, Shiyanova TL, Koester A, Ford AM, Micanovic R, Galbreath EJ, Sandusky GE, Hammond LJ, Moyers JS, Owens RA, Gromada J, Brozinick JT, Hawkins ED, Wroblewski VJ, Li DS, Mehrbod F, Jaskunas SR, Shanafelt AB (2005) FGF‐21 as a novel metabolic regulator. J Clin Invest 115: 1627–1635 [DOI] [PMC free article] [PubMed] [Google Scholar]
- Kharitonenkov A, Adams AC (2014) Inventing new medicines: the FGF21 story. Mol Metab 3: 221–229 [DOI] [PMC free article] [PubMed] [Google Scholar]
- Kim KH, Jeong YT, Oh H, Kim SH, Cho JM, Kim YN, Kim SS, Kim DH, Hur KY, Kim HK, Ko T, Han J, Kim HL, Kim J, Back SH, Komatsu M, Chen H, Chan DC, Konishi M, Itoh N, et al (2013a) Autophagy deficiency leads to protection from obesity and insulin resistance by inducing Fgf21 as a mitokine. Nat Med 19: 83–92 [DOI] [PubMed] [Google Scholar]
- Kim KH, Kim SH, Min YK, Yang HM, Lee JB, Lee MS (2013b) Acute exercise induces FGF21 expression in mice and in healthy humans. PLoS One 8: e63517 [DOI] [PMC free article] [PubMed] [Google Scholar]
- Kim H, Mendez R, Zheng Z, Chang L, Cai J, Zhang R, Zhang K (2014) Liver‐enriched transcription factor CREBH interacts with peroxisome proliferator‐activated receptor alpha to regulate metabolic hormone FGF21. Endocrinology 155: 769–782 [DOI] [PMC free article] [PubMed] [Google Scholar]
- Kim GH, Shi G, Somlo DRM, Haataja L, Soon S, Long Q, Nillni EA, Low MJ, Arvan P, Myers MG, Qi L (2018) Hypothalamic ER‐associated degradation regulates POMC maturation, feeding and age‐associated obesity. J Clin Invest 128: 1125–1140 [DOI] [PMC free article] [PubMed] [Google Scholar]
- Kong S, Yang Y, Xu Y, Wang Y, Zhang Y, Melo‐Cardenas J, Xu X, Gao B, Thorp EB, Zhang DD, Zhang B, Song J, Zhang K, Zhang J, Zhang J, Li H, Fang D (2016) Endoplasmic reticulum‐resident E3 ubiquitin ligase Hrd1 controls B‐cell immunity through degradation of the death receptor CD95/Fas. Proc Natl Acad Sci USA 113: 10394–10399 [DOI] [PMC free article] [PubMed] [Google Scholar]
- Laeger T, Henagan TM, Albarado DC, Redman LM, Bray GA, Noland RC, Munzberg H, Hutson SM, Gettys TW, Schwartz MW, Morrison CD (2014) FGF21 is an endocrine signal of protein restriction. J Clin Invest 124: 3913–3922 [DOI] [PMC free article] [PubMed] [Google Scholar]
- Lajtha A, Latzkovits L, Toth J (1976) Comparison of turnover rates of proteins of the brain, liver and kidney in mouse in vivo following long term labeling. Biochim Biophys Acta 425: 511–520 [DOI] [PubMed] [Google Scholar]
- Lee AH, Scapa EF, Cohen DE, Glimcher LH (2008) Regulation of hepatic lipogenesis by the transcription factor XBP1. Science 320: 1492–1496 [DOI] [PMC free article] [PubMed] [Google Scholar]
- Mehnert M, Sommermeyer F, Berger M, Kumar Lakshmipathy S, Gauss R, Aebi M, Jarosch E, Sommer T (2015) The interplay of Hrd3 and the molecular chaperone system ensures efficient degradation of malfolded secretory proteins. Mol Biol Cell 26: 185–194 [DOI] [PMC free article] [PubMed] [Google Scholar]
- Mueller B, Klemm EJ, Spooner E, Claessen JH, Ploegh HL (2008) SEL1L nucleates a protein complex required for dislocation of misfolded glycoproteins. Proc Natl Acad Sci USA 105: 12325–12330 [DOI] [PMC free article] [PubMed] [Google Scholar]
- Murgatroyd C, Hoffmann A, Spengler D (2012) In vivo ChIP for the analysis of microdissected tissue samples. Methods Mol Biol 809: 135–148 [DOI] [PubMed] [Google Scholar]
- Nakagawa Y, Satoh A, Yabe S, Furusawa M, Tokushige N, Tezuka H, Mikami M, Iwata W, Shingyouchi A, Matsuzaka T, Kiwata S, Fujimoto Y, Shimizu H, Danno H, Yamamoto T, Ishii K, Karasawa T, Takeuchi Y, Iwasaki H, Shimada M, et al (2014) Hepatic CREB3L3 controls whole‐body energy homeostasis and improves obesity and diabetes. Endocrinology 155: 4706–4719 [DOI] [PubMed] [Google Scholar]
- Olivares S, Henkel AS (2015) Hepatic Xbp1 gene deletion promotes endoplasmic reticulum stress‐induced liver injury and apoptosis. J Biol Chem 290: 30142–30151 [DOI] [PMC free article] [PubMed] [Google Scholar]
- Omori Y, Imai J, Watanabe M, Komatsu T, Suzuki Y, Kataoka K, Watanabe S, Tanigami A, Sugano S (2001) CREB‐H: a novel mammalian transcription factor belonging to the CREB/ATF family and functioning via the box‐B element with a liver‐specific expression. Nucleic Acids Res 29: 2154–2162 [DOI] [PMC free article] [PubMed] [Google Scholar]
- Owen BM, Ding X, Morgan DA, Coate KC, Bookout AL, Rahmouni K, Kliewer SA, Mangelsdorf DJ (2014) FGF21 acts centrally to induce sympathetic nerve activity, energy expenditure, and weight loss. Cell Metab 20: 670–677 [DOI] [PMC free article] [PubMed] [Google Scholar]
- Park JG, Xu X, Cho S, Hur KY, Lee MS, Kersten S, Lee AH (2016a) CREBH‐FGF21 axis improves hepatic steatosis by suppressing adipose tissue lipolysis. Sci Rep 6: 27938 [DOI] [PMC free article] [PubMed] [Google Scholar]
- Park JG, Xu X, Cho S, Lee AH (2016b) Loss of transcription factor CREBH accelerates diet‐induced atherosclerosis in Ldlr−/− mice. Arterioscler Thromb Vasc Biol 36: 1772–1781 [DOI] [PMC free article] [PubMed] [Google Scholar]
- Potthoff MJ, Kliewer SA, Mangelsdorf DJ (2012) Endocrine fibroblast growth factors 15/19 and 21: from feast to famine. Genes Dev 26: 312–324 [DOI] [PMC free article] [PubMed] [Google Scholar]
- Qi L, Yang L, Chen H (2011) Detecting and quantitating physiological endoplasmic reticulum stress. Meth Enzymol 490: 137–146 [DOI] [PMC free article] [PubMed] [Google Scholar]
- Qi L, Tsai B, Arvan P (2017) New insights into the physiological role of endoplasmic reticulum‐associated degradation. Trends Cell Biol 27: 430–440 [DOI] [PMC free article] [PubMed] [Google Scholar]
- Schaap FG, Kremer AE, Lamers WH, Jansen PL, Gaemers IC (2013) Fibroblast growth factor 21 is induced by endoplasmic reticulum stress. Biochimie 95: 692–699 [DOI] [PubMed] [Google Scholar]
- Sha H, He Y, Chen H, Wang C, Zenno A, Shi H, Yang X, Zhang X, Qi L (2009) The IRE1alpha‐XBP1 pathway of the unfolded protein response is required for adipogenesis. Cell Metab 9: 556–564 [DOI] [PMC free article] [PubMed] [Google Scholar]
- Sha H, Sun S, Francisco AB, Ehrhardt N, Xue Z, Liu L, Lawrence P, Mattijssen F, Guber RD, Panhwar MS, Brenna JT, Shi H, Xue B, Kersten S, Bensadoun A, Peterfy M, Long Q, Qi L (2014) The ER‐associated degradation adaptor protein Sel1L regulates LPL secretion and lipid metabolism. Cell Metab 20: 458–470 [DOI] [PMC free article] [PubMed] [Google Scholar]
- Shi G, Somlo D, Kim GH, Prescianotto‐Baschong C, Sun S, Beuret N, Long Q, Rutishauser J, Arvan P, Spiess M, Qi L (2017) ER‐associated degradation is required for vasopressin prohormone processing and systemic water homeostasis. J Clin Invest 127: 3897–3912 [DOI] [PMC free article] [PubMed] [Google Scholar]
- So JS, Hur KY, Tarrio M, Ruda V, Frank‐Kamenetsky M, Fitzgerald K, Koteliansky V, Lichtman AH, Iwawaki T, Glimcher LH, Lee AH (2012) Silencing of lipid metabolism genes through IRE1alpha‐mediated mRNA decay lowers plasma lipids in mice. Cell Metab 16: 487–499 [DOI] [PMC free article] [PubMed] [Google Scholar]
- Sun S, Xia S, Ji Y, Kersten S, Qi L (2012) The ATP‐P2X7 signaling axis is dispensable for obesity‐associated inflammasome activation in adipose tissue. Diabetes 61: 1471–1478 [DOI] [PMC free article] [PubMed] [Google Scholar]
- Sun S, Shi G, Han X, Francisco AB, Ji Y, Mendonca N, Liu X, Locasale JW, Simpson KW, Duhamel GE, Kersten S, Yates JR III, Long Q, Qi L (2014) Sel1L is indispensable for mammalian endoplasmic reticulum‐associated degradation, endoplasmic reticulum homeostasis, and survival. Proc Natl Acad Sci USA 111: E582–E591 [DOI] [PMC free article] [PubMed] [Google Scholar]
- Sun S, Shi G, Sha H, Ji Y, Han X, Shu X, Ma H, Inoue T, Gao B, Kim H, Bu P, Guber RD, Shen X, Lee AH, Iwawaki T, Paton AW, Paton JC, Fang D, Tsai B, Yates Iii JR, et al (2015) IRE1a is an endogenous substrate of endoplasmic‐reticulum‐associated degradation. Nat Cell Biol 17: 1546–1555 [DOI] [PMC free article] [PubMed] [Google Scholar]
- Sun S, Louri R, Cohen SB, Ji Y, Goodrich JK, Poole AC, Ley RE, Denkers EY, Mcguckin MA, Long Q, Duhamel GE, Simpson KW, Qi L (2016) Epithelial Sel1L is required for the maintenance of intestinal homeostasis. Mol Biol Cell 27: 483–490 [DOI] [PMC free article] [PubMed] [Google Scholar]
- Vashistha N, Neal SE, Singh A, Carroll SM, Hampton RY (2016) Direct and essential function for Hrd3 in ER‐associated degradation. Proc Natl Acad Sci USA 113: 5934–5939 [DOI] [PMC free article] [PubMed] [Google Scholar]
- Vecchi C, Montosi G, Zhang K, Lamberti I, Duncan SA, Kaufman RJ, Pietrangelo A (2009) ER stress controls iron metabolism through induction of hepcidin. Science 325: 877–880 [DOI] [PMC free article] [PubMed] [Google Scholar]
- Wan XS, Lu XH, Xiao YC, Lin Y, Zhu H, Ding T, Yang Y, Huang Y, Zhang Y, Liu YL, Xu ZM, Xiao J, Li XK (2014) ATF4‐ and CHOP‐dependent induction of FGF21 through endoplasmic reticulum stress. Biomed Res Int 2014: 807874 [DOI] [PMC free article] [PubMed] [Google Scholar]
- Wu T, Zhao F, Gao B, Tan C, Yagishita N, Nakajima T, Wong PK, Chapman E, Fang D, Zhang DD (2014) Hrd1 suppresses Nrf2‐mediated cellular protection during liver cirrhosis. Genes Dev 28: 708–722 [DOI] [PMC free article] [PubMed] [Google Scholar]
- Xu X, Park JG, So JS, Hur KY, Lee AH (2014) Transcriptional regulation of apolipoprotein A‐IV by the transcription factor CREBH. J Lipid Res 55: 850–859 [DOI] [PMC free article] [PubMed] [Google Scholar]
- Xu Y, Zhao F, Qiu Q, Chen K, Wei J, Kong Q, Gao B, Melo‐Cardenas J, Zhang B, Zhang J, Song J, Zhang DD, Zhang J, Fan Y, Li H, Fang D (2016) The ER membrane‐anchored ubiquitin ligase Hrd1 is a positive regulator of T‐cell immunity. Nat Commun 7: 12073 [DOI] [PMC free article] [PubMed] [Google Scholar]
- Yagishita N, Ohneda K, Amano T, Yamasaki S, Sugiura A, Tsuchimochi K, Shin H, Kawahara K, Ohneda O, Ohta T, Tanaka S, Yamamoto M, Maruyama I, Nishioka K, Fukamizu A, Nakajima T (2005) Essential role of synoviolin in embryogenesis. J Biol Chem 280: 7909–7916 [DOI] [PubMed] [Google Scholar]
- Yang L, Xue Z, He Y, Sun S, Chen H, Qi L (2010) A Phos‐tag‐based method reveals the extent of physiological endoplasmic reticulum stress. PLoS One 5: e11621 [DOI] [PMC free article] [PubMed] [Google Scholar]
- Yang H, Qiu Q, Gao B, Kong S, Lin Z, Fang D (2014) Hrd1‐mediated BLIMP‐1 ubiquitination promotes dendritic cell MHCII expression for CD4 T cell priming during inflammation. J Exp Med 211: 2467–2479 [DOI] [PMC free article] [PubMed] [Google Scholar]
- Zhang K, Shen X, Wu J, Sakaki K, Saunders T, Rutkowski DT, Back SH, Kaufman RJ (2006) Endoplasmic reticulum stress activates cleavage of CREBH to induce a systemic inflammatory response. Cell 124: 587–599 [DOI] [PubMed] [Google Scholar]
- Zhang K, Wang S, Malhotra J, Hassler JR, Back SH, Wang G, Chang L, Xu W, Miao H, Leonardi R, Chen YE, Jackowski S, Kaufman RJ (2011) The unfolded protein response transducer IRE1alpha prevents ER stress‐induced hepatic steatosis. EMBO J 30: 1357–1375 [DOI] [PMC free article] [PubMed] [Google Scholar]
- Zhang C, Wang G, Zheng Z, Maddipati KR, Zhang X, Dyson G, Williams P, Duncan SA, Kaufman RJ, Zhang K (2012a) Endoplasmic reticulum‐tethered transcription factor cAMP responsive element‐binding protein, hepatocyte specific, regulates hepatic lipogenesis, fatty acid oxidation, and lipolysis upon metabolic stress in mice. Hepatology 55: 1070–1082 [DOI] [PMC free article] [PubMed] [Google Scholar]
- Zhang Y, Xie Y, Berglund ED, Coate KC, He TT, Katafuchi T, Xiao G, Potthoff MJ, Wei W, Wan Y, Yu RT, Evans RM, Kliewer SA, Mangelsdorf DJ (2012b) The starvation hormone, fibroblast growth factor‐21, extends lifespan in mice. Elife 1: e00065 [DOI] [PMC free article] [PubMed] [Google Scholar]
- Zhao Y, Dunbar JD, Kharitonenkov A (2012) FGF21 as a therapeutic reagent. Adv Exp Med Biol 728: 214–228 [DOI] [PubMed] [Google Scholar]
- Zhu S, Ma L, Wu Y, Ye X, Zhang T, Zhang Q, Rasoul LM, Liu Y, Guo M, Zhou B, Ren G, Li D (2014) FGF21 treatment ameliorates alcoholic fatty liver through activation of AMPK‐SIRT1 pathway. Acta Biochim Biophys Sin 46: 1041–1048 [DOI] [PubMed] [Google Scholar]
Associated Data
This section collects any data citations, data availability statements, or supplementary materials included in this article.
Supplementary Materials
Appendix
Expanded View Figures PDF
Review Process File