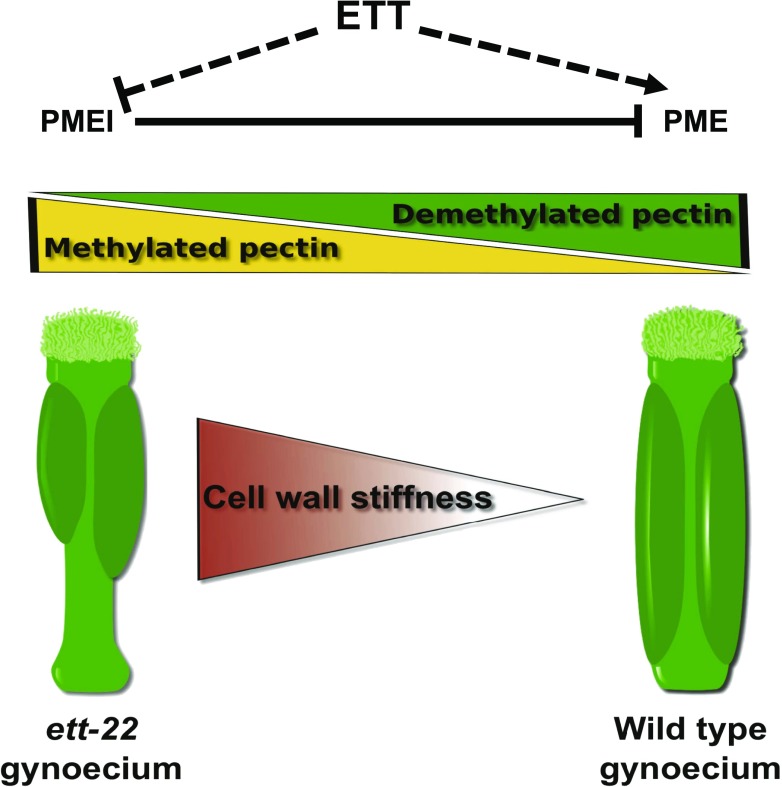
ETTIN, a transcription factor also known as Auxin Response Factor 3, enhances PME activity in the valve tissue, thus maintaining low cell wall stiffness and proper gynoecium morphogenesis.
Abstract
ETTIN (ETT) is an atypical member of the AUXIN RESPONSE FACTOR family of transcription factors that plays a crucial role in tissue patterning in the Arabidopsis (Arabidopsis thaliana) gynoecium. Though recent insights have provided valuable information on ETT’s interactions with other components of auxin signaling, the biophysical mechanisms linking ETT to its ultimate effects on gynoecium morphology were until now unknown. Here, using techniques to assess cell-wall dynamics during gynoecium growth and development, we provide a coherent body of evidence to support a model in which ETT controls the elongation of the valve tissues of the gynoecium through the positive regulation of pectin methylesterase (PME) activity in the cell wall. This increase in PME activity results in an increase in the level of demethylesterified pectins and a consequent reduction in cell wall stiffness, leading to elongation of the valves. Though similar biophysical mechanisms have been shown to act in the stem apical meristem, leading to the expansion of organ primordia, our findings demonstrate that regulation of cell wall stiffness through the covalent modification of pectin also contributes to tissue patterning within a developing plant organ.
The carpel is the ovule-containing female reproductive organ of the angiosperms, or flowering plants. In the model angiosperm Arabidopsis (Arabidopsis thaliana), two carpels are fused together to form a syncarpic gynoecium. This structure is differentiated along its longitudinal axis into four distinct tissues from the apex to the base: a pollen-receiving stigma, a short style, an ovule-containing ovary, and a short stalk or gynophore (Roeder and Yanofsky, 2006). The mature ovary is composed of two valves, which will finally detach to release the seeds, and a replum, which divides the ovary into two chambers and gives rise to the placentae, from which the ovules will develop.
In ettin/auxin response factor3 (ett/arf3) loss-of-function mutants, the structure of the gynoecium is severely altered, leading to a reduction in ovary length and an increase in the length of the gynophore, stigma, and style. In addition, the gynoecium of ett mutants shows a defect in abaxial-adaxial polarity, while in ett arf4 double mutants, this effect is extended to leaves and other above-ground lateral organs (Pekker et al., 2005). ETT is expressed in most lateral organ primordia, and its transcripts are excluded from adaxial (towards the growing axis) tissues in the resulting organs by a cascade of small RNA regulation involving miR390 and tasi-microRNAs produced from TAS3 transcripts (Garcia et al., 2006; Hunter et al., 2006).
Auxin is believed to act on gene expression via the negative regulation of ARF transcription factors by IAA proteins, which are themselves negatively regulated via direct interactions with auxin-binding F-box proteins. The interaction between ARFs and IAA proteins takes place through a C-terminal PB1 domain present in both classes of molecules (Guilfoyle, 2015). However, ETT is one of two ARFs in the Arabidopsis genome that lacks the PB1 domain. In addition, ETT is thought to act predominantly as a transcriptional repressor. The generally accepted model of transcriptional regulation by auxin was formulated in relation to ARFs that act positively on gene expression, and as such, the role of ARFs that act negatively on gene expression is not clearly explained by this model. Interestingly, recent studies have shown that ETT may sense auxin by an alternative mechanism and that auxin concentration may directly affect ETT’s capacity to form complexes with numerous other classes of transcription factor (Simonini et al., 2016). One of the targets predicted to be regulated in this way is the protein kinase PINOID, which is known to activate auxin efflux carriers; ETT is thus hypothesized both to sense auxin concentration and regulate a pathway through which auxin is exported from the cell. These findings provide valuable insights into ETT’s interactions with other components of auxin signaling, but they do not explain ETT’s ultimate effects on gynoecium morphology, which must be brought about through biophysical processes capable of modifying organ shape.
Several recent studies indicate the importance of cell wall dynamics for plant development (Müller et al., 2013; Xiao et al., 2014; Boron et al., 2015; Draeger et al., 2015). Plant cells are encased in a stiff extracellular polysaccharidic matrix, the cell wall, which glues them together and prevents cell migration or sliding. Cell expansion is controlled by the balance between turgor pressure and the mechanical properties and synthesis of the cell wall. Expansins, known to increase cell wall extensibility in vitro, are sufficient to induce primordium formation (Fleming et al., 1997; Pien et al., 2001). Another important factor in the control of cell wall stiffness is the methylesterification status of the pectic polysaccharides in which the cellulose microfibrils of the cell wall are embedded. Pectins are important structural polysaccharides in cell walls, representing up to one-third of primary wall dry mass. Homogalacturonans are the major components of pectin and are synthesized in a predominantly methylesterified form. These polymers can be subsequently demethylesterified in the cell wall by the action of pectin methylesterases (PMEs), whose activity can be tightly controlled by specific inhibitors (PMEIs). Sixty-six PMEs and 76 PMEI genes have been annotated in the Arabidopsis genome (Giovane et al., 2004; Pelloux et al., 2007), suggesting the presence of diverse sets of roles within both families. The modulation of pectin methylesterification directly regulates the outgrowth of flower primordia from the flanks of the Arabidopsis inflorescence meristem. Increased pectin demethylesterification is associated with developing primordia, while the inhibition of PME activity through the transient overexpression of PMEI3 was found to inhibit primordium formation (Peaucelle et al., 2008). Overexpression of PMEI5 in Arabidopsis causes stems to develop twists and loops, in addition to defective organ separation (Müller et al., 2013). Moreover, PME5 has been shown to contribute to wild-type phyllotaxy by regulating the spacing of lateral organs (Peaucelle et al., 2011b). To conclude, cell wall remodeling has been shown to play a central role during plant development.
Based on the above insights, we conjectured that cell wall remodeling may be involved in the control of gynoecium morphogenesis by ETT. We tested this possibility using a large number of complementary techniques, including Fourier-transform infrared (FTIR) spectroscopy to characterize cell wall composition in the gynoecium, assays of PME activity, overexpression studies of PME/PMEIs, and measurements of cell wall stiffness using atomic force microscopy (AFM). We present here a highly congruent set of data that provides strong support for a model in which ETT acts to increase PME activity in the cell wall, thereby decreasing wall stiffness and leading ultimately to correct morphogenesis of the Arabidopsis gynoecium.
RESULTS
ETT Positively Regulates Pectin Methylesterase Activity in Cell Walls of the Gynoecium
To investigate the effects of ETT on cell wall composition in the ovary, we used FTIR spectroscopy (Wilson et al., 2000; Mouille et al., 2003; Szymanska-Chargot and Zdunek, 2013). We performed FTIR assays on gynoecia of stage 17 flowers, which are relatively flat structures of uniform thickness that could be expected to have integrated modifications from all previous developmental stages into their biochemical composition (Smyth et al., 1990).
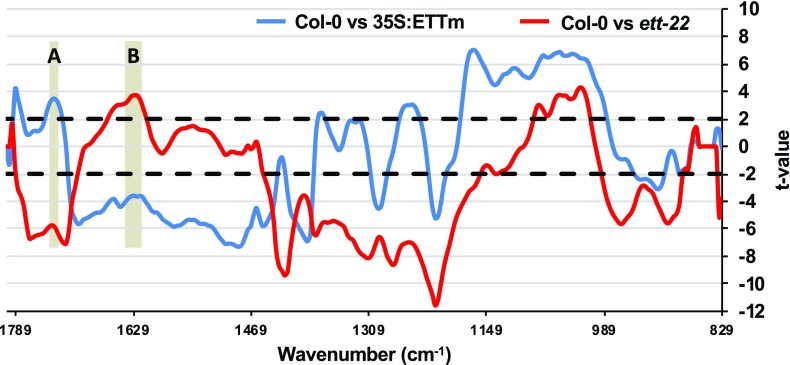
Average FTIR spectra were obtained from multiple measurements along the valves, avoiding vascular tissues, from four individuals each of genotypes Columbia-0 (Col-0), ett-22, and a line overexpressing ETT (35S:ETTm; see Supplemental Fig. S1). Figure 1 shows Student’s t test of FTIR spectra between Col-0 and ett-22 (red) and between Col-0 and 35S:ETTm (blue; the original spectra are shown in Supplemental Fig. S2). Methylesterified pectins absorb in the range of 1,745 to 1,730 cm−1 (gray zone denoted A), whereas demethylesterified pectins absorb in the range of 1,630 to 1,600 cm−1 (gray zone denoted B) (Kacuráková et al., 2000; Szymanska-Chargot and Zdunek, 2013). To determine if the different genotypes exhibit significant differences, we performed Student’s t test by subtracting at each wave number the average values of ett-22 or 35S:ETT from those of Col-0. A positive t value indicates more residues in Col-0 than in ett-22 or 35S:ETT and inversely for a negative t value. As observed in Figure 1, ett-22 has more methylesterified pectins and less demethylesterified pectins compared to Col-0. Inversely, 35S:ETT has less methylesterified pectins and more demethylesterified pectins compared to Col-0. In both comparisons, the increase in one form of pectin corresponds with a decrease in the other form, which is consistent with the same pool of pectins being methylated or not. FTIR analyses from samples treated with NaOH, which saponifies esterified groups, confirmed that we had indeed measured pectin methylesterification levels at these wave numbers (Downie et al., 1998; Supplemental Fig. S3). These results reveal that the level of ETT expression has a measurable effect on the composition of the cell wall and reveal in particular a positive correspondence between ETT and the level of demethylesterified pectins. As expected and as shown by in situ hybridization (Supplemental Fig. S4), ETT is expressed in the gynoecium from the beginning of its development and then in the valves from stage 7 to stage 12.
Figure 1.
ETT negatively corresponds with pectin methylesterification status in valves. FTIR measurements were performed on valves at stage 17. Student’s t test of Fourier-transform infrared (FTIR) spectra (829–1,800 cm−1) were performed between Col-0 and ett-22 (red) and between Col-0 and 35S:ETTm (blue). The gray range noted in A corresponds to the interval 1,745 to 1,730 cm−1 (methylesterified pectin), and the gray range noted in B corresponds to the interval 1,630 to 1,600 cm−1 (demethylesterified pectin). Horizontal dotted lines refer to the P = 0.01 significance threshold.
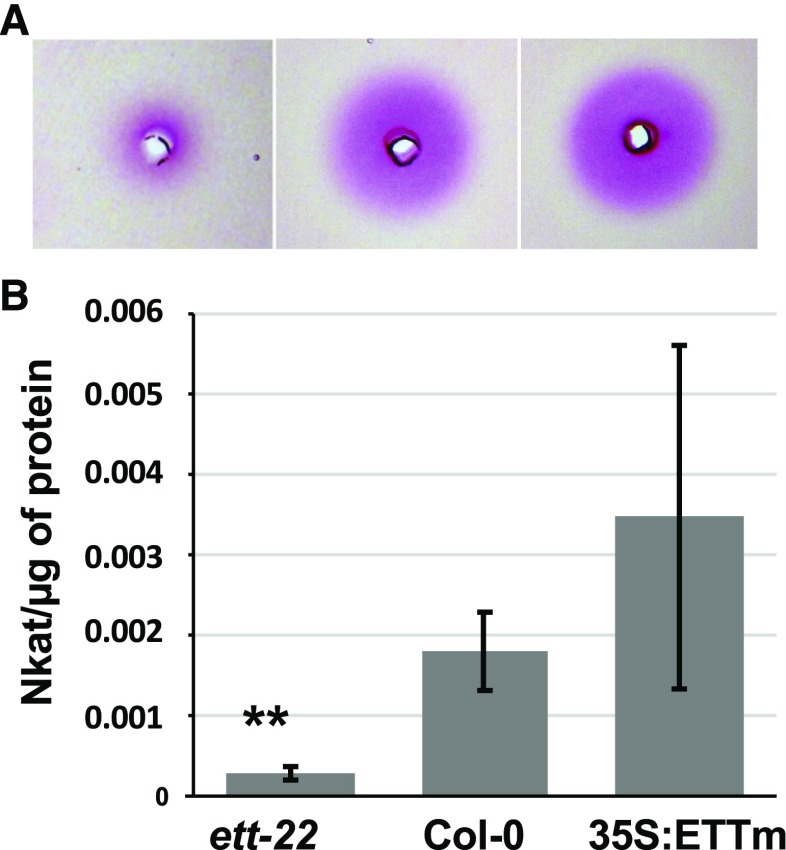
To determine whether the observed differences in FTIR spectra could be due to regulation of PME activity by ETT, we performed radial gel diffusion assays (Downie et al., 1998) on growing gynoecia of wild type, ett-22, and 35S:ETTm lines at stages 9 to 12 of flower development. As shown in Figure 2, PME activity was severely reduced in ett-22 compared to wild-type gynoecia, while average PME activity appeared similar in 35S:ETTm and Col-0 gynoecia. The results of this analysis are consistent with the data obtained from the FTIR analysis (Fig. 1) and confirm that ETT increases net PME activity, corresponding to an increase in the level of demethylesterified pectin in the gynoecium cell wall.
Figure 2.
ETT promotes PME activity in developing gynoecia. A, Radial gel diffusion assay showing PME activity (fuchsia halo) among proteins extracted from 40 dissected gynoecia from stage 9 to stage 12 of flower development for ett-22, Col-0, and 35S:ETTm. B, Bar diagram showing PME activity measured and calculated per µg of proteins for ett-22 (n = 6), Col-0 (n = 5), and 35S:ETTm (n = 6) from three independent experiments. P values are given by the Mann-Whitney test; *P < 0.05 and **P < 0.005. Error bars represent ses of the mean.
Overexpression of a Pectin Methylesterase Inhibitor Impacts Valve Development, as in ett Loss-of-Function Mutants
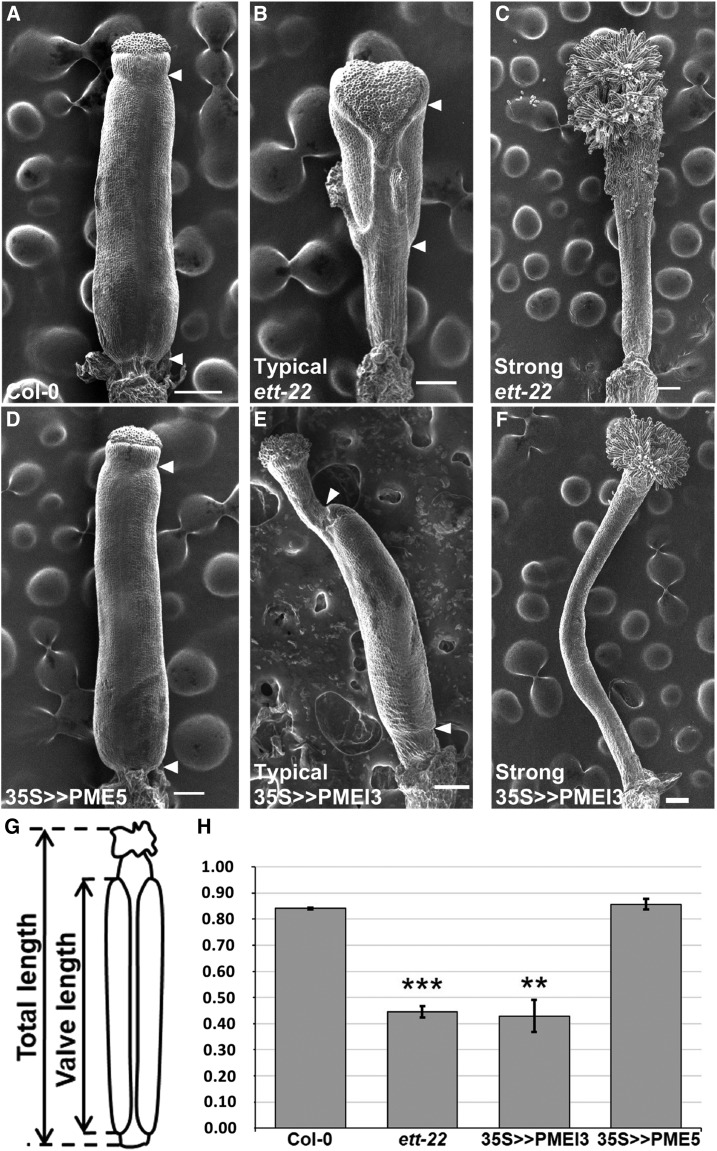
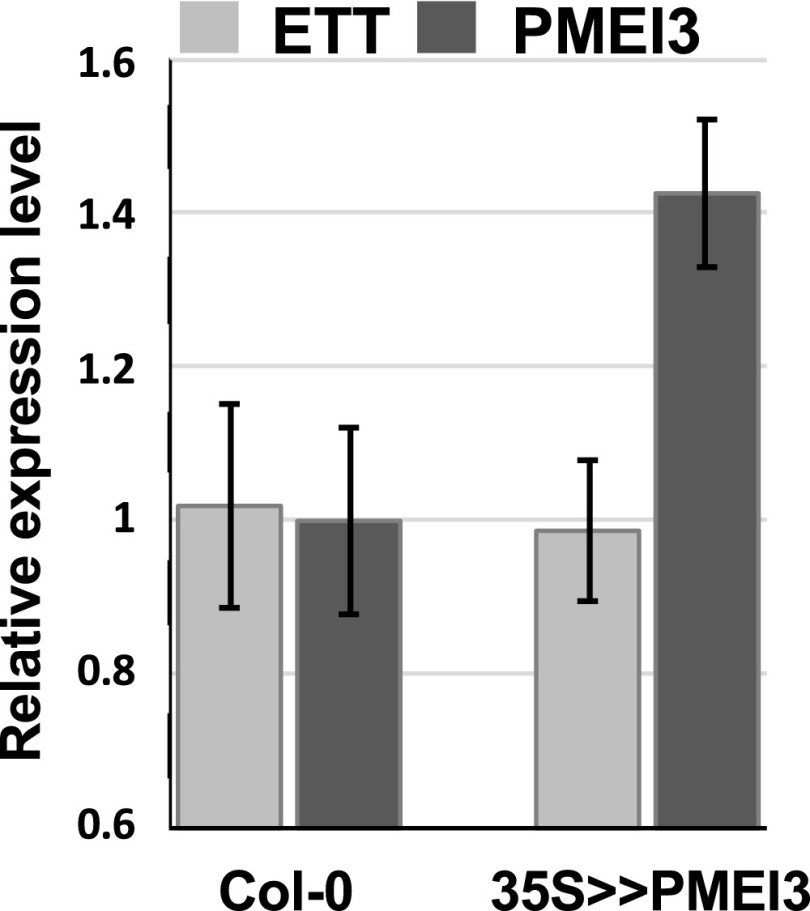
Having shown that ETT regulates the level of demethylesterified pectin in the gynoecium, we turned our attention to the possible effects of this parameter on gynoecium morphogenesis by overexpressing genes that are known to affect the development of inflorescence meristems through the control of pectin demethylesterification (Peaucelle et al., 2008). The valve/gynoecium length-ratio is a direct indicator of the strength of the ett mutant phenotype and we used it to quantify how far, the phenotype of a particular gynoecium is from the wild type. The valves become morphologically visible only late in development (stage 11-12 according to Smyth et al., 1990) resulting from processes that occured earlier, we therefore analysed gynoecia at stage 12. We first examined gynoecium morphology in a transgenic line carrying an ethanol-inducible version of PMEI3, under control of the Cauliflower mosaic virus 35S promoter (35S > >PMEI3). Ethanol induction of this line prevents the development of all primordia at the inflorescence meristem, and consequently, no flowers are produced (Peaucelle et al., 2008). However, we found in this line a gynoecium phenotype in the absence of exogenous ethanol, which could be explained by leakiness of the 35S > >PMEI3 construct. This uninduced line showed a marked reduction in the valve/gynoecium length ratio compared to wild type, similar to the effect observed in ett loss-of-function mutants (Fig. 3). Statistics are shown in Supplemental Table S1 and Supplemental Figure S5. We can observe that in the ett mutant, the reduction of the valve is at the benefit of the gynophore, whereas in the PMEI3 over-expressor, it is at the benefit of the style, similar to the effect of NPA treatment (Hawkins and Liu, 2014; Larsson et al., 2014). Consistent with the observed change in gynoecium phenotype, we found PMEI3 expression in inflorescence tissues of the uninduced 35S >> PMEI3 line to be much higher than in Col-0 plants, while ETT was expressed at similar levels in both lines (Fig. 4). These results show that artificially lowering PME activity, through the overexpression of PMEI3, reduces valve development, as observed in ett loss-of-function mutations, providing further evidence that the control of gynoecium morphogenesis by ETT acts through the positive regulation of PME activity.
Figure 3.
PMEI3 overexpression induces a reduction of the valve/gynoecium ratio. A to F, Scanning electron microscopy pictures of gynoecia at stage 12 from Col-0, ett-22, 35S>>PMEI3, and 35S>>PME5; arrows indicate upper and lower valve boundaries. The absence of arrow indicates an absence of valve. Scale bars represent 100 µm. G, Scheme showing how the ratio between valve length and gynoecium length was measured. H, Bar diagram representing the mean ratio between valve length and gynoecium length from Col-0 (n = 30), ett-22 (n = 30), 35S>>PMEI3 (n = 30), and 35S>>PME5 (n = 30). Asterisks represent statistically significant differences according to a Mann-Whitney test; *P < 10-3; **P < 10-6 and ***P < 10-12. Error bars represent ses of the means.
Figure 4.
ETT and PMEI3 relative expression. Expressions of ETT (light gray) and PMEI3 (dark gray) were measured by real time RT-PCR in inflorescence tissues from Col-0 and 35S>>PMEI3. Error bars represent ses of the mean.
We also studied the effect on the gynoecium of overexpressing PME5, which shows an opposite effect to PMEI3 when overexpressed in the inflorescence meristem. However, we found that ethanol induction of a 35S > >PME5 construct in a wild-type genetic background had no effect on gynoecium development (Fig. 3). Taken together, these results suggest that PME activity does not limit valve elongation in the wild-type gynoecium but demonstrate that artificially reducing this activity through the overexpression of PMEI3 causes a marked reduction in valve growth, similar to that seen in ett mutants. Wild-type levels of PME activity, established at least in part through the action of ETT, are therefore necessary for normal gynoecium development.
Overexpression of a Pectin Methylesterase Partially Rescues valve development in ett Loss-of-Function Mutants
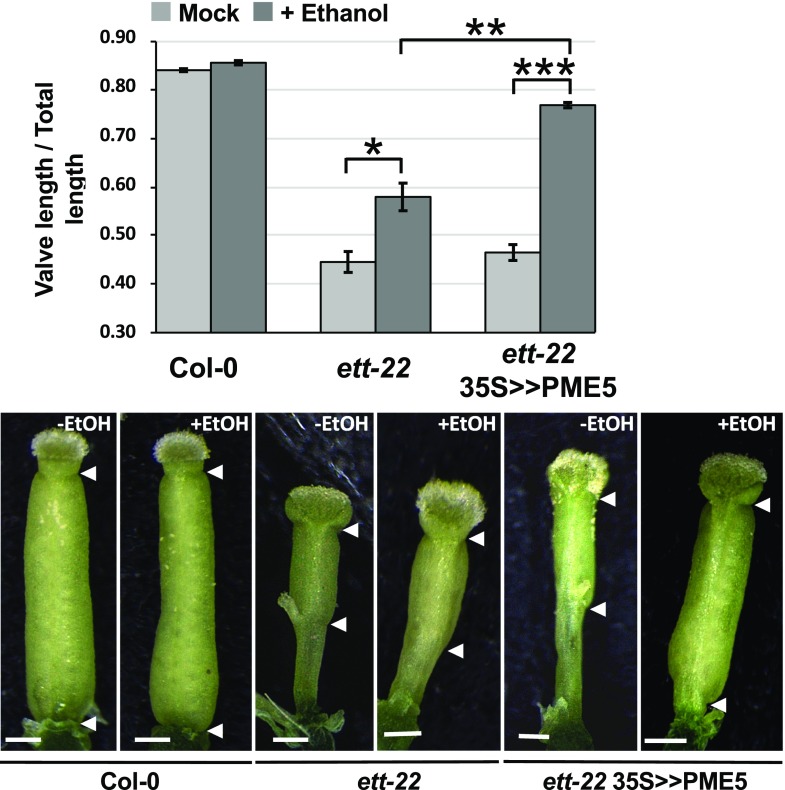
We reasoned that if the overexpression of PMEI3 was able to reduce the valve/gynoecium length ratio, thereby phenocopying ett loss-of-function mutants, the overexpression of PME5, which had no effect in a wild-type genetic background, might rescue ett mutants. We tested this hypothesis by introducing the 35S > >PME5 construct into the ett-22 mutant background. We measured the portion of the gynoecium occupied by valve tissues, as this parameter is independent of the length of the elongating gynoecium. Ethanol-induction of the 35S > >PME5 line restored a wild-type valve/gynoecium length ratio (Fig. 5), resulting in gynoecia of near-normal appearance. We confirmed that PME5 expression was increased by ethanol treatment of these plants, while ETT expression remained unchanged (Supplemental Fig. S6). Ethanol treatment also had a significant effect on the valve/gynoecium ratio in untransformed plants, though this effect was significantly lower than its effect in the 35S > >PME5 line. The results of our statistical analysis are shown in Supplemental Table S1 and Supplemental Figure S7.
Figure 5.
Overexpression of PME5 increases valve/gynoecium ratio in ett-22 mutants. Bar diagram representing the mean ratio between valve length and gynoecium length from Col-0 (n = 30), ett-22 (n = 30), and ett-22 35S>>PME5 (n = 60) before and after ethanol induction. Asterisks represent statistically significant differences according to a Mann-Whitney test; *P < 10-3; **P < 10-6; and ***P < 10-12. Error bars represent ses of the means. Scale bars, 0.25 mm.
To confirm the findings made using the 35S > >PME5 line, we also tested the complementation of the ett-22 mutant by overexpression of PME5 from the gynoecium-specific CRABS CLAW (CRC) promoter (Lee et al., 2005). Two independent transgenic CRC::PME5 lines showed a significant increase in valve/gynoecium length ratio compared to ett mutants (Supplemental Fig. S8), confirming that the reduced valve/gynoecium length ratio observed in ett mutants can be partially restored by overexpressing a PME of known activity. The results of our statistical analysis are shown in Supplemental Table S1 and Supplemental Figure S9.
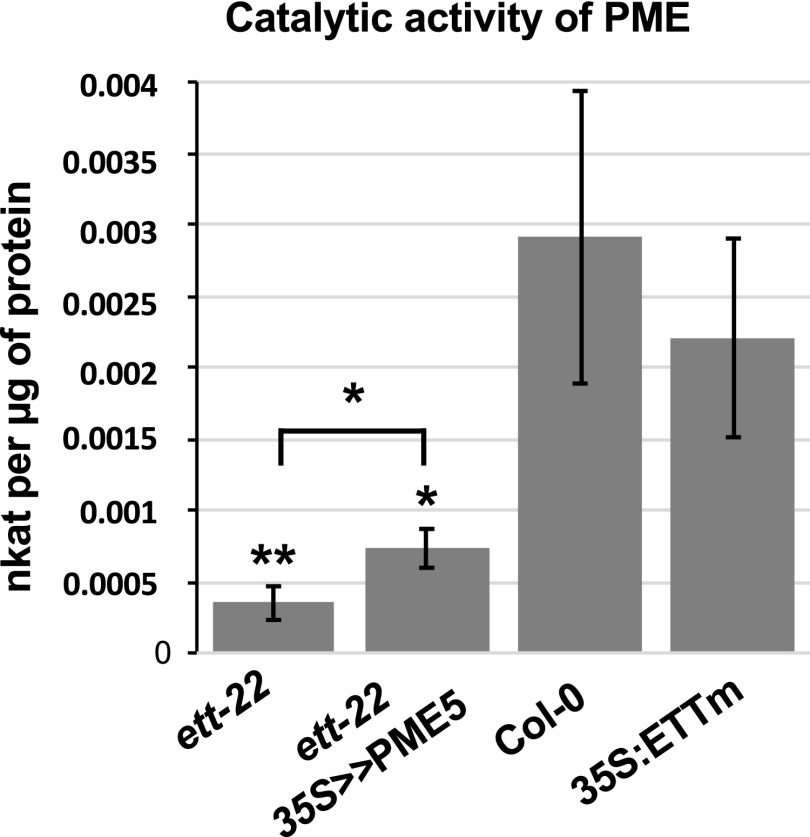
To verify that the restoration of the wild-type gynoecium phenotype produced by expressing PME5 in ett-22 mutants resulted from an increase in PME activity, we quantified this parameter in ett-22 35S > >PME5 gynoecia. We collected developing gynoecia at stage 9 to 12, to include stages during which the patterning of the valve is established. As shown in Figure 6, PME activity in ett-22 35S > >PME5 gynoecia was significantly higher than in ett-22 but lower than in Col-0 gynoecia. This level of increase in PME activity is sufficient to increase the valve/gynoecium length ratio in the ett-22 mutant.
Figure 6.
PME activity increases in gynoecia after ethanol induction of PME5 expression. PME activity was measured and calculated per µg of proteins extracted from 40 dissected gynoecia from stage 9 to stage 12 of flower development for ett-22 (n = 7), ett-22 35S >> PME5 (n = 12), Col-0 (n = 8), and 35S:ETTm (n = 4). P values are given by the Mann-Whitney test; *P < 0.05; **P < 0.005. Error bars represent ses of the mean.
Taken together, the results obtained by overexpressing PMEI3 and PME5 in wild-type and mutant backgrounds (Figs. 3 and 5) corroborate the findings using FTIR and PME assays (Figs. 1 and 2) and demonstrate a mechanistic link between the biochemical effects of ETT on cell wall composition and its morphological effects on gynoecium development.
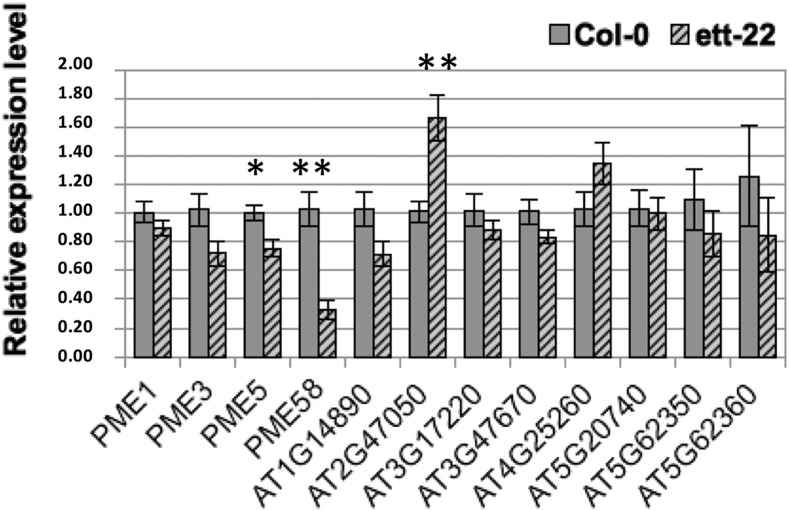
Genes encoding PMEs and their inhibitors, PMEIs, are obvious candidates to mediate the observed effects of ETT on cell wall composition. A recent genome-wide study has shown that ETT can both repress and activate transcription in the inflorescence, depending on its interactors and the concentration of auxin present (Simonini et al., 2017). Interestingly, among their list of putative ETT targets, we found four PMEs and eight PMEIs genes. We therefore compared the level of expression of these genes in gynoecia from wild-type and ett-22 plants. The results of the reverse transcription quantitative PCR (RT-qPCR) are shown in Figure 7. Among the four PME genes, two are significantly less expressed in ett-22 gynoecia compared to Col-0: PME5 and PME58. Interestingly, the PME5 has been used to complement the ett-22 mutant. On the other side, among the eight PMEI genes, only one, the At2g47050, shows a significant up-regulation in the mutant. These results are fully coherent with the idea that the equilibrium of PME/PMEI activity in the ett-22 mutant is unbalanced toward the PMEI side (less PME and more PMEI expression). This leads to a decrease in global PME activity (PME dosage) responsible for an increase in the degree of methylesterification of the pectins (FTIR analysis) and a reduction in valve development.
Figure 7.
Relative expression levels of 12 PME and PMEI genes in Col-0 and ett-22 gynoecia. Expression of four PME and eight PMEI genes were measured by RT-qPCR in gynoecia from five plants of each genotype, Col-0 (gray), and ett-22 (striped). RNAs were extracted from 40 gynoecia from stage 9 to 12 either from Col-0 or from ett-22 mutants. GAPDH was used as a reference gene, and Student’s t test was performed between Col-0 and ett-22 for each gene. Asterisks represent statistically significant differences according to a Student’s t test: *P < 0.05 and **P < 0.005. Error bars represent ses of the mean.
ETT and Increased Levels of Pectin Demethylesterification Reduce Cell Wall Stiffness in the Gynoecium
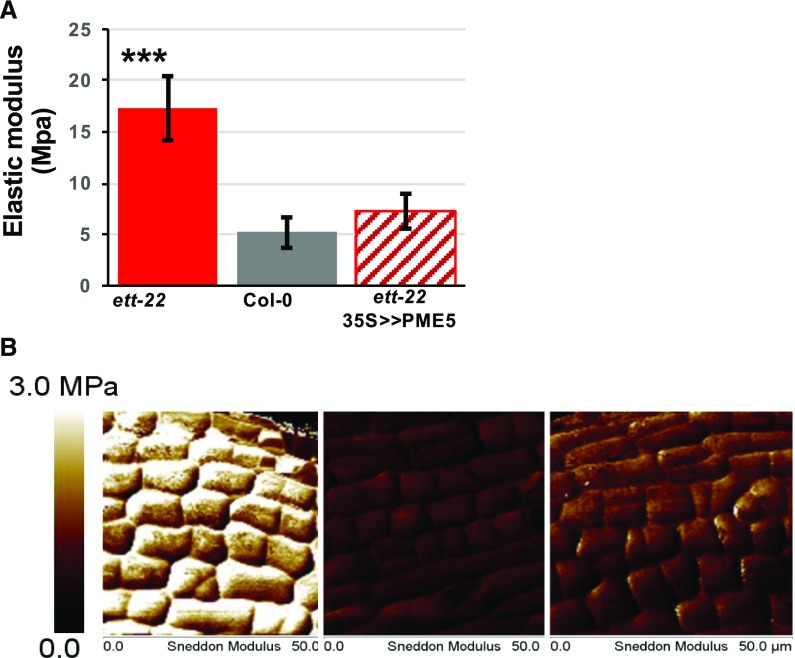
Since the balance of PME/PMEI activity is known to regulate cell wall stiffness, we decided to evaluate the effect of ETT and pectin methylesterification levels on cell wall stiffness in the gynoecium. For this, we used AFM to compare cell wall stiffness in Col-0 and ett-22 gynoecia at stage 9 to 10 of flower development, stages included in the samples used for PME activity dosage and RT-qPCR. As shown in Figure 8, we observed that cell walls were significantly stiffer in the gynoecium of ett-22 when compared to Col-0 plants. This increase in stiffness is consistent with the lower level of PME activity in ett-22 gynoecia (Fig. 2) and with the lower level of demethylesterified pectins found in ett-22 valves (Fig. 1). Gynoecia of ett-22 mutants transiently overexpressing PME5 (in ett-22 35S > >PME5 plants) exhibited a stiffness close to that of Col-0, demonstrating that the effect of the loss of ETT activity on wall stiffness can be largely compensated by the overexpression of an active PME (Fig. 8). The slight increase in PME activity in ett-22 35S > >PME5 gynoecia is sufficient to restore cell wall stiffness and an almost normal valve/gynoecium length ratio. These data show that ETT reduces cell wall stiffness in the developing gynoecium and are consistent with this effect being mediated by PME activity. This conclusion is supported by the fact that ETT is strongly expressed in the valves during all stages of gynoecium development, as shown by in situ hybridization in Supplemental Figure S7.
Figure 8.
Effect of ETT and PME activity on stiffness of developing gynoecia. A, Stiffness was measured using atomic force microscopy (AFM). Measurements were performed on dissected gynoecium at stages 9 to 10 of flower development after ethanol treatment. The diagram represents the mean elastic modulus for each genotype: Col-0 (n = 10), ett-22 (n = 14), and ett-22 35S>>PME5 (n = 8). P values are given by the Mann-Whitney test; *P < 0.05; **P < 0.005; and ***P < 0.0005. Error bars represent ses of the mean. B, Representative 50 × 50 µm stiffness map of ett-22, Col-0, and ett-22 35S>>PME5. Elastic moduli range from 0 MPa (dark) to 3 MPa (white).
Combining all the data presented here, we propose that ETT induces an increase of PME activity in the gynoecium and a consequent rise in the level of demethylesterified cell wall pectins. These biochemical modifications result in a reduction in cell wall stiffness, as measured by atomic force microscopy, which appears necessary for the normal development of valve tissues in the gynoecium.
DISCUSSION
ETT Regulates Valve Length through the Control of Cell Wall Dynamics
Here, we report a coherent body of data showing the effects of ETT on the level of pectin methylesterase activity and cell wall stiffness in the developing Arabidopsis gynoecium, both of which are required for proper valve development. These results strongly support a model, shown in Figure 9, in which ETT controls gynoecium morphogenesis by stimulating PME activity, both by activating PME gene expression and by repressing PMEI gene expression, resulting in a reduced level of methylesterified pectins and consequently lower cell wall stiffness, which is required for valve elongation.
Figure 9.
Model linking ETT, pectin methylesterification, stiffness, and valve/gynoecium length ratio.
In this work, PME5 and PMEI3 were used to artificially manipulate pectin methylesterification and cell wall mechanics in the gynoecium as these proteins had previously been show to play a similar biochemical and biophysical role in the control of primordium emergence (Peaucelle et al., 2011a). These molecules have furthermore been used to follow changes in mechanical anisotropy during dark-grown hypocotyl elongation (Peaucelle et al., 2015), showing that the induced demethylesterification of pectins correlates with reduced stiffness of the wall. PME5 and PMEI3 can thus be regarded as generic representatives of their respective families, which can be used to assess the consequences of the fine-tuning of pectin structure on gynoecium development. However, during the course of this work, PME5 has been shown to be potentially regulated by ETT and indeed, our data show that this gene is downregulated in ett-22 mutant gynoecia compared to Col-0. It is likely that, considering the size of their gene families, not all PMEs or PMEIs will show identical substrate specificities, optimum pHs of demethylesterification, nor optimum pHs of PME-PMEI interactions (Sénéchal et al., 2015). Nonetheless, at least some PMEs and PMEIs have been shown to be partially interchangeable (Lionetti et al., 2007; Wolf et al., 2012), and much of the diversity in PME and PMEI functions may therefore be due to differences in expression patterns, rather than protein activities. These considerations reinforce the use of generic PMEs and PMEIs to test the role of these families in developmental processes, as in the present work.
In our model (Fig. 9), ETT acts to reduce cell wall stiffness by increasing PME activity in the valves. Such a negative correlation between PME activity and cell wall stiffness has already been reported in the inflorescence meristem (Peaucelle et al., 2008, 2011a) and in the hypocotyl (Peaucelle et al., 2015). In addition, Levesque-Tremblay et al. (2015) have shown that loss-of-function of a PME expressed during embryo development caused an increase in seed stiffness, correlating with reduced PME activity and a subsequent increase in the percentage of methylesters of GalUA in the cell wall. The results of the present work are thus entirely coherent with these earlier studies in terms of the direction of the effect of increased PME activity on cell wall stiffness.
A Black Box Downstream of Cell Wall Stiffness Remains to Be Opened
Recently,Qi et al. (2017) revealed a link between auxin, abaxial/adaxial identities, pectin demethylesterification and cell wall elasticity in tomato and Arabidopsis leaf primordia. They show that auxin, which accumulates in the abaxial zone, softens the cell wall by decreasing the level of methylesterification of the pectins, and that a difference of elasticity between the two faces of leaf primordia is necessary for proper leaf development. Our results are coherent with this since ETT is at the same time part of the Auxin Response Factors (Guilfoyle and Hagen, 2007), determinant of abaxial identity (Pekker et al., 2005), is acting on the level of pectin methylesterification and subsequently on cell wall elasticity, and finally determines shape of the gynoecium. Therefore, our results represent a new case where regulation of cell-wall stiffness through the covalent modification of pectin has been show to contribute to tissue patterning within a developing plant organ. An important question remains to be answered concerning the mechanism through which cell wall stiffness is transduced into effects on tissue patterning. A potential answer to this question is suggested by links between cell wall properties and auxin transport (Asnacios and Hamant, 2012). For example, PIN1 becomes depolarized in wall-less protoplasts (Boutté et al., 2006), and its polarity is altered in root cellulose synthase mutants (Feraru et al., 2011) and in meristems through modification of pectin methylesterification level (Braybrook and Peaucelle, 2013), suggesting the regulation of PIN1 polarity via cell-wall-associated mechanisms. In addition, it has been shown that PIN1 localization responds to local stress, and therefore the subcellular localization of PIN1, and consequently the direction of auxin transport, may be regulated as a response to local cell expansion (Heisler et al., 2010). Neighboring cells may measure residual stress to trigger PIN1 polarity, thus linking wall stiffness to auxin content (Heisler et al., 2010). Thus, auxin and cell wall properties seem to be essential and interconnected during development. Braybrook and Peaucelle (2013) proposed a model where, in shoot apex, pectin demethylesterification and auxin accumulation would be linked to each other by a feedback loop, affecting tissue outgrowth. Therefore, a potential mechanism linking ETT’s immediate effects on cell wall stiffness to its ultimate effects on gynoecium patterning may involve the control of auxin flow via the regulation of PIN polarity. Alternatively, since feedbacks between molecular networks and mechanical properties have been shown to exist (for review, Hamant and Moulia, 2016), changes in mechanical properties due to ETT mutation may have an effect on molecular states associated with abaxial/adaxial identities. However, it still remains a possibility that the effect of ETT on PME/PMEI activity is indirect and a consequence of other processes affected by ETT such as auxin dynamics. Until we know more about how directly ETT regulates PME/PMEI genes, this cannot be determined.
MATERIALS AND METHODS
Plant Material and Growth Conditions
All transgenic plants were generated in the Columbia (Col-0) ecotype of Arabidopsis (Arabidopsis thaliana). Plants were grown on soil at 20°C in short-day conditions (8 h light/16 h dark) for 4 weeks before being transferred to long-day conditions (16 h light/8 h darkness). A transgenic line overexpressing PMEI3 (AT5G20740) was a kind gift from A. Peaucelle (Peaucelle et al., 2008). Plants overexpressing the mutated form of ETT, insensitive to tasiR-ARF, were a kind gift from S. Poethig (Hunter et al., 2006).
Construction of Transgenic Lines
For the ethanol-inducible version of PME5 (AT5G47500) under the control of the Cauliflower mosaic virus 35S promoter, the experimental setup described by Das et al. (2009) was used on plants transformed using the 35S:alcR-alcA:PME5 binary vector (see Supplemental Fig. S10). Transformed plants were obtained as described above. The induction was performed for 5 consecutive nights by enclosing the plants in a plastic bag with an opened tube containing 70% (v/v) ethanol. Gynoecia measurements were performed 3 d after the end of treatment on mature flowers. For the CRC promoter, we used the portion of DNA designated as CBA in the paper from Lee et al. (2005) as this fragment fully recapitulates the CRC expression pattern (see Supplemental Fig. S11).
FTIR Spectroscopy
Gynoecia at stage 17 of flower development were collected and stored in ethanol. For the ett mutants, we made sure to select gynoecia with sufficiently developed valve tissue so that we can make the measurements, but at the same time, exhibiting a clear reduction in valve length, a phenotype typical of the ett mutants. These were then rehydrated in water; their valves were removed and dried overnight at 37°C. Spectra were collected using a ThermoNicolet Nexus spectrometer fitted with a Continuum microscope. Three valves from three independent plants were analyzed for each treatment and each genotype. Eight interferograms were collected along each valve, avoiding vascular tissue, in transmission mode with 8 cm−−1 resolution and coadded to improve signal-to-noise ratios. The collected spectra were baseline corrected and normalized using previously described procedures (Mouille et al., 2003).
PME Activity Assay
Proteins were extracted from 40 dissected carpels from stages 9 to 12 per genotype and condition. The protein extraction and the gel diffusion assays have been described (Sénéchal et al., 2015). Diameters of the halos were measured using ImageJ software. Means were calculated from three independent replicates, and the significance of differences was determined using the Mann-Whitney test.
RNA Extraction and RT-qPCR Analyses
Total RNA was extracted from inflorescences using Spectrum Plant Total RNA Kit (Sigma). RNA was then treated with a DNase (Turbo DNA-free from Ambion) to eliminate DNA contamination, and four micrograms were subsequently reverse transcribed using RevertAid Reverse Transcriptase enzyme (Fermentas). Twenty microliters of the reverse transcription reaction were diluted to 1 mL, and 5 μL of this diluted cDNA was subjected to qPCR using SYBR green (Roche) in a StepOne Plus machine (Applied). Efficiency of each primer pair was determined by standard curves using serial cDNA dilutions. PCR was performed using a three-step protocol with a melting curve. Results were normalized to the expression of the GAPDH gene (AT3G26650), which was chosen using BESTKEEPER (Pfaffl et al., 2004) and analyzed by the 2ΔΔCt method. Each expression value was determined from the mean of a minimum of three plants, and each experiment was repeated twice independently. A Student test as realized for each batch of samples with a P value < 0.05. The sequences of the primers used are given in the Supplemental Table S2.
Microscopy
Dissected carpels were observed using a Leica MZ12 stereomicroscope coupled to a DFC320 digital camera and a Hirox SH-3000 scanning electron microscope. Carpels were measured using ImageJ, at least 30 valves were measured for each genotype from flowers at stage 12 collected randomly from at least 5 different plants. These data were analyzed statistically using a Mann-Whitney test.
Histochemistry
RNA in situ hybridization was performed as described (Ferrandiz and Sessions, 2008a, 2008b) with at least three independent experiments for each probe tested.
Atomic Force Microscopy
The experimental setup used has been described (Milani et al., 2014). A Catalyst Bioscope (Bruker Nano) AFM, mounted under an optical macroscope (Z16 APO, Leica), was used for all experiments. In order to measure sample height (topography) and stiffness, we used a fast contact mode, PeakForce QNM (with Nanoscope V controller and Nanoscope software versions 8.1), in which the cantilever oscillates sinusoidally as the sample is scanned. Cantilevers with nominal 2-nm tip-diameter Silicon Nitride pyramidal probes (SCANASYST-AIR, Bruker Nano) were used for all measurements. The deflection sensitivity of cantilevers was calibrated against a clean sapphire wafer. The spring constant of cantilevers was measured using the thermal tune method and ranged from 0.35 to 0.45 N/m. Measurements were made on dissected carpels from stage 9 to 10 of flower development in water. Each carpel was measured at two different locations of size 50 × 50 µm and 128 × 128 pixels were imaged at a rate of 0.3 Hz per line and at a maximum force of 50 nN. The force curves corresponding to each pixel were fitted between 30% and 90% of the maximal force with the Sneddon fit. Means were calculated from measurements of eight to 14 carpels from three to six independent replicates and analyzed statistically using the Mann-Whitney test.
Supplemental Data
The following supplemental materials are available.
Supplemental Figure S1. ETT relative expression.
Supplemental Figure S2. FTIR spectra on valves.
Supplemental Figure S3. FTIR spectra on valves following NaOH treatment.
Supplemental Figure S4. ETT expression pattern.
Supplemental Figure S5. Box-plot representing the distribution of the data shown in Figure 3.
Supplemental Figure S6. PME5 and ETT relative expression.
Supplemental Figure S7. Box-plot representing the distribution of the data shown in Figure 5.
Supplemental Figure S8. Expression of PME5 in the valves increases valve/gynoecium ratio in ett-22 mutants.
Supplemental Figure S9. Box-plot representing the distribution of the data shown in Supplemental Figure S8.
Supplemental Figure S10. Construct used to induce the expression of PME5 by ethanol.
Supplemental Figure S11. Construct used to express PME5 under the control of the CRABS CLAW (CRC) promoter.
Supplemental Table S1. Means and standard deviations obtained for valve/gynoecia length ratio measurements.
Supplemental Table S2. Primers used for qRT-PCR experiments.
Acknowledgments
Thanks to R. Scott Poethig for seeds of 35S:ETTm (Hunter et al., 2006), to A. Peaucelle for the 35S > >PMEI3 and 35S > >PME5 seeds (Peaucelle et al., 2008) and Sophie Bouton for sharing PME and PMEI specific primers. We would like to thank O. Hamant for stimulating discussions and critical reading of the manuscript. We thank Frédérique Rozier, Laetitia Vachez and Marion Pujos for participating in the experiments.
Footnotes
The authors acknowledge funding from Génoplante and the French National Research Agency (ANR-BLAN-0211-01) to C.P.S., European ERC grant MORPHODYNAMICS to J.T., and a Rhône-Alpes doctoral studentship to M.C.R.
References
- Asnacios A, Hamant O (2012) The mechanics behind cell polarity. Trends Cell Biol 22: 584–591 [DOI] [PubMed] [Google Scholar]
- Boron AK, Van Loock B, Suslov D, Markakis MN, Verbelen J-P, Vissenberg K (2015) Over-expression of AtEXLA2 alters etiolated arabidopsis hypocotyl growth. Ann Bot 115: 67–80 [DOI] [PMC free article] [PubMed] [Google Scholar]
- Boutté Y, Crosnier M-T, Carraro N, Traas J, Satiat-Jeunemaitre B (2006) The plasma membrane recycling pathway and cell polarity in plants: studies on PIN proteins. J Cell Sci 119: 1255–1265 [DOI] [PubMed] [Google Scholar]
- Braybrook SA, Peaucelle A (2013) Mechano-chemical aspects of organ formation in Arabidopsis thaliana: the relationship between auxin and pectin. PLoS One 8: e57813. [DOI] [PMC free article] [PubMed] [Google Scholar]
- Das P, Ito T, Wellmer F, Vernoux T, Dedieu A, Traas J, Meyerowitz EM (2009) Floral stem cell termination involves the direct regulation of AGAMOUS by PERIANTHIA. Development 136: 1605–1611 [DOI] [PubMed] [Google Scholar]
- Downie B, Dirk LMA, Hadfield KA, Wilkins TA, Bennett AB, Bradford KJ (1998) A gel diffusion assay for quantification of pectin methylesterase activity. Anal Biochem 264: 149–157 [DOI] [PubMed] [Google Scholar]
- Draeger C, Ndinyanka Fabrice T, Gineau E, Mouille G, Kuhn BM, Moller I, Abdou M-T, Frey B, Pauly M, Bacic A, et al. (2015) Arabidopsis leucine-rich repeat extensin (LRX) proteins modify cell wall composition and influence plant growth. BMC Plant Biol 15: 155. [DOI] [PMC free article] [PubMed] [Google Scholar]
- Feraru E, Feraru MI, Kleine-Vehn J, Martinière A, Mouille G, Vanneste S, Vernhettes S, Runions J, Friml J (2011) PIN polarity maintenance by the cell wall in Arabidopsis. Curr Biol 21: 338–343 [DOI] [PubMed] [Google Scholar]
- Ferrandiz C, Sessions A (2008b) Preparation and hydrolysis of digoxygenin-labeled probes for in situ hybridization of plant tissues. CSH Protoc 2008: pdb.prot4943. [DOI] [PubMed] [Google Scholar]
- Ferrandiz C, Sessions A (2008a) Nonradioactive in situ hybridization of RNA probes to sections of plant tissues. CSH Protoc 2008: pdb.prot4943. [DOI] [PubMed] [Google Scholar]
- Fleming AJ, McQueen-Mason S, Mandel T, Kuhlemeier C (1997) Induction of leaf primordia by the cell wall protein expansin. Science 276: 1415–1418 [Google Scholar]
- Garcia D, Collier SA, Byrne ME, Martienssen RA (2006) Specification of leaf polarity in Arabidopsis via the trans-acting siRNA pathway. Curr Biol 16: 933–938 [DOI] [PubMed] [Google Scholar]
- Giovane A, Servillo L, Balestrieri C, Raiola A, D’Avino R, Tamburrini M, Ciardiello MA, Camardella L (2004) Pectin methylesterase inhibitor. Biochim Biophys Acta 1696: 245–252 [DOI] [PubMed] [Google Scholar]
- Guilfoyle TJ. (2015) The PB1 domain in auxin response factor and Aux/IAA proteins: a versatile protein interaction module in the auxin response. Plant Cell 27: 33–43 [DOI] [PMC free article] [PubMed] [Google Scholar]
- Guilfoyle TJ, Hagen G (2007) Auxin response factors. Curr Opin Plant Biol 10: 453–460 [DOI] [PubMed] [Google Scholar]
- Hamant O, Moulia B (2016) How do plants read their own shapes? New Phytol 212: 333–337 [DOI] [PubMed] [Google Scholar]
- Hawkins C, Liu Z (2014) A model for an early role of auxin in Arabidopsis gynoecium morphogenesis. Front Plant Sci 5: 327. [DOI] [PMC free article] [PubMed] [Google Scholar]
- Heisler MG, Hamant O, Krupinski P, Uyttewaal M, Ohno C, Jönsson H, Traas J, Meyerowitz EM (2010) Alignment between PIN1 polarity and microtubule orientation in the shoot apical meristem reveals a tight coupling between morphogenesis and auxin transport. PLoS Biol 8: e1000516. [DOI] [PMC free article] [PubMed] [Google Scholar]
- Hunter C, Willmann MR, Wu G, Yoshikawa M, de la Luz Gutiérrez-Nava M, Poethig SR (2006) Trans-acting siRNA-mediated repression of ETTIN and ARF4 regulates heteroblasty in Arabidopsis. Development 133: 2973–2981 [DOI] [PMC free article] [PubMed] [Google Scholar]
- Kacuráková M, Capek P, Sasinková V, Wellner N, Ebringerová A (2000) FT-IR study of plant cell wall model compounds: pectic polysaccharides and hemicelluloses. Carbohydr Polym 43: 195–203 [Google Scholar]
- Larsson E, Roberts CJ, Claes AR, Franks RG, Sundberg E (2014) Polar auxin transport is essential for medial versus lateral tissue specification and vascular-mediated valve outgrowth in Arabidopsis gynoecia. Plant Physiol 166: 1998–2012 [DOI] [PMC free article] [PubMed] [Google Scholar]
- Lee J-Y, Baum SF, Alvarez J, Patel A, Chitwood DH, Bowman JL (2005) Activation of CRABS CLAW in the nectaries and carpels of Arabidopsis. Plant Cell 17: 25–36 [DOI] [PMC free article] [PubMed] [Google Scholar]
- Levesque-Tremblay G, Müller K, Mansfield SD, Haughn GW (2015) HIGHLY METHYL ESTERIFIED SEEDS is a pectin methyl esterase involved in embryo development. Plant Physiol 167: 725–737 [DOI] [PMC free article] [PubMed] [Google Scholar]
- Lionetti V, Raiola A, Camardella L, Giovane A, Obel N, Pauly M, Favaron F, Cervone F, Bellincampi D (2007) Overexpression of pectin methylesterase inhibitors in Arabidopsis restricts fungal infection by Botrytis cinerea. Plant Physiol 143: 1871–1880 [DOI] [PMC free article] [PubMed] [Google Scholar]
- Milani P, Mirabet V, Cellier C, Rozier F, Hamant O, Das P, Boudaoud A (2014) Matching patterns of gene expression to mechanical stiffness at cell resolution through quantitative tandem epifluorescence and nanoindentation. Plant Physiol 165: 1399–1408 [DOI] [PMC free article] [PubMed] [Google Scholar]
- Mouille G, Robin S, Lecomte M, Pagant S, Höfte H (2003) Classification and identification of Arabidopsis cell wall mutants using Fourier-Transform InfraRed (FT-IR) microspectroscopy. Plant J 35: 393–404 [DOI] [PubMed] [Google Scholar]
- Müller K, Levesque-Tremblay G, Fernandes A, Wormit A, Bartels S, Usadel B, Kermode A (2013) Overexpression of a pectin methylesterase inhibitor in Arabidopsis thaliana leads to altered growth morphology of the stem and defective organ separation. Plant Signal Behav 8: e26464. [DOI] [PMC free article] [PubMed] [Google Scholar]
- Peaucelle A, Louvet R, Johansen JN, Höfte H, Laufs P, Pelloux J, Mouille G (2008) Arabidopsis phyllotaxis is controlled by the methyl-esterification status of cell-wall pectins. Curr Biol 18: 1943–1948 [DOI] [PubMed] [Google Scholar]
- Peaucelle A, Braybrook SA, Le Guillou L, Bron E, Kuhlemeier C, Höfte H (2011a) Pectin-induced changes in cell wall mechanics underlie organ initiation in Arabidopsis. Curr Biol 21: 1720–1726 [DOI] [PubMed] [Google Scholar]
- Peaucelle A, Louvet R, Johansen JN, Salsac F, Morin H, Fournet F, Belcram K, Gillet F, Höfte H, Laufs P, et al. (2011b) The transcription factor BELLRINGER modulates phyllotaxis by regulating the expression of a pectin methylesterase in Arabidopsis. Development 138: 4733–4741 [DOI] [PubMed] [Google Scholar]
- Peaucelle A, Wightman R, Höfte H (2015) The control of growth symmetry breaking in the Arabidopsis hypocotyl. Curr Biol 25: 1746–1752 [DOI] [PubMed] [Google Scholar]
- Pekker I, Alvarez JP, Eshed Y (2005) Auxin response factors mediate Arabidopsis organ asymmetry via modulation of KANADI activity. Plant Cell 17: 2899–2910 [DOI] [PMC free article] [PubMed] [Google Scholar]
- Pelloux J, Rustérucci C, Mellerowicz EJ (2007) New insights into pectin methylesterase structure and function. Trends Plant Sci 12: 267–277 [DOI] [PubMed] [Google Scholar]
- Pfaffl MW, Tichopad A, Prgomet C, Neuvians TP (2004) Determination of stable housekeeping genes, differentially regulated target genes and sample integrity: BestKeeper—Excel-based tool using pair-wise correlations. Biotechnol Lett 26: 509–515 [DOI] [PubMed] [Google Scholar]
- Pien S, Wyrzykowska J, McQueen-Mason S, Smart C, Fleming A (2001) Local expression of expansin induces the entire process of leaf development and modifies leaf shape. Proc Natl Acad Sci USA 98: 11812–11817 [DOI] [PMC free article] [PubMed] [Google Scholar]
- Qi J, Wu B, Feng S, Lü S, Guan C, Zhang X, Qiu D, Hu Y, Zhou Y, Li C, Long M, Jiao Y (2017) Mechanical regulation of organ asymmetry in leaves. Nat Plants 3: 724–733 [DOI] [PubMed] [Google Scholar]
- Roeder AHK, Yanofsky MF (2006) Fruit development in Arabidopsis. Arabidopsis Book 4: e0075. [DOI] [PMC free article] [PubMed] [Google Scholar]
- Sénéchal F, L’Enfant M, Domon J-M, Rosiau E, Crépeau M-J, Surcouf O, Esquivel-Rodriguez J, Marcelo P, Mareck A, Guérineau F, et al. (2015) Tuning of pectin methylesterification: PECTIN METHYLESTERASE INHIBITOR 7 modulates the processive activity of co-expressed PECTIN METHYLESTERASE 3 in a pH-dependent manner. J Biol Chem 290: 23320–23335 [DOI] [PMC free article] [PubMed] [Google Scholar]
- Simonini S, Deb J, Moubayidin L, Stephenson P, Valluru M, Freire-Rios A, Sorefan K, Weijers D, Friml J, Østergaard L (2016) A noncanonical auxin-sensing mechanism is required for organ morphogenesis in Arabidopsis. Genes Dev 30: 2286–2296 [DOI] [PMC free article] [PubMed] [Google Scholar]
- Simonini S, Bencivenga S, Trick M, Østergaard L (2017) Auxin-induced modulation of ETTIN activity orchestrates gene expression in Arabidopsis. Plant Cell 29: 1864–1882 [DOI] [PMC free article] [PubMed] [Google Scholar]
- Smyth DR, Bowman JL, Meyerowitz EM (1990) Early flower development in Arabidopsis. Plant Cell 2: 755–767 [DOI] [PMC free article] [PubMed] [Google Scholar]
- Szymanska-Chargot M, Zdunek A (2013) Use of FT-IR spectra and PCA to the bulk characterization of cell wall residues of fruits and vegetables along a fraction process. Food Biophys 8: 29–42 [DOI] [PMC free article] [PubMed] [Google Scholar]
- Wilson RH, Smith AC, Kacuráková M, Saunders PK, Wellner N, Waldron KW (2000) The mechanical properties and molecular dynamics of plant cell wall polysaccharides studied by Fourier-transform infrared spectroscopy. Plant Physiol 124: 397–405 [DOI] [PMC free article] [PubMed] [Google Scholar]
- Wolf S, Hématy K, Höfte H (2012) Growth control and cell wall signaling in plants. Annu Rev Plant Biol 63: 381–407 [DOI] [PubMed] [Google Scholar]
- Xiao C, Somerville C, Anderson CT (2014) POLYGALACTURONASE INVOLVED IN EXPANSION1 functions in cell elongation and flower development in Arabidopsis. Plant Cell 26: 1018–1035 [DOI] [PMC free article] [PubMed] [Google Scholar]


