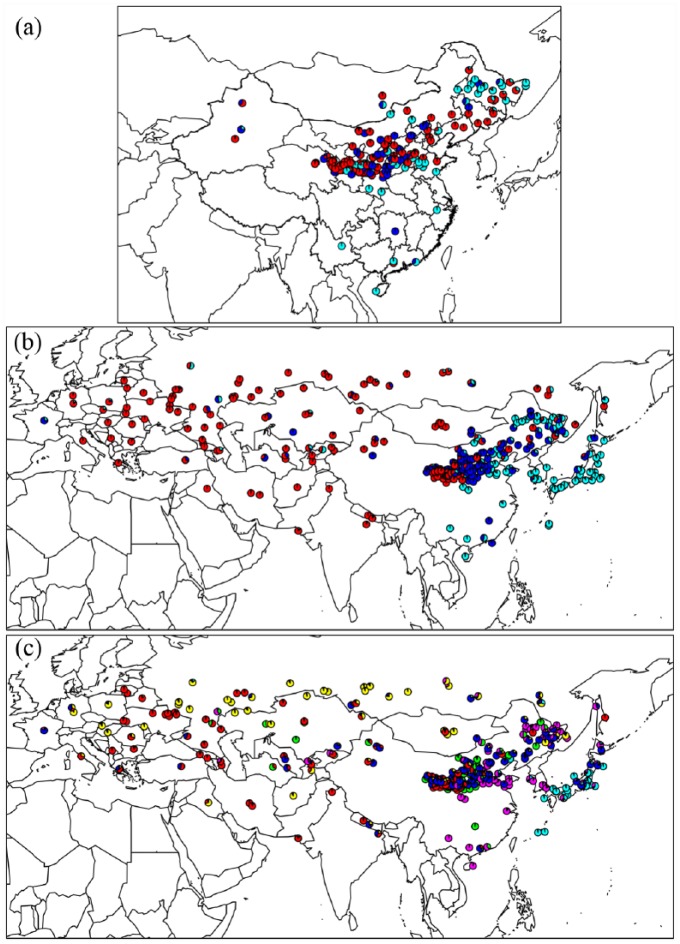
Figure 4.
Proportional assignments of each landrace sample to ancestral genepools inferred using Instruct (Gao et al., 2007). Each sample is represented as a pie chart, mapped according to its origin as provided by the accession data supplied by the germplasm banks. Different colours of the pie slices represent the K genepools modelled by Instruct. Colours of the genepools are chosen to correspond with previously published analyses of related datasets (Hunt et al., 2011, 2013). The pie charts show the relative membership of the K genepools for each sample. The most realistic inferred values of K are shown: (a) 195 Chinese samples, for K = 3, (b) 341 panEurasian samples, under K = 3 and (c) 341 panEurasian samples, under K = 6.

