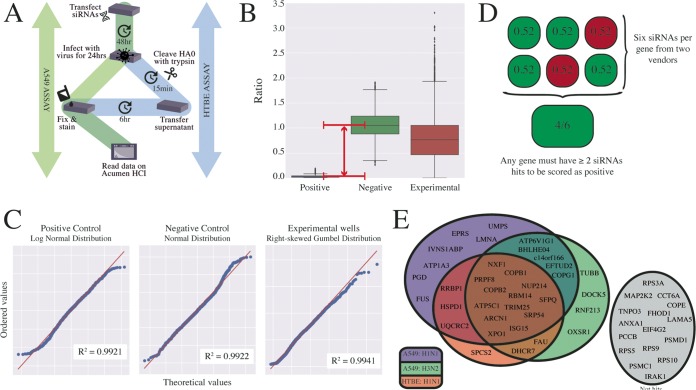
FIG 3.
A targeted siRNA screen identifies IAV-required host factors. (A) Schematic representation of the assay used to screen putative host factors for their requirement in influenza virus replication. The green pathway (left) describes the A549 cell-based screen using influenza A/WSN/3 (H1N1) virus and influenza A/Pan/99 (H3N2) virus. The blue pathway (right) describes the follow-up screen performed in primary human tracheal bronchial epithelial (HTBE) cells. (B) Box-and-whisker plots showing the distribution of the raw values from the positive control and the negative control and the experimental data for the A549 cell-based screen (across both IAV subtypes), after the removal of outliers was performed using a Bayesian statistical approach. The first and third quartiles of the remaining data are indicated by the boundaries of the box, with the median indicated within the box. The whiskers represent the extreme boundaries of the data, with extreme values (values exceeding 1.5× the interquartile range beyond the median) plotted as points beyond the whiskers. The window between the positive and negative controls is indicated by a red arrow. (C) The raw data from the A549 cell-based screen were plotted against ideal probability distributions in quantile-quantile (QQ) plots (a graphical method for comparing probability distributions). If data from two distributions are similar, they lie approximately on the line y = x (red). Pearson correlation coefficients measure the degree to which the data fit the proposed probability distribution. The positive control (siRNA targeting influenza virus NP protein) follows a log-normal distribution (R2 = 0.9921), the negative control (nontargeting siRNA) follows a normal distribution (R2 = 0.9922), and the experimental data (siRNAs targeting putative host factors) follow a right-skewed Gumbel distribution (R2 = 0.9941). (D) Example data from an experimental condition are shown to illustrate the hit selection criteria. An siRNA targeting a candidate gene was required to reduce the normalized percentage of infection below 0.6 to be characterized as a hit (shown in green versus nonhits shown in red). Finally, for a gene to be scored as a hit in any screen it was required that at least two siRNAs for a gene candidate met these criteria. (E) The results from the two A549-based screens (purple and green) and the HTBE screen (red) are summarized in a Venn diagram. In the A549 cell-based screen, seven and four genes were uniquely identified in the H1N1 (purple) and H3N2 (green) variants, respectively. A total of 18 genes were identified in both A549 screens. These 18 genes (along with 8 genes from the pilot group) were additionally screened in HTBEs with influenza A/WSN/33 (H1N1) virus. Thirteen genes (brown section) were hits in all three variations of the screen. Gene candidates that were not scored as hits are shown in gray.

