Abstract
Purpose
The purpose of this study was to introduce a new algorithm for automated measurement of the modulation transfer function (MTF) using an edge of a readily available phantom and to evaluate the effect of reconstruction filter and field of view (FOV) on the spatial resolution in the CT images.
Methods
Our automated MTF measurement consisted of several steps. The center of the image was established and an appropriate region of interest (ROI) designated. The edge spread function (ESF) was determined, and a suitably interpolated ESF curve was differentiated to obtain the line spread function (LSF). The LSF was Fourier transformed to obtain the MTF. All these steps were accomplished automatically without user intervention. The results of the automated MTF from the edge phantom were validated by comparing them with a point image, and the results of the automated calculation were validated by the standard fitting method. The automated MTF calculation was then applied to the images of two polymethyl methacrylate (PMMA) phantoms and a wire phantom which had been scanned by a Toshiba Alexion 4‐slice CT scanner and reconstructed with various filter types and FOVs.
Results
The difference in the 50% MTF values obtained from the edge and point phantoms were within ±4%. The values from the automated and fitted methods agreed to within ±2%, indicating that the automated MTF calculation was accurate. The automated MTF calculation was able to differentiate MTF curves for various filters. The spatial resolution values were 0.37 ± 0.00, 0.71 ± 0.01, and 0.78 ± 0.01 cycles/mm for FC13, FC30 and FC52 filters, respectively. The spatial resolution of the images decrease linearly (R 2 > 0.98) with increasing FOVs.
Conclusion
An automated MTF method was successfully developed using an edge phantom, the PMMA phantom. The method is easy to implement in a clinical environment and is not influenced by user experience.
Keywords: automated MTF calculation, edge spread function, field of view, modulation transfer function, PMMA phantom, spatial resolution
1. INTRODUCTION
A CT scanner is an effective and efficient tool to obtain quality images of patients for diagnosing diseases and abnormalities.1, 2 Image quality is determined by several parameters, including spatial resolution,3 noise,4, 5 and low contrast detectability.6 Some of these parameters should be monitored through periodic quality control.7
Spatial resolution is a measure of the ability to differentiate adjacent objects in an image.8 It is important to evaluate spatial resolution carefully, since objects in a CT image are corrupted by the point spread function (PSF) of the CT imaging system.9 The PSF is affected by factors such as the finite size of the x‐ray source10 and the limitations of the image reconstruction algorithm, e.g. filtered back‐projection (FBP) method or iterative reconstructive (IR) method.11 The accuracy of measuring small densities or thin structures within the body depends on the spatial resolution.9 In practice, the spatial resolution is determined based on the ability to discriminate a line pair object in a phantom.12, 13 However, this conventional technique is very subjective. An objective way to characterize the spatial resolution is by using the modulation transfer function (MTF) curve.14, 15, 16
There are several methods for determining MTF: using point spread function (PSF),17 line spread function (LSF),18 edge spread function (ESF)19 and directly from image bar patterns (BP).20, 21 The MTF calculation can be carried out analytically using ESF, PSF, or LSF, i.e. by converting the ESF to the LSF by differentiation,19 or by converting the PSF to LSF by an averaging process17 and then taking the Fourier Transform of the LSF.17 The calculation of the MTF can also be performed by using a fitting method either with the LSF curve22 or with the ESF curve,23 or calculated directly from phantom bar patterns.20 The calculation of MTF using these methods is tedious, time consuming and highly dependent on the expertise of the medical personnel involved. The calculation speed and objectivity of MTF calculations can be increased using automation with appropriate software.24
Up until now, MTF calculations (manually or automatically), based on PSF, LSF, ESF, or BP, require specific phantoms such as the AAPM CT performance phantom,25 Catphan phantom,21, 26 ACR CT accreditation phantom,19 MHT‐type phantom27 or a specially designed edge phantom.18 However, these phantom types may not be owned by a CT center, especially in developing countries. The type of phantom most probably owned by the CT center is a phantom to measure the CT output dose (CTDIvol), the polymethyl methacrylate (PMMA) phantom.28 For this reason, we developed automated MTF measurement using the PMMA phantom. We then implemented our automated MTF calculation method to evaluate the effect of reconstruction filter and FOV on spatial resolution.
2. MATERIALS AND METHODS
2.A. Automated MTF measurement
The steps of the automated MTF calculation are shown in Fig. 1. These steps were implemented in MatLab (Mathworks Inc., Natick, MA Natick, MA) and the user simply uses a single button to complete them. We used standard netbooks for computation (Intel Celeron CPU 1005M, 1.90 GHz, installed RAM 2.0 GB, and 32‐bit operating system). The CT image was opened in its original DICOM format. The phantoms were contoured automatically,29, 30 and the center of the image was determined using the centroid equation.
Figure 1.
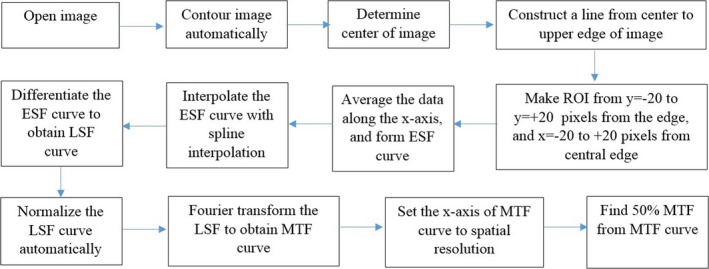
The steps of the automated MTF calculation.
| (1) |
A line was constructed from the center of the phantom to the top of image, so that it passes through the upper edge of the image. This position is considered the center of the region of interest (ROI), with coordinates (x c, y c). A ROI was created with x running from x c − 20 pixels to x c + 20 pixels, and y from y c − 20 pixels to y c + 20 pixels [Fig. 2(a)].
Figure 2.
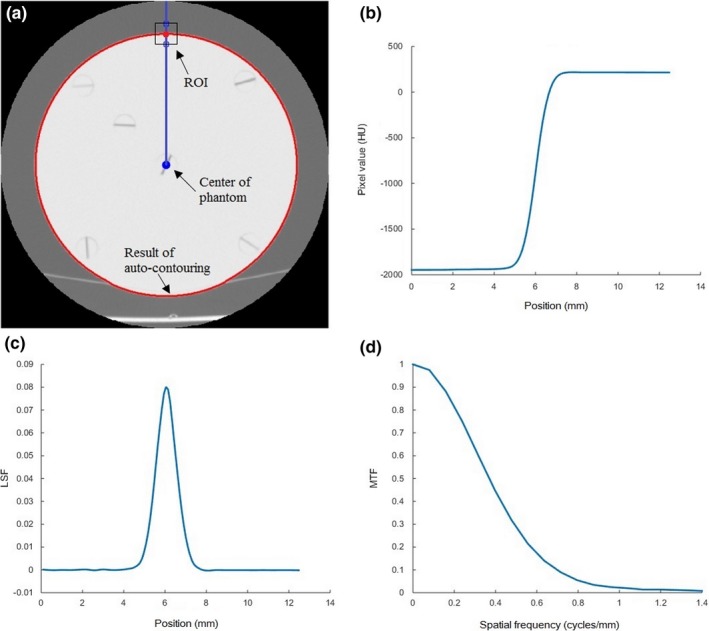
(a) A contoured image and the ROI at the upper edge used to calculate the MTF. (b) The interpolated ESF curve. (c) The LSF curve after the zeroing and normalization processes. (d) The resulting MTF curve used to characterize the spatial resolution of the image.
The averages of the x values in the ROI were taken to give the edge spread function (ESF) where the x‐axis is the position of each pixel upward and the y‐axis is the value of each pixel. This ESF curve under‐sampled the data because the distance between pixels was relatively large.31 For example, for the head PMMA phantom with a 20 cm FOV the pixel size is 0.39 mm. We interpolated the data using spline interpolation to obtain four additional data points between each pixel, in order to secure a higher spatial resolution in the resulting MTF. The interpolated ESF is shown in Fig. 2(b).
The ESF curve was differentiated to obtain the LSF curve, which was then zeroed and normalized. The zeroing process forces the LSF tails to zero values, by subtracting the average of the five pixels in the left‐most part of the curve from all the values of the curve. Normalization of the LSF was required in order to fix the MTF value at 1 for a spatial frequency of 0, after the LSF is converted to MTF. Normalization was done by dividing the LSF by the sum of its original values. The resulting LSF curve, after zeroing and normalization, is shown in Fig. 2(c).
The LSF curve was Fourier transformed to obtain the MTF curve using:
| (2) |
where k = 0, …, N − 1 and N is the vector length of the LSF curve. The spatial frequency of the MTF curve in the x‐axis is given by:
| (3) |
where N I is the number of pixels (in the x or y direction, respectively) and I s is the sampling interval obtained from:
| (4) |
A typical MTF curve is shown in Fig. 2(d), from which the spatial resolution (viz. the spatial frequency at an MTF value of 50%) can be determined.
2.B. Phantom and data acquisition
Two PMMA phantoms were used in this study, one with a diameter of 16 cm and the other with a diameter 32 cm.29 The PMMA phantoms are usually used to represent the index of the absorbed dose for adult head/abdomen.
The PMMA phantoms were placed on the patient table at different positions. Usually, the holes are positioned at 3, 6, 9, and 12 o'clock, but in this study the holes were positioned at 45° from their original positions. This is because the edge to measure the MTF uses the upper edge of the phantoms, so that such a phantom placement guarantees homogeneity within the phantom close to the upper edge. Conversely, if the phantom placement is not rotated 45°, there is an inhomogeneity within the phantom near the upper edge at the small hole used to place the ionization chamber pencil, and so it could not be used to measure MTF. Notwithstanding, the phantom position can be used to calculate the MTF using a special procedure called tail replacement on the resulting ESF curve as proposed by Sanders et al.3
In this study, the PMMA phantoms were scanned using a Toshiba Alexion 4‐slice CT scanner. The scan parameters are indicated in Table 1. The phantoms images were reconstructed using three filter types, namely FC13, FC30, and FC52. FC13 is a filter used for soft tissue, FC30 for bone, and F52 for lung. For the head PMMA phantom, the field of view (FOV) was varied (Fig. 3), while for the body PMMA phantom we used a FOV of 35 cm.
Table 1.
Scan parameters
| Scan parameter | Setting |
|---|---|
| Tube voltage | 120 kVp |
| Rotation time | 1 s |
| Slice thickness | 2 mm |
| Nominal beam width | 4 × 2 mm |
| Focal spot | 1.1 × 1.1 mm |
| Filter type | Large |
Figure 3.
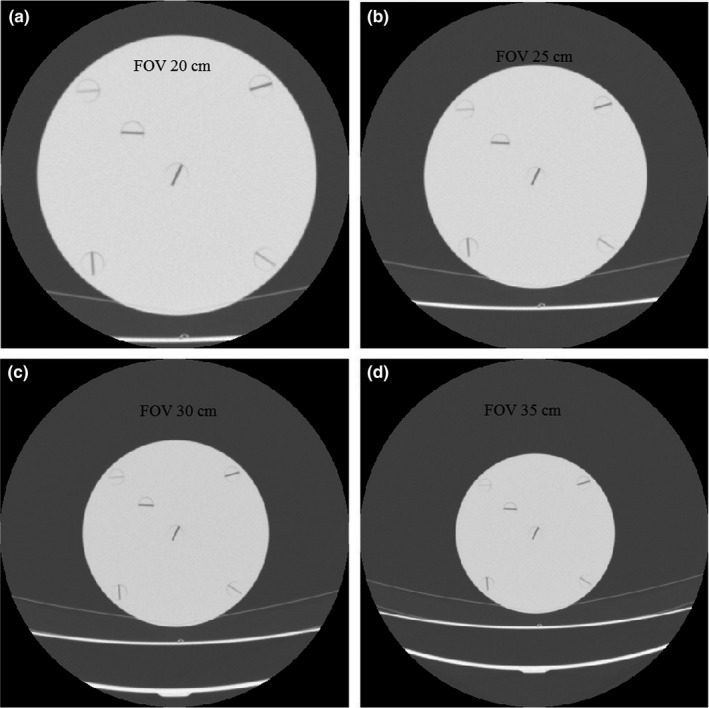
Examples of head PMMA phantom images for various fields of view. (a) 20 cm, (b) 25 cm, (c) 30 cm, and (d) 35 cm.
2.C. Validation of using the edge phantom
To validate the MTF curves obtained using the edge phantom, we compared it with using a wire phantom as shown in Fig. 4(a). The wire phantom comprised a cylinder of resin (200 ml volume of a CT injector syringe, Kyorindo Nemoto Co., Ltd., Japan) with a diameter (D) of 4.8 cm. At the center of the phantom is a thin wire with a diameter (d) of 0.1 mm and a length (L) of about 5 cm. The phantom was filled with tap water to a volume of about 150 ml. The scan parameters of the wire phantom are indicated in Table 1. The FOV was 7.0 cm and the images were reconstructed using three filter types: FC13, FC30, and FC52.
Figure 4.
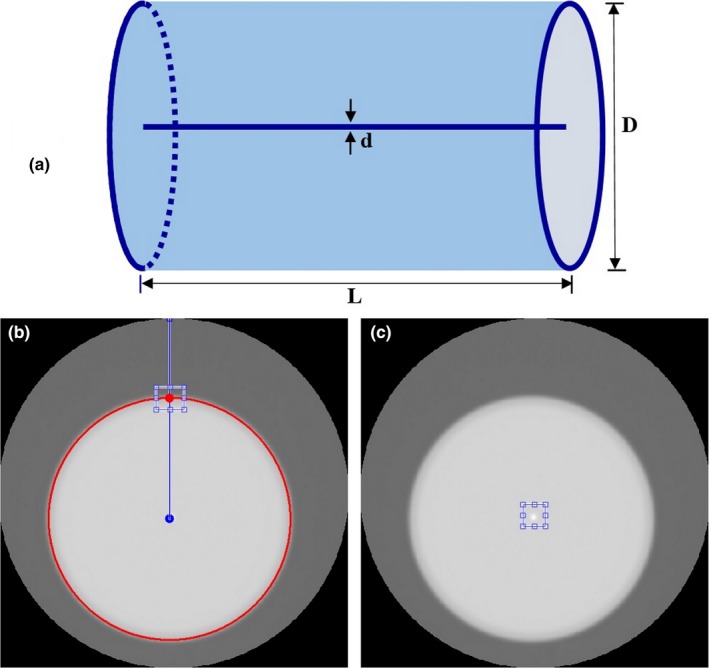
(a) The wire phantom comprised a cylinder of resin with a thin wire of diameter of 0.1 mm at the center. (b) ROI for MTF calculations using the proposed algorithm from the upper edge of the phantom. (c) ROI for MTF calculation with standard method obtained directly from the center of the image (point image).
The ROI for MTF calculations using the proposed algorithm from the upper edge of the phantom was shown in Fig. 4(b). A point image was obtained from the wire phantom and used to calculate MTF from the center of the phantom image with a rectangular ROI (32 × 32 pixels) as shown in Fig. 4(c). The image was cropped to that size and position. The pixels were then averaged along the y‐direction to obtain the profile of the pixel values at a point along the x‐direction or LSF curve, which was used to obtain the MTF curve with the same algorithm as in Section 2.A. The MTF results from the proposed method were then compared with the MTF values obtained directly from the point image.
2.D. Validation of the automated MTF algorithm
To validate the automated MTF algorithm, we used one of the standard methods of MTF calculation, i.e. the ESF fitting method suggested by Boone and Seibert.21 This method was proposed for calculating MTF in digital mammography systems, but it can be used in CT systems with a standard filter, i.e. soft tissue kernel. In this method, the measured ESF is fitted to the equation:
| (5) |
The measured ESF curve is usually low to the left and high to the right, so that:
| (6) |
However, this does not take into account the offset and range of the measured ESF.21 Taking these into account the equation for fitting the ESF becomes:
| (7) |
A typical example fitting the measured ESF to Eq. (7) is shown in Fig. 5(a).
Figure 5.
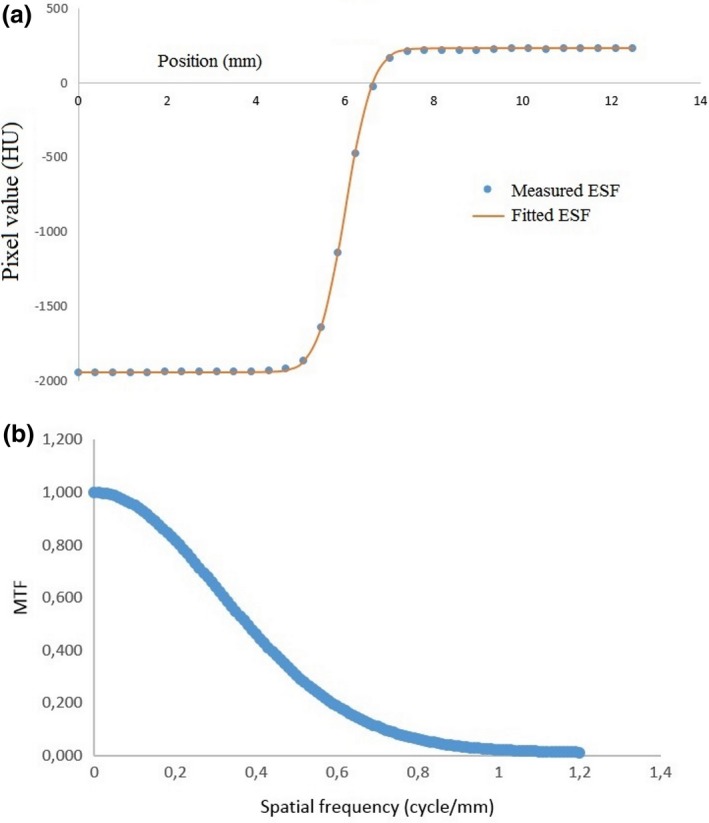
(a) The measured ESF is fitted by inputting the parameters a, b, c, and d by trial and error, to obtain the best correspondence to Eq. (7), and (b) The corresponding MTF curve calculated using Eq. (8).
The fitting process between the new ESF curve and the measured ESF curve is carried out by choosing different values of a, b, c, and d by trial and error. After the ESF is accurately fitted, the coefficients of the fit (a, b, c, and d) were used to calculate the MTF using:
| (8) |
An example of the resulting MTF is shown in Fig. 5(b).
3. RESULTS
3.A. MTF validation using the edge phantom
The MTF curves obtained using the upper edge and the wire phantom (point image) for FC13 and FOV of 7.0 cm are shown in Fig. 6. Both MTF curves are comparable. The spatial resolution values at 50% MTF are tabulated in Table 2. The differences in the 50% MTF values between the two approaches are within ±4% for all filters used (FC13, FC30 and FC52).
Figure 6.
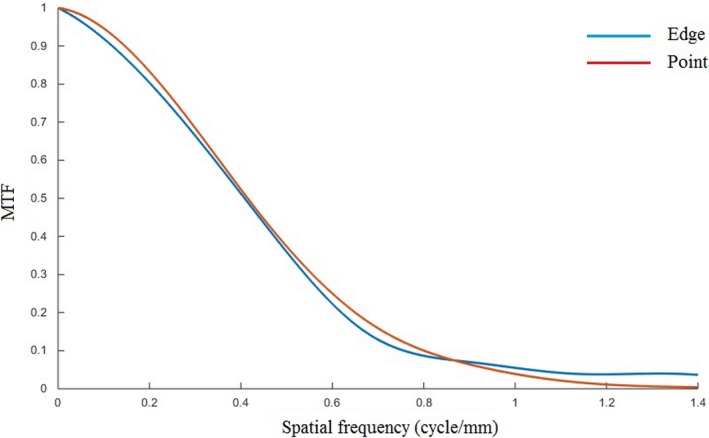
Comparison of MTF curves obtained using upper edge and central phantom (point image) for FC13 filter and FOV of 7.0 cm.
Table 2.
The values of spatial resolution at 50% MTF from the upper edge and the center of the wire phantom (point image) for FC13, FC30 and FC52 filters, and for FOV of 7.0 cm
| Filter | Spatial resolution at 50% MTF (cycle/mm) | |
|---|---|---|
| Using edge image | Using point image | |
| FC13 | 0.42 ± 0.01 | 0.42 ± 0.01 |
| FC30 | 0.87 ± 0.04 | 0.85 ± 0.02 |
| FC52 | 0.96 ± 0.06 | 0.92 ± 0.04 |
3.B. Validation of automated MTF algorithm
The best‐fit values of a, b, c, d, and x 0, for various FOVs in the FC13 filter, are shown in Table 3. These values were then used to calculate the MTF curve using Eq. (8). The automated MTF curves were compared with those obtained by standard fitting of Fig. 7, for four different FOVs. The spatial resolution values at 50% MTF are tabulated in Table 4. The differences in the 50% MTF values between the automated method and the standard fitting method are within ±2%.
Table 3.
The best‐fit values of a, b, c, d, and x 0, for various FOVs in the FC13 filter
| Parameter | FOV | |||
|---|---|---|---|---|
| 20 cm | 25 cm | 30 cm | 35 cm | |
| a | 1.30 | 1.30 | 1.30 | 1.30 |
| b | 2.25 | 2.05 | 1.85 | 1.65 |
| c | 8.70 | 8.70 | 8.70 | 8.70 |
| d | 2.00 | 1.85 | 1.55 | 1.25 |
| x 0 | 6.00 | 7.32 | 9.34 | 10.93 |
Figure 7.
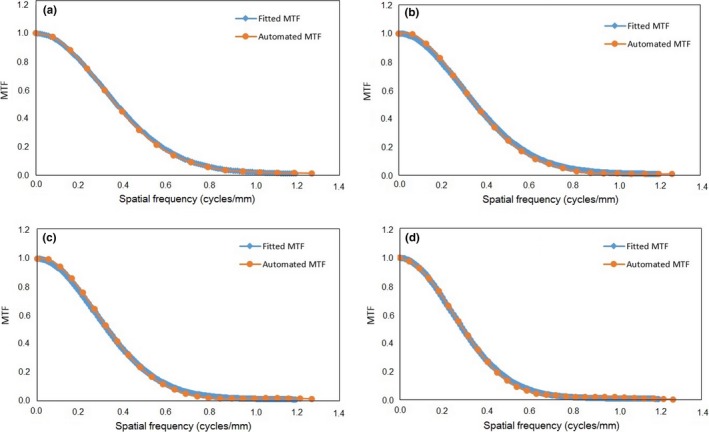
The results of the MTF curves from the automated and fitted methods for various FOVs. (a) 20 cm, (b) 25 cm, (c) 30 cm, and (d) 35 cm.
Table 4.
The values of spatial resolution at 50% MTF from the automated calculation and the standard fitting methods for the head and body PMMA phantom, for various FOVs using the FC13 filter
| FOV (cm) | Spatial resolution at 50% MTF (cycle/mm) | |
|---|---|---|
| Automated calculation | Fitting method | |
| 20 | 0.37 ± 0.00 | 0.37 |
| 25 | 0.35 ± 0.00 | 0.36 |
| 30 | 0.33 ± 0.00 | 0.33 |
| 35 | 0.30 ± 0.00 | 0.29 |
3.C. MTF for type filter variation
The MTF curves for the FC13, FC30, and FC52 filters at a FOV of 20 cm are shown in Fig. 8. They show that the automated MTF calculation is able to differentiate MTF curves for various filters. The largest spatial resolution is for the FC52 filter, followed by the FC30 filter, and the smallest spatial resolution is for the FC13 filter. The spatial resolution values (at 50% MTF) are 0.78 ± 0.01, 0.71 ± 0.01, and 0.37 ± 0.00 cycles/mm for the FC52, FC30, and FC13 filters, respectively.
Figure 8.
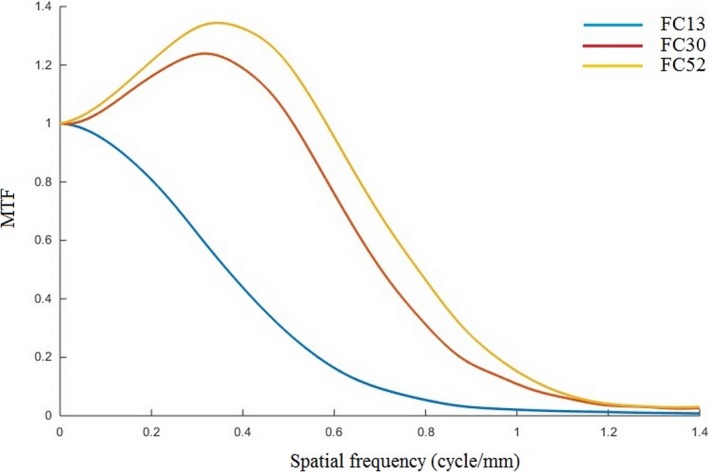
MTF curves for different filters (FC13, FC30 and FC52) using a FOV of 20 cm.
3.D. MTF for FOV variation
The MTF curves for different FOVs using the FC13 filter are shown in Fig. 9. The spatial resolution gets smaller as the FOV increases (from 7 to 35 cm). The spatial resolution (at 50% MTF) values for different FOVs are shown in Fig. 10, for the three (FC13, FC30 and FC52) filters. The spatial resolution decreases linearly with increasing FOV (R 2 > 0.98 for all filters). Table 5 shows the spatial resolution values measured using both PMMA phantoms at FOV of 35 cm and for three types of reconstruction filters using our automated calculation. The spatial resolution values measured for both body and head PMMA phantoms are comparable to within ±4%; however, the standard deviations in the body phantom results are greater than in the head phantom due to noise.
Figure 9.
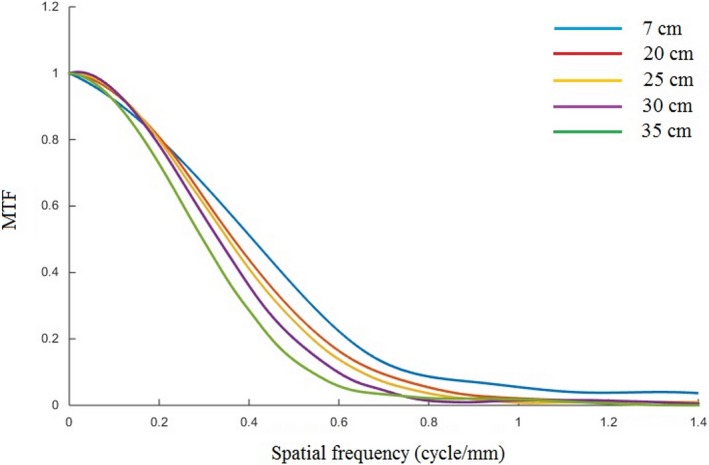
The MTF curves for different FOVs (7, 20, 25, 30, and 35 cm), using the FC13 filter.
Figure 10.
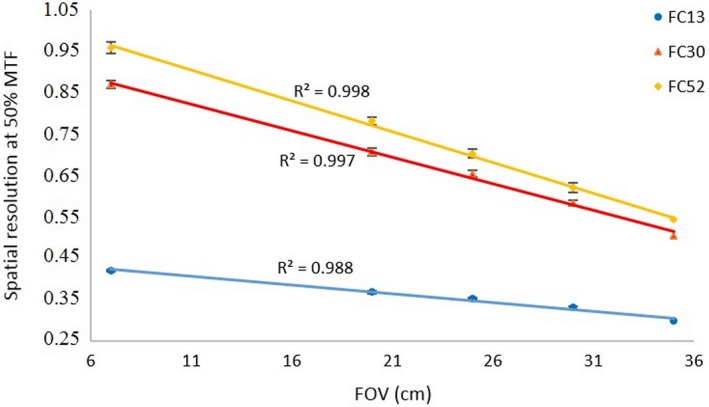
The spatial resolution (at 50% MTF) values for FOV variations for three type filters (FC13, FC30 and FC52).
Table 5.
The values of spatial resolution at 50% MTF for the head and body PMMA phantom for various filters using a FOV of 35 cm
| Filter type | Spatial resolution at 50% MTF (cycle/mm) | |
|---|---|---|
| Head PMMA phantom | Body PMMA phantom | |
| FC13 | 0.30 ± 0.00 | 0.31 ± 0.02 |
| FC30 | 0.51 ± 0.01 | 0.50 ± 0.06 |
| FC52 | 0.54 ± 0.01 | 0.55 ± 0.09 |
4. DISCUSSION
An algorithm for the automated calculation of MTF for PMMA phantom images has been developed and validated. The results agree well with values calculated using a standard fitting method developed by Boone and Seibert.23 The standard fitting method is straightforward and requires a simple computational calculation, but the fitting of the measured ESF curve is highly labor intensive. The complete automated MTF calculation take less than 1 s using a standard netbook. This proposed method may be applicable to all CT centers because it does not need a dedicated special phantom,17, 18, 19, 20, 21, 22, 23, 24, 25, 26 but rather the common PMMA phantom.
Unlike the standard fitting method23 which can only be applied to MTF calculations with certain types of filter reconstructions with soft‐tissue kernel, i.e. FC13, but is not applicable to other filters such as bone and lung kernels due to the additional contrast of each object edge, the automated MTF methods can be readily applied to all types of reconstruction filter. Figure 8 showed that the automated MTF calculation can distinguish the spatial resolution of images using soft tissue, bone, and lung kernels. It is likely that the proposed technique would help practitioners in medical centers to obtain the spatial resolution measurement for CT scans accurately, and independently of any subjectivity in measurement.
We confirmed that the spatial resolution of the head PMMA phantom decreases linearly (R 2 > 0.98) with increasing FOV. The spatial resolution of the body PMMA phantom was comparable to that measured in the head PMMA phantom for the same FOV (35 cm) (Table 5), although the standard deviation in the body phantom results are greater than in the head phantom. This is because, the noise in the body PMMA phantom is greater (about 6.5‐fold) than that in the head PMMA phantom at the same exposure factor (mAs and kVp), while the CT number in the head PMMA phantom (about 117 HU) is smaller than that in the body PMMA phantom (about 127 HU). Higher noise causes correspondingly higher MTF fluctuations, resulting in an increase in the standard deviation of the measured MTF.23, 32
The implication is that if in a clinical examination requires higher spatial resolution, the FOV value should be kept small. However, if the FOV is too small then the patient's image may be truncated.33 The selection of the FOV should be chosen carefully to match clinical needs.34, 35 Our study had several limitations. We only used one scanner model. We implemented the method using code written in MatLab, which would need to be installed at each medical center. The complete code for our automated MTF calculation can be found in the Data S1.
5. CONCLUSIONS
A method for calculating the spatial resolution automatically using an edge phantom (viz., the PMMA phantom) has been developed. The method is very easy to implement in clinical applications, works very quickly, and is more objective since it is not influenced by user experience. We validated the automated MTF calculation using an edge of phantom by comparing the results with standard methods. The 50% MTF values obtained from the edge and point phantoms agreed to within ±4%, and the difference between the automated and fitted method was within ±2%. We found that spatial resolution decreases linearly with increasing FOV (R 2 > 0.98).
CONFLICT OF INTEREST
The authors declare no conflicts of interest.
Supporting information
Data S1. Codes of the automated MTF calculation.
ACKNOWLEDGMENTS
We acknowledge financial support from Penelitian Dasar Unggulan Perguruan Tinggi (PDUPT), Kementerian Riset, Teknologi, dan Pendidikan Tinggi, Republik Indonesia (532z/I1.C01/PL/2018).
REFERENCES
- 1. Verdun FR, Racine D, Ott JG, et al. Image quality in CT: from physical measurements to model observers. Phys Med. 2015;31:823–843. [DOI] [PubMed] [Google Scholar]
- 2. Wilson JM, Christianson OI, Richard S, Samei E. A methodology for image quality evaluation of advanced CT systems. Med Phys. 2013;40:031908. [DOI] [PubMed] [Google Scholar]
- 3. Sanders J, Hurwitz L, Samei E. Patient‐specific quantification of image quality: an automated method for measuring spatial resolution in clinical CT images. Med Phys. 2015;43:5330–5338. [DOI] [PubMed] [Google Scholar]
- 4. Christianson O, Winslow J, Frush DP, Samei E. Automated technique to measure noise in clinical CT examinations. AJR Am J Roentgenol. 2015;205:W93–W99. [DOI] [PubMed] [Google Scholar]
- 5. Chun M, Choi YH, Kim JH. Automated measurement of CT noise in patient images with a novel structure coherence feature. Phys Med Biol. 2015;60:9107–9122. [DOI] [PubMed] [Google Scholar]
- 6. McCollough CH, Yu L, Kofler JM, et al. Degradation of CT low‐contrast spatial resolution due to the use of iterative reconstruction and reduced dose levels. Radiology. 2015;276:499–506. [DOI] [PMC free article] [PubMed] [Google Scholar]
- 7. Nowik P, Bujila R, Poludniowski G, Fransson A. Quality control of CT systems by automated monitoring of key performance indicators: a two‐year study. J Appl Clin Med Phys. 2015;16:254–265. [DOI] [PMC free article] [PubMed] [Google Scholar]
- 8. Dougherty G, Kawaf Z. The point spread function revisited: image restoration using 2‐D deconvolution. Radiography. 2011;7:255–262. [Google Scholar]
- 9. Newman DL, Dougherty G, Al Obaid A, Al Hajrasy H. Limitations of clinical CT in assessing cortical thickness and density. Phys Med Biol. 1998;43:619–626. [DOI] [PubMed] [Google Scholar]
- 10. Arabi H, Kamali Asl AR, Aghamiri SM. The effect of focal spot size on the spatial resolution of variable resolution X‐ray CT Scanner. Iran J Radiat Res. 2010;8:37–43. [Google Scholar]
- 11. Hussain FA, Mail N, Shamy AM, Alghamdi S, Saoudi A. A qualitative and quantitative analysis of radiation dose and image quality of computed tomography images using adaptive statistical iterative reconstruction. J Appl Clin Med Phys. 2016;17:419–432. [DOI] [PMC free article] [PubMed] [Google Scholar]
- 12. McCollough CH, Bruesewitz MR, McNitt‐Gray MF, et al. The phantom portion of the American College of Radiology (ACR) Computed Tomography (CT) accreditation program: practical tips, artifact examples, and pitfalls to avoid. Med Phys. 2004;31:2423–2442. [DOI] [PubMed] [Google Scholar]
- 13. Anam C, Haryanto F, Widita R, Arif I. New noise reduction method for reducing CT scan dose: combining Wiener filtering and edge detection algorithm. Vol. 1677. AIP Conf Proc; 2015:040004.
- 14. Judy PF. The line spread function and modulation transfer function of a computed tomographic scanner. Med Phys. 1976;3:233–236. [DOI] [PubMed] [Google Scholar]
- 15. Bischof CJ, Ehrhardt JC. Modulation transfer function of the EMI CT head scanner. Med Phys. 1977;4:163–167. [DOI] [PubMed] [Google Scholar]
- 16. Samei E, Ranger NT, Dobbins JT, Chen Y. Intercomparison of methods for image quality characterization. I. Modulation transfer function. Med Phys. 2006;33:1454–1465. [DOI] [PubMed] [Google Scholar]
- 17. Kayugawa A, Ohkubo M, Wada S. Accurate determination of CT point‐spread‐function with high precision. J Appl Clin Med Phys. 2013;14:216–226. [DOI] [PMC free article] [PubMed] [Google Scholar]
- 18. Padgett R, Kotre CJ. Development and application of programs to measure modulation transfer function, noise power spectrum and detective quantum efficiency. Radiat Prot Dosim. 2005;117:283–287. [DOI] [PubMed] [Google Scholar]
- 19. Friedman SN, Fung GSK, Siewerdsen JH, Tsui BMW. A simple approach to measure computed tomography (CT) modulation transfer function (MTF) and noise‐power spectrum (NPS) using the American College of Radiology (ACR) accreditation phantom. Med Phys. 2013;40:051907. [DOI] [PMC free article] [PubMed] [Google Scholar]
- 20. Droege RT, Morin RL. A practical method to measure the MTF of CT scanners. Med Phys. 1982;9:758–760. [DOI] [PubMed] [Google Scholar]
- 21. Garayoa J, Castro P. A study on image quality provided by a kilovoltage cone‐beam computed tomography. J Appl Clin Med Phys. 2013;14:239–257. [DOI] [PMC free article] [PubMed] [Google Scholar]
- 22. Yin F, Giger ML, Doi K. Measurement of the presampling modulation transfer function of film digitizers using a curve fitting technique. Med Phys. 1990;17:962–966. [DOI] [PubMed] [Google Scholar]
- 23. Boone JM, Seibert JA. An analytical edge spread function model for computer fitting and subsequent calculation of the LSF and MTF. Med Phys. 1994;21:1541–1545. [DOI] [PubMed] [Google Scholar]
- 24. Miéville F, Beaumont S, Torfeh T, Gudinchet F, Verdun FR. Computed tomography commissioning programmes: how to obtain a reliable mtf with an automatic approach? Radiat Prot Dosim. 2010;139:443–448. [DOI] [PubMed] [Google Scholar]
- 25. Schneiders NJ, Bushong SC. Computer assisted MTF determination in CT. Med Phys. 1980;7:76–78. [DOI] [PubMed] [Google Scholar]
- 26. Nakahara S, Tachibana M, Watanabe Y. One‐year analysis of Elekta CBCT image quality using NPS and MTF. J Appl Clin Med Phys. 2016;17:211–222. [DOI] [PMC free article] [PubMed] [Google Scholar]
- 27. Ohkubo M, Wada S, Matsumoto T, Nishizawa K. An effective method to verify line and point spread functions measured in computed tomography. Med Phys. 2006;33:2757–2764. [DOI] [PubMed] [Google Scholar]
- 28. Anam C, Fujibuchi T, Toyoda T, et al. A simple method for calibrating pixel values of the ct localizer radiograph for calculating water‐equivalent diameter and size‐specific dose estimate. Radiat Prot Dosim. 2018;179:158–168. [DOI] [PubMed] [Google Scholar]
- 29. Anam C, Haryanto F, Widita R, Arif I, Dougherty G. Automated calculation of water‐equivalent diameter (DW) based on AAPM task group 220. J Appl Clin Med Phys. 2016;17:320–333. [DOI] [PMC free article] [PubMed] [Google Scholar]
- 30. Anam C, Haryanto F, Widita R, Arif I, Dougherty G, McLean D. The impact of patient table on size‐specific dose estimate (SSDE). Australas Phys Eng Sci Med. 2017a;40:153–158. [DOI] [PubMed] [Google Scholar]
- 31. Narváez M, Graffigna JP, Gómez ME, Romo R. Application of oversampling to obtain the MTF of digital radiology equipment. J Phys Conf Ser. 2016;705:012057. [Google Scholar]
- 32. González‐López A. Effect of noise on MTF calculations using different phantoms. Med Phys. 2018;45:1889–1898. [DOI] [PubMed] [Google Scholar]
- 33. Anam C, Haryanto F, Widita R, Arif I, Dougherty G. The size‐specific dose estimate (SSDE) for truncated computed tomography images. Radiat Prot Dosim. 2017b;175:313–320. [DOI] [PubMed] [Google Scholar]
- 34. Hassan B, Metska M, Ozok A, Van der Stelt P, Wesselink P. Comparison of five cone beam computed tomography systems for the detection of vertical root fractures. J Endod. 2010;36:126–129. [DOI] [PubMed] [Google Scholar]
- 35. Fakhar HB, Mallahi M, Panjnoush M, Kashani PM. Effect of voxel size and object location in the field of view on detection of bone defects in cone beam computed tomography. J Dent (Tehran). 2016;13:279–286. [PMC free article] [PubMed] [Google Scholar]
Associated Data
This section collects any data citations, data availability statements, or supplementary materials included in this article.
Supplementary Materials
Data S1. Codes of the automated MTF calculation.


