Abstract
Hepatitis C virus (HCV) currently affects several million people across the globe. One of the major classes of drugs against HCV inhibits the NS3/4A protease of the polyprotein chain. Efficacy of these drugs is severely limited due to the high mutation rate that results in several genetically related quasispecies. The molecular mechanism of drug resistance is frequently deduced from structural studies and binding free energies. However, prediction of new mutations requires the evaluation of both binding free energy of the drug as well as the parameters (κcat and KM) for the natural substrate. The vitality values offer a good approach to investigate and predict mutations that render resistance to the inhibitor. A successful mutation should only affect the binding of the drug and not the catalytic activity and binding of the natural substrate. In this article, we have calculated the vitality values for four known drug inhibitors that are either currently in use or in clinical trials, evaluating binding free energies by the relevant PDLD/S-LRA method and activation barriers by the EVB method. The molecular details pertaining to resistance are also discussed. We show that our calculations are able to reproduce the catalytic effects and binding free energies in a good agreement with the corresponding observed values. Importantly, previous computational approaches have not been able to achieve this task. The trend for the vitality values is in accordance with experimental findings. Finally, we calculate the vitality values for mutations that have either not been studied experimentally or reported for some inhibitors.
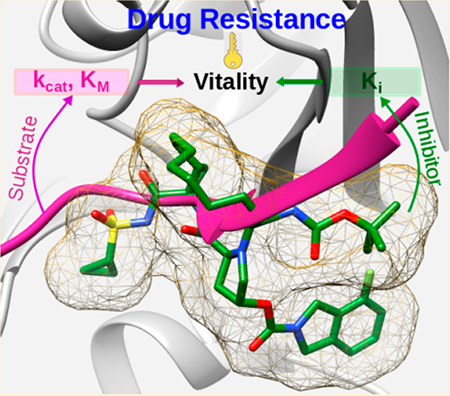
Graphical Abstract
INTRODUCTION
Liver disease caused by the infection of hepatitis C virus (HCV) is a serious problem that currently affects approximately 180 million people worldwide.1–4 HCV translates its genetic information to form a polyprotein with around 3000 amino acids which consists of four structural proteins—C, E1, E2, and p7—and six nonstructural proteins—NS2, NS3, NS4A, NS4B, NS5A, and NS5B.5,6 Drugs that are currently used to inhibit HCV replication target three viral proteins; NS3/4A (protease), NS5B (RNA dependent RNA−polymerase) and NS5A (phosphoprotein).7 A recent drug, Epclusa, approved by the FDA for the treatment of all genotypes of HCV, is administered as a combination of sofosbuvir (NS5B inhibitor) and velpatasvir (NS5A inhibitor) along with ribavarin (nucleoside inhibitor). NS3 is a bifunctional protein comprising of a C-terminal helicase domain and an N-terminal protease domain.8 The protease domain cleaves the viral protein at four junctions (3−4A, NS4A−NS4B, NS4B−NS5A, and NS5A−NS5B) and its enzymatic activities are modulated by the NS4A cofactor. Representative mechanism of the NS3/4A protein, which is generally similar to that of proteases, is depicted in Scheme 1. The reaction begins with the proton abstraction by His57 from Ser139, which is proceeded by the nucleophilic attack of the deprotonated Ser139 on the carbonyl group. These two steps can also occur in a concerted manner. The final step involves the cleavage of the CO−NH amide bond and a simultaneous proton transfer from protonated His57 to the departing NH group. The processing by the protease is absolutely essential for viral replication and thus its inhibition serves as an attractive area of research in other viral proteins such as HIV, dengue, etc. All the various drugs against HCV that are either approved (telaprevir, boceprevir, paritaprevir, simeprevir, and grazoprevir) or in the clinical trial phase (asunaprevir, vaniprevir, danoprevir, sovaprevir, etc.), target the serine protease.
Scheme 1.
Mechanism of Peptide Hydrolysis by NS3/4A Serine Protease
While the development of protease inhibitors since the use of the first inhibitor (ciluprevir) has been impressive,9 there are still several challenges that need to be addressed to design effective drugs against all genotypes. HCV has a high mutation rate that results in the formation of quasispecies that are genetically different but constitutes related variants. The ease of mutations not only renders several drugs ineffective, but also poses a great challenge in developing a single efficient inhibitor.10,11 While some of the mutations are specific to a particular drug, the problem is further aggravated by those mutations that affect a range of drugs rendering them ineffective over a course of time. In several cases, resistance is observed only within a few days of treatment resulting in a loss of several years of effort. Thus, the current challenge is to develop drugs that can retain their efficacy not only against one variant but several of them and obstruct the development of resistance.12,13 This requires a detailed understanding of factors that affect the binding of the drug without affecting the interaction with the natural substrate.
Different approaches have been used to study the mutations that render resistance to the drug.14 Schiffer and co-workers have investigated the molecular basis for resistance in several inhibitors using the substrate envelope approach.15−17 This approach focused on the interaction of the drug with other residues that protrude away from the substrate envelope and affect the binding especially in the case of mutants. Such residues are assumed to affect only the binding of the drug and not of the substrate, thereby rendering the drug ineffective against the mutations. Another approach used by different groups involves the decomposition of binding free energies and identifying residues that have a major contribution.18−22 In most of these studies, the calculated binding free energies show an enormous deviation from the experimental values. Moreover, the study of binding energies alone does not provide a complete understanding of drug resistance. An effective approach toward the drug resistance problem seems to be offered by considering the so-called “vitality” that gives the correlation between the catalytic efficiency of a key enzyme of the pathogen (kcat/KM) and the corresponding inhibition (Ki).23 A successful mutation for the pathogen would be the one that exhibits a minimal change in kcat/KM with respect to the wild-type (WT), thereby not decreasing its enzymatic activity. In other words, the pathogen should be able to retain its catalytic efficiency toward the natural substrate while simultaneously decreasing the binding energy of the inhibitor. We have previously used this approach to reproduce the vitality values for HIV-protease with several inhibitors including ritonavir, saquinavir, etc.24,25 The vitality value can be defined as:
| (1) |
Expressing it in terms of the drug and TS binding free energies of the mutant and WT leads to eq 2. More details can be found in the Supporting Information and ref 24
| (2) |
where WT and m represent the native and mutant protein, respectively.
In deriving eq 2 we used the fact that kcat, KM, and Ki are related to the binding free energy as shown in the following equations:
| (3) |
| (4) |
| (5) |
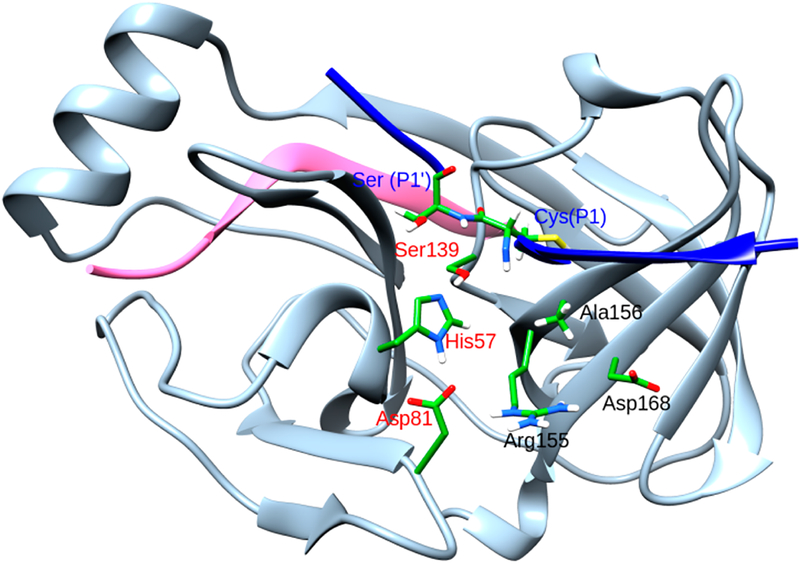
The crystal structures of the complex of the WT protein and the natural substrate, along with residues whose mutations are important, are shown in Figure 1. Generally two different mechanisms are proposed for drug resistance; direct resistance where the mutated residue has direct contacts with the inhibitor and indirect resistance where the inhibitor does not interact directly with the mutated residue. Previous studies based on molecular dynamics, binding free energies calculations and structural analyses have revealed similar factors responsible for drug resistance in mutated proteins.15,18,20 For instance, the R155Q mutation, results in loss of electrostatic interaction with D168, which consequently weakens its interactions with the P2 moiety of the inhibitor. A156T has a different effect as it results in steric interactions of the bulkier Thr with the inhibitor. D168A mutation leads to loss of electrostatic interactions with both R155 and R123, resulting in a cascading effect that weakens the interactions of R155 with the inhibitor. It should be noted that for different inhibitors, structural variations (aromatic moiety at P2 position or, presence of a macrocyclic ring etc.) may result in varying interactions with the protein. Thus, each of these inhibitors will not induce the same degree of resistance against different mutations.
Figure 1.
Crystal structure of NS3/4A protease. The 4A cofactor is shown in pink, the P6P4′ substrate in blue, and NS3 in gray. The catalytic residues are shown in red whereas the substrate residues at the peptide cleavage site are shown in blue. Important mutations that confer resistance to drugs are shown in black.
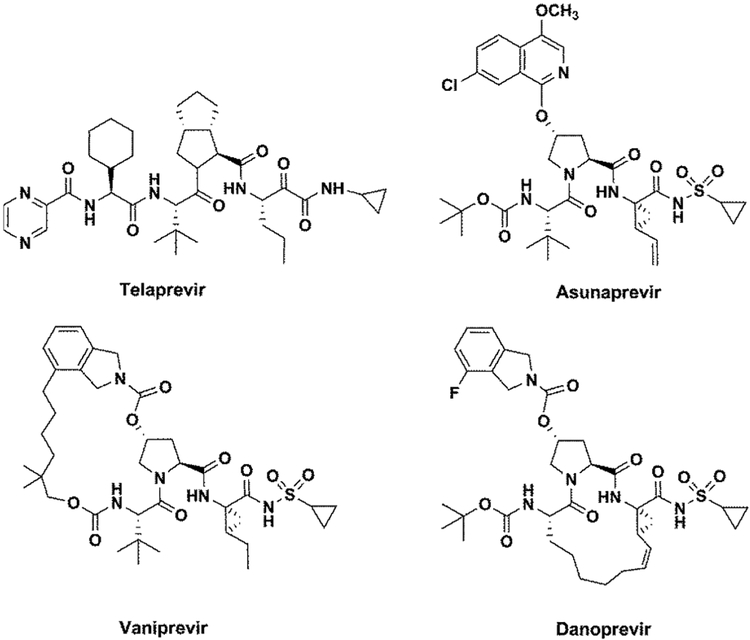
In our approach, we first calculated the activation barriers that determine kcat, using our empirical valence bond (EVB) method for the WT and the mutants with the native substrate. This was followed by the estimation of binding free energies of four protease inhibitors (telaprevir, danoprevir, vaniprevir, and asunaprevir) which are shown in Figure 2, with both native and mutant proteins. The vitality values were then evaluated for mutations that are known to result in drug resistance.
Figure 2.
Inhibitors of NS3/4A protease investigated in the current study.
COMPUTATIONAL METHODS
To begin our calculations we took the crystal structure of the apo protein (pdb code: 1DXP)26 in a dimeric form, bound to an inhibitor. Because of the absence of a crystal structure for NS3/4A protease with the substrate, we generated the protein substrate complex adopting the approach used earlier by Martinez and co-workers.27 The coordinates of a monomeric unit without the inhibitor were taken for further studies. To build the substrate that corresponds to the NS5A/NS5B junction, the catalytic residues (His57, Ser139, and D81) were aligned with the residues of chymotrypsin (1ACB). The crystal structure of chymotrypsin is bound to an eglin c substrate from which the P6−P4′ segment (GSPVTLDLRY) was taken and modeled into the active site of 1DXP. The P6−P4′ sequence from the NS5A/5B is EDVVCCSMSY and therefore the sequence obtained from the eglin c substrate was mutated to get the right sequence. This was followed by energy minimization of the substrate, while constraining the rest of the protein and the corresponding structure was used for all further calculations. It should be noted that proper positioning of the substrate in the active site is an important factor. However, sufficient relaxation and comparison to protein-inhibitor complexes ensures that the effect on calculated barriers and binding free energies is minimized. Standard conditions (T = 300 K) were used for the calculations of activation free energies and binding free energies.
Empirical Valence Bond (EVB) Calculations.
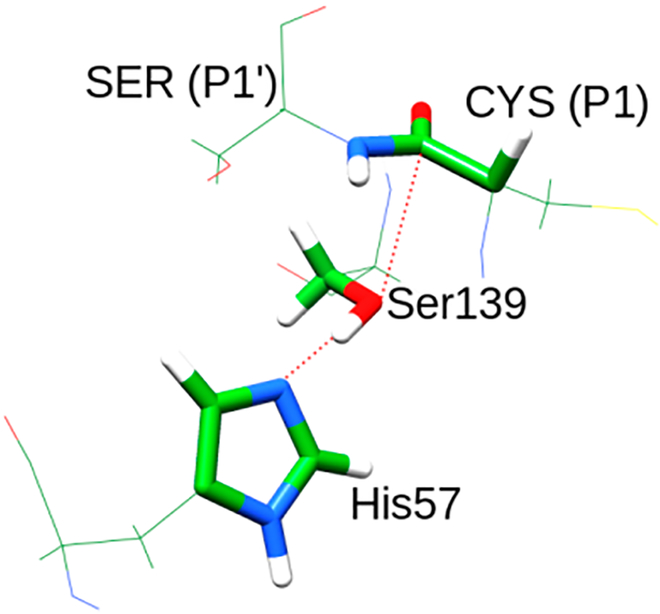
We started by simulating the mechanism for the reaction of NS3/4A protease, shown in Scheme 1. This was done using our EVB approach28−30 and the corresponding energies were calculated using the FEP/US sampling.31 The calculations were performed using MOLARIS software with the polarizable ENZYMIX force field.32 The electrostatic potential charges (ESP) charges for the two diabatic states that represent the reactant and product were calculated according to the Merz− Singh−Kollman scheme33,34 using the B3LYP level of theory at the 6–311+G** basis set with Gaussian09 software.35 The EVB region shown in Figure 3 was treated as the center of the system which was immersed in an 18 Å water sphere using the surface constrained all atom solvent (SCAAS) model.36 The local reaction field (LRF) was used to treat the long-range effects.37 All water molecules were generated using MOLARIS. The protonation states of the ionizable residues were determined by calculating the pKa using our CG (coarse grained) MCPT (Monte Carlo proton transfer) module in MOLARIS. Further, residues that lie within 10 Å from the center of the EVB region were kept in their ionization state and included in the EVB calculations. The corresponding effect of the distant ionizable residues was determined using a large dielectric constant. We began our simulations by first relaxing the system using slow heating from 30 to 300 K for around 100 ps using a time step of 1 fs. Three different staring structures were generated from this relaxation and were further used for the FEP simulation which involved 41 frames where each frame was simulated for 30 ps with a time step of 1 fs. The mutants were generated using MOLARIS and a similar method of relaxation was performed before carrying out the EVB simulations. The reaction was first simulated in solution phase to calibrate the EVB parameters. The activation barriers needed for calibrating the energetics of the reaction in water were taken from a previous very careful ab initio.38 The specific EVB parameters and further details regarding the EVB approach used for the simulation are provided in the Supporting Information. Molecular graphics images were constructed using UCSF Chimera package 1.10.2.39
Figure 3.
Residues included in the EVB region. The atoms included are shown in sticks. The peptide bond between Ser(P1′) and Cys(P1) is cleaved in the second step.
Binding Free Energy Calculations.
The binding free energies were calculated using the Protein Dipole Langevin Dipole method within its semimacroscopic-linear response approximation (PDLD/S-LRA)40,41 with the LIE non polar term (PDLD/S-LRA/β).42 In the simulation system, the water molecules except those that are treated explicitly are replaced by Langevin dipoles. This method has been previously established to give a reliable estimation of the binding free energies. These calculations were performed using the POLARIS module in MOLARIS.40
We started our calculations by taking the initial coordinates from RCSB protein data bank for danoprevir (PDB codes 3M5L,15 3SU2,43 3SU1,43 3SU043); telaprevir (PDB code 3SV6, 3SV9, 3SV8, 3SV7);43 vaniprevir (PDB code 3SU3, 3SU6, 3SU5, 3SU4)43 bound to the WT, A156T, D168A, and R155K mutant of NS3/4A protease, respectively. For asunaprevir ligand, the crystal structure was only found for the WT (4WF8) and one of the mutants: R155K(4WH6).16 The substrate−protein complexes were generated using the protocol as described above for the EVB calculations. For all other mutations, structures were generated using the UCSF Chimera 1.10.2.39 The rotamer conformations were taken from Dunbrack Rotamer library44 and the conformation with highest probability was selected. We further checked clashes/contacts between the mutated residue and rest of the protein to remove the clashes by manual dihedral rotation. The missing residues in the initial structure file were generated using Modeller-9.16.45 The crystal water molecules and other ions except Zn2+ were removed before molecular dynamics relaxation. All hydrogen atoms and water molecules were generated using MOLARIS. The ESP charges for the ligands were determined using the protocol described above. Furthermore, restrained electrostatic potential method (RESP) was used to obtain more reliable partial charges.46 The RESP calculations were performed by using the antechamber program of AmberTools16.47 The initial structures were equilibrated using a similar approach as described above for EVB runs.
In order to obtain reliable binding results, it is important to consider realistic configurations of the water molecules. For instance, this is important in studies of ligand-binding, selective ion transport in ion channels, proton transportation in membrane proteins, and pKa calculations for deeply buried residues depend strongly on the water penetrations. Here we use our powerful water flooding technique that has already been proven to be effective in challenging cases.48
In this approach, we generate many trial configurations with excess number of internal waters and calculate the electrostatic energies of the structural waters using the LRA method. Subsequently, we run a post processing Monte Carlo (MC) to select the minimum energy configuration with the right number of internal waters. The free energy of insertion for the mth generated configuration is calculated using the following equations:
| (6) |
where the function δi(m) represents the occupancy of the water sites in the current mth configuration. δi(m) is 1 when the ith site is occupied and zero otherwise. w and p, represent water and protein, respectively. represents the interaction between the water molecules at the ith and jth sites and is the change in free energy of system on moving a water molecule from water to protein. The terms in eq 6 are given by
| (7) |
| (8) |
Uiq and Ui0 denote the total solvation energy (self-energy) of the ith water molecule and the subscript q denotes the charge distribution on atoms of a water molecule. The angular bracket denotes the ensemble average obtained by propagating trajectories over the polar state of the water. The first term in eq 7 is calculated by the linear response approximation (LRA) electrostatic term,41 while the second term is the linear interaction energy (LIE) approximation9,41,49 for the non polar contribution for the water insertion energy. eq 8 denotes the total pairwise interaction energy between all ith and jth pair of water molecules, where Uijq is the pairwise interaction energy between a pair of i−j and q corresponds to the charge on the atoms of water. The last term in eq 8 denotes the pairwise term of nonpolar interaction energy. In principle we can use instead of the LIE, the very expensive free energy perturbation (FEP) calculation, where the nonpolar water molecule has to be converted to dummy atoms to compute the energies (see ref 41), in order to obtain the free energy of creating a cavity for a particular water molecule. This free energy term is similar to the nonpolar contribution to binding free energy for drug− protein complex, where in the former case it resembles a cavity-water complex. It has already been shown (e.g., ref 50) that LRA is a very reasonable approximation for FEP in the calculation of the polar part of the water “uncharging” free energy. Thus, we believe that in the present case (when the non polar contribution is small) the LIE+LRA should be a good approximation.
After calculating the above energy terms for all water molecules, a MC selection procedure was run to select the lowest energy configuration (see Figure 5 of ref 48). The final structures obtained from water flooding calculations were used to calculate binding energies.
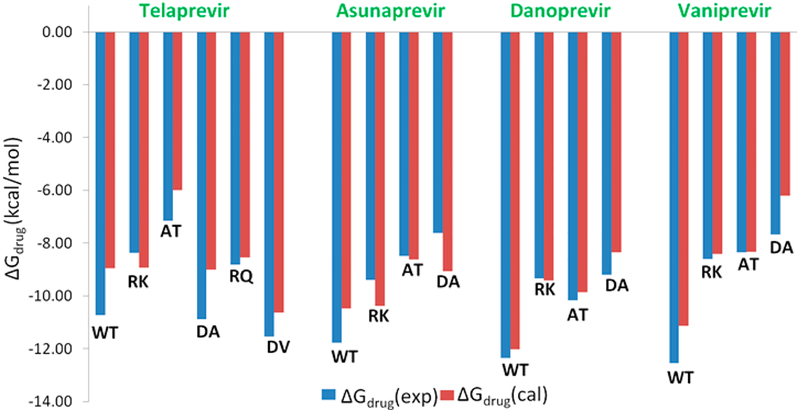
Figure 5.
Comparison of observed and calculated binding free energies.
RESULTS AND DISCUSSION
In the initial step of the calculations we evaluated the activation free energies of the enzymatic reaction considering the mechanism shown in Scheme 1. This mechanism is reminiscent of serine proteases and is studied using EVB simulations.38,51−53 The catalytic triad comprises of Ser139, His57, and Asp81 as shown in Figure 1. The mechanism for the peptide bond hydrolysis can be considered as involving two different steps; formation of the tetrahedral intermediate and cleavage of the peptide bond. Further, the nucleophilic attack involves a proton transfer from Ser139 to His57 resulting in the formation of a deprotonated Ser139 which subsequently attacks the carbonyl carbon leading to the tetrahedral intermediate. This is followed by collapse of the tetrahedral intermediate that involves cleavage of the peptide bond to yield the final products.
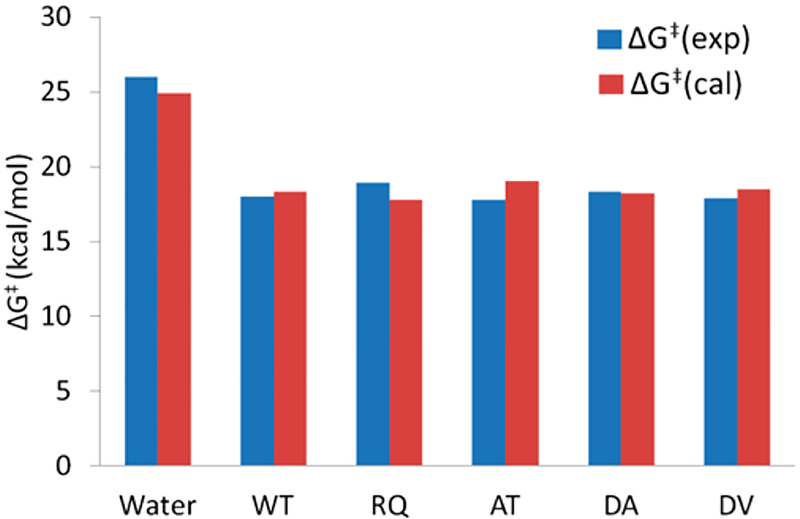
The formation of the tetrahedral intermediate is usually regarded as the rate-determining step and therefore we have primarily focused on the nucleophilic step as a two-step process. In a recent study, both nucleophilic attack and the cleavage of the peptide bond in the tetrahedral intermediate were proposed to occur in a concerted manner.27 However, in the present case, we are interested in the relative energies of the mutants with respect to the WT and therefore consideration of the stepwise pathway is sufficient. The reaction is also modeled in water to calibrate the EVB surface in protein. The stepwise mechanism is able to reproduce the experimental values54,55 in good agreement (Figure 4) and therefore provides credence to our calculations.
Figure 4.
Comparison of observed and calculated activation free energies.
It should be noted that the controversy regarding stepwise vs concerted mechanisms in serine proteases is far from solved. Subtle changes in the environment of the active site might lead to different results and in the current article; we do not intend to pursue this, although our calibration is based on arguably the most careful study.38 The results for all the mutants and WT are given in Table 1 and it can be seen that the free energy of activation does not change appreciably on moving from the WT to mutants which is consistent with the trend observed in the experimental values.
Table 1.
Activation Free Energies (kcal/mol) for Different Systemsa
Next, we determined the binding free energies of the natural substrate to the WT and the mutant proteins. It can be clearly seen from Table 2 that the calculated energies correlate well with the experimental binding free energies. Additionally, as expected the binding free energies for the mutants do not differ significantly in comparison to the WT protein. Thus, these mutations do not affect the substrate binding and therefore when the drug becomes resistant to the mutated protein, the enzyme continues to function with its natural substrate.
Table 2.
Observed and Calculated kcat (s−1) and KM (M) Value for Substrate-Protein Complexesa
| mutation | kcat(obs) | kcat(cal) | KM(obs) | KM(cal) | (kcat/Km) (obs) | (kcat/Km) (cal) |
|---|---|---|---|---|---|---|
| WT | 0.53 | 0.29 | 2.7 × 10⁻⁷ | 1.03 × 10⁻⁷ | 1.9 × 10⁶ | 2.82 × 10⁶ |
| R155K | – | 0.29 | 8.5 × 10⁻⁷ | 1.08 × 10⁻⁷ | – | 2.68 × 10⁶ |
| R155Q | 0.1 | 0.67 | 8.5 × 10⁻⁷ | 2.77 × 10⁻⁷ | 1.18 × 10⁵ | 2.43 × 10⁶ |
| A156T | 0.74 | 0.09 | 3.2 × 10⁻⁷ | 5.52 × 10⁻⁷ | 2.3 × 10⁶ | 1.63 × 10⁵ |
| D168A | 0.3 | 0.34 | 2.0 × 10⁻⁶ | 6.75 × 10⁻⁷ | 1.5 × 10⁵ | 5.10 × 10⁵ |
| D168V | 0.55 | 0.21 | 2.0 × 10⁻⁷ | 2.81 × 10⁻⁶ | 2.8 × 10⁶ | 7.40 × 10⁴ |
In the next step we moved on to the calculations of the binding free energies of the drugs when bound to the WT and its mutants (Table 3). As can be seen from Figure 5, the binding free energies are in good agreement with the experimental values.54,56 Though our calculations yield values that are reasonably good, certain subtle effects that can further reduce the error can only be captured by using extensive and computationally expensive methods such as the FEP method. It should be noted that earlier studies for HCV protease were not able to reproduce the experimental observations even in a qualitative agreement.18,19 In these studies, the popular molecular mechanics PB surface area (MM/PBSA) model and the related molecular mechanics-generalized Born surface area (MM/GBSA) were used. These models are apparently an inconsistent adaptation of the earlier PDLD/S-LRA idea of MD generated configurations for implicit solvent calculations, calculating the average over the configurations generated with the charged solute alone. More importantly, these models use εp = 1 without sufficient relaxation, which results in an overestimation of the interaction between ionized groups. It also uses a vdW term that compensates for error in other terms (see ref 42 for a detailed analysis).
Table 3.
Calculated and Observed Binding Free Energies (kcal/mol) of Protease Inhibitorsa
| Drug | mutation | ΔGdrug(obs) | ΔGdrug(cal) |
|---|---|---|---|
| telaprevir | WT | −10.74 | −8.96 |
| R155K | −8.37 | −8.93 | |
| A156T | −7.16 | −6.00 | |
| D168A | −10.89 | −9.00 | |
| R155Q. | −8.81 | −8.54 | |
| D168V | −11.54 | −10.63 | |
| asunaprevir | WT | −11.77 | −10.47 |
| R55K | −9.39 | −10.38 | |
| A156T | −8.49 | −8.63 | |
| D168A | −7.62 | −9.07 | |
| danoprevir | WT | −12.35 | −12.02 |
| R155K | −9.34 | −9.41 | |
| A156T | −10.17 | −8.59 | |
| D168A | −9.20 | −8.36 | |
| vaniprevirb | WT | −12.55 | −11.14 |
| R155K | −8.60 | −8.41 | |
| A156T | −8.35 | −8.34 | |
| D168A | −7.68 | −6.21 |
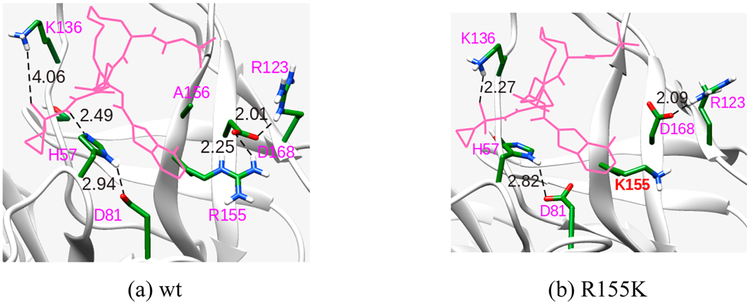
The conformations obtained from our binding energy calculations show that R155 is in close proximity to D168 and can form a strong ion-pair interaction as shown in Figure 6(a) for danoprevir. These interactions can also extend to D81 and R123 depending upon their suitable orientation. For instance, in the case of danoprevir inhibitor, the orientation of D168 further allows for an additional interaction with R123. This ion-pair interaction (D168−R123) becomes more prominent when R155 is mutated to LYS or GLN a shown in Figure 6(b).
Figure 6.
Interaction of important residues that confer resistance to binding of danoprevir to the (a) WT protease and (b) R155K mutant. Distances are in Å.
In some cases, ionization of a specific residue affects the internal water environment and as a consequence, the calculated binding free energy. For instance, we have seen that K136 as shown in Figure 6a has a considerable effect on the binding of asunaprevir, danoprevir, and vaniprevir inhibitors. The probable reason can be due to the orientation of the side chain toward the acyl sulfonamide group of the inhibitors. Previous reports have suggested H-bonding interactions with the oxygen of the sulphonamide group.57 Ionizing K136 has a pronounced effect on the binding free energy of the drugs with the WT protease. In the un-ionized form, the energy increases by 1.5 kcal/mol. In the case of substrate−protein complex, it was observed that the ionization of residue R123 has a significant effect on the binding free energy. It interacts with a conserved Glu residue at the P6 position of the substrate group. Interestingly, the ionization of this residue has no effect on drug−protein binding.
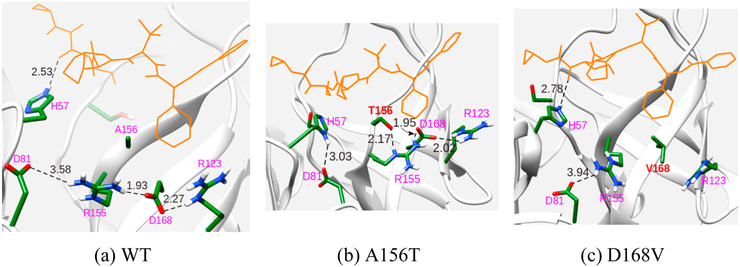
We also looked at the group contributions of the residues involved in the binding of the substrate and the inhibitors for WT and the mutants. An interesting feature that emerges is the contribution of H57 as a residue that has a positive effect on binding free energy for all systems except in the case of inhibitor telaprevir. Specifically, the contribution of H57 in R155Q and A156T shows a negative effect, implying that these mutations result in a weaker binding of H57 with the inhibitor. The α-ketoamide group in telaprevir makes hydrogen bonding interaction with H57 as shown in Figure 7(a) (2.53 Å) and the interaction energy decreases with above-mentioned mutations (Figure 7b). The importance of D168 in all inhibitors except telaprevir is clearly seen by a decrease in the binding free energies with D168A and D168V mutations. In the case of telaprevir, the effect of H57 is found to have a positive effect on the drug binding for D168V/A mutation by retaining its H-bond (Figure 7c, 2.78 Å) with α-ketoamide group. Thus, it can be concluded that H57 plays an extremely important role in the binding of telaprevir.
Figure 7.
Interaction of important residues that confer resistance to telaprevir binding to the (a) WT protease, (b) A156T mutant, and (c) D168V mutant. Distances are in Å.
In the wild type vaniprevir−protein complex, water mediated H-bonding between Asp168 and Arg155 is observed which leads to a few structural changes. Arg155 moves closer to Asp81, and Asp168 moves toward Arg123. The water mediated hydrogen bonding network extends up to His57 which also forms a H-bond with the NH group of the sulphonamide group of the inhibitor as shown in Figure 8a. Thus, we observe remarkably high binding affinity of vaniprevir to WT protein. In the case of A156T mutation, Arg155 group moves away from the isoindole group of the inhibitor and partially loses its interaction. Because of this mutation, the Arg155−Asp81 interaction is weakened and the overall water mediated hydrogen bonding network is disrupted (Figure 8b). Surprisingly, for the D168A mutation, Arg155 forms water mediated hydrogen bonding with Asp81, instead of a direct H-bond. The lower bulk of alanine in the D168A mutant probably allows R155 to retain the interaction with the isoindole group of vaniprevir (Figure 8c). However, the loss in H-bonding interaction with R123 and R155 results in a weaker binding.
Figure 8.
Interaction of important residues that confer resistance to vaniprevir binding to the (a) WT protease, (b) A156T mutant, and (c) D168A mutant. Distances are in Å.
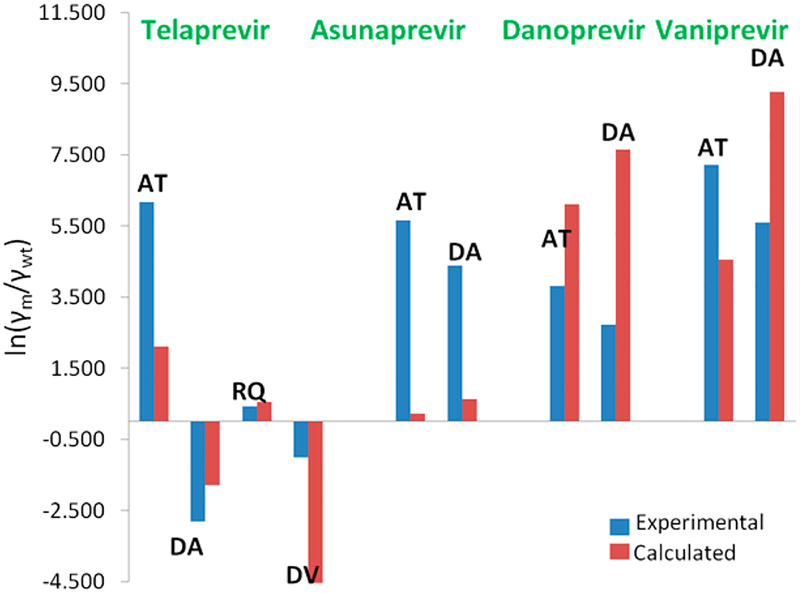
Encouraged by the above findings, we calculated the vitality values using our calculated kcat, KM and Ki values and substituting them in eqs 1 and 2. The trends observed are consistent with experiments and our approach successfully reproduces the vitality values (Table 4 and Figure 9).
Table 4.
Calculated and Observed Vitality Values for Protease Inhibitors for WT and Mutant HCV Protease with Relative Binding Free Energies in kcal/mol
| inhibitors | ΔΔGdrug(obs) | ΔΔGdrug(cal) | ΔΔGTS(obs) | ΔΔGTS(cal) | ln(γm/γn) (obs) | ln(γm/γn) (cal) | |
|---|---|---|---|---|---|---|---|
| telaprevir | WT | – | – | – | – | – | – |
| R155K | 2.37 | 0.03 | –i | 0.03 | i | 0.0 | |
| A156T | 3.58 | 2.96 | −0.10 | 1.70 | 6.17 | 2.11 | |
| D168A | −0.15 | −0.04 | 1.53 | 1.02 | −2.82 | −1.78 | |
| R155Q. | 1.93 | 0.42 | 1.68 | 0.09 | 0.42 | 0.55 | |
| D168V | −0.80 | −1.67 | −0.20 | 2.17 | −1.01 | −6.44 | |
| asunaprevir | WT | – | – | – | – | – | – |
| R155K | 2.37 | 0.09 | – | −4.19 | – | 0.10 | |
| A156T | 3.28 | 1.84 | −0.10 | 1.70 | 5.66 | 0.23 | |
| D168A | 4.15 | 1.40 | 1.53 | 1.02 | 4.38 | 0.64 | |
| danoprevir | WT | – | – | – | – | – | – |
| R155K | 3.02 | 2.61 | i | −1.89 | i | 7.55 | |
| A156T | 2.18 | 3.43 | −0.10 | −0.22 | 3.82 | 6.12 | |
| D168A | 3.16 | 3.66 | 1.53 | −0.90 | 2.72 | 7.65 | |
| vaniprevir | WT | – | – | – | – | – | – |
| R155K | 3.95 | 2.73 | i | −1.59 | i | 7.25 | |
| A156T | 4.20 | 2.80 | −0.10 | 0.08 | 7.21 | 4.56 | |
| D168A | 4.87 | 4.93 | 1.53 | −0.60 | 5.59 | 9.28 |
Observed values not known.
Figure 9.
Comparison of observed and calculated vitality values relative to the WT (AT = A156T, DA = A168A, RQ = R155Q, DV = D168V).
Furthermore, we studied three additional mutations (S138T, Q41R, and F43V) that can confer resistance to binding for drugs that are currently in clinical trials (asunaprevir, danoprevir, and vaniprevir). Although some of these mutations have been previously suggested for a few inhibitors (telaprevir and danoprevir),58−60 the lack of KM and kcat values prompted us to investigate them using the vitality approach. Some interesting trends emerge from this study (Tables 5 and 6). For instance, mutation of residue S138, which is very close to the catalytic site, does not seem to affect the kcat and KM with respect to the WT (Table 5). Additionally, according to our calculations this mutation will result in resistance against asunaprevir and vaniprevir. Previous experiments have shown it to be resistant against danoprevir as well.60 The Q41R mutation does not seem to affect asunaprevir binding. F43V is a borderline case as seen from binding for all drugs and previous studies have shown that it marginally affects the binding of danoprevir and telaprevir.58,60 Several groups have delineated the mechanism of action of these inhibitors and their resistance to certain mutations. However, prediction of mutations that will confer drug resistance requires a systematic study of both the catalytic mechanism and the binding free energies.
Table 5.
Calculated Activation Free Energies (kcal/mol) and Binding Free Energies (kcal/mol) for Additional Mutants
| system | ΔG‡ (kcal/mol) | kcat (s−1) | KM(M) |
|---|---|---|---|
| WT | 18.3 | 0.29 | 1.03 × 10⁻⁷ |
| S138T | 18.2 | 0.34 | 3.41 × 10⁻⁸ |
| Q41R | 17.7 | 0.80 | 5.14 × 10⁻⁶ |
| F43V | 18.2 | 0.34 | 2.68 × 10⁻⁷ |
Table 6.
Binding Free Energies (kcal/mol) and Vitality Values for Different Inhibitors
| system | ΔGbind (kcal/mol) |
ΔΔGbind (kcal/mol) |
ln(γm/γn) | |
|---|---|---|---|---|
| asunaprevir | WT | −10.47 | – | – |
| S138T | −8.55 | 1.92 | 4.50 | |
| Q41R | −12.45 | −1.98 | −6.22 | |
| F43V | −10.96 | −0.49 | −1.61 | |
| danoprevir | WT | −12.35 | – | – |
| S138T | −10.29 | 1.73 | 4.18 | |
| Q41R | −8.20 | 3.82 | 3.51 | |
| F43V | −10.96 | 1.75 | 2.15 | |
| vaniprevir | WT | −11.14 | – | – |
| S138T | −10.08 | 1.06 | 3.05 | |
| Q41R | −8.72 | 2.42 | 1.16 | |
| F43V | −11.22 | −0.08 | −0.92 |
In this present study we have shown that the vitality values can provide a good start to predict mutations. To illustrate our approach, we successfully calculated the vitality values that are found to be in good agreement with the relevant experimental values.
CONCLUDING REMARKS
Our approach for the calculation of activation barriers, binding free energies and vitality values not only reproduces experimental trends, but provides a fast way to evaluate these quantities. A typical EVB calculation takes around 31 h and binding free energy takes 20 h on an Intel Xeon (R) based compute node E5-2670v3 equipped with 16 GB RAM using a single processor. Furthermore, calculations for different mutations and inhibitors can be done simultaneously. The EVB calculations are probably as reliable as they can be, but the binding calculations may eventually be improved by FEP calculations, although at present such calculations are not giving better results than the PDLD/S-LRA/β approach for absolute binding free energies.
Our overall goal is to devise suitable methods to predict mutations that can confer drug resistance. A seemingly simple approach would be to look at the electrostatic group contributions of individual residues when the drug binds to the wild type protein. However, this approach is not reliable enough and can only be used in a very preliminary screening. The subsequent screening is clearly far more challenging For example, our recent study61 indicated that catalytic effects can involve not only the residues that are involved in the electrostatic preorganization but also residues that lead to the preorganization of the catalytic residues. This means that we may have to consider not only one mutation at a time but also pair of mutations. Thus, we might have to turn to some random search approach on many computer nodes and also combine the search with bioinformatics and other constraints. However, it is very encouraging that we could reproduce the observed vitality for cases when the drug resistance mutations are known.
Supplementary Material
ACKNOWLEDGMENTS
This work was supported by Grant GM024492 from the National Institutes of Health (NIH). We also gratefully acknowledge the University of Southern California’s High Performance Computing and Communication Center (HPCC) for computer time. G.J. and D.M. acknowledge Dr. Veselin Kolev and Dr. Mikolaj Feliks for the preparation of the protein−substrate complex and effective generation of starting input files.
Footnotes
Supporting Information
The Supporting Information is available free of charge on the ACS Publications website at DOI: 10.1021/acs.jpcb.7b04562.
Details of the EVB method, binding free energy calculations, water flooding approach, vitality calculations, and parameters used for simulations (PDF)
The authors declare no competing financial interest.
REFERENCES
- (1).Perz JF; Armstrong GL; Farrington LA; Hutin YJ; Bell BP The Contributions of Hepatitis B Virus and Hepatitis C Virus Infections to Cirrhosis and Primary Liver Cancer Worldwide. J. Hepatol 2006, 45, 529–538. [DOI] [PubMed] [Google Scholar]
- (2).Mohd Hanafiah K; Groeger J; Flaxman AD; Wiersma ST Global Epidemiology of Hepatitis C Virus Infection: New Estimates of Age-Specific Antibody to HCV Seroprevalence. Hepatology 2013, 57, 1333–1342. [DOI] [PubMed] [Google Scholar]
- (3).Modi A; Liang T Hepatitis C: A Clinical Review. Oral Dis 2008, 14, 10–14. [DOI] [PMC free article] [PubMed] [Google Scholar]
- (4).Alter MJ Epidemiology of Hepatitis C Virus Infection. World J. Gastroenterol 2007, 13, 2436. [DOI] [PMC free article] [PubMed] [Google Scholar]
- (5).Major ME; Feinstone SM The Molecular Virology of Hepatitis C. Hepatology 1997, 25, 1527–1538. [DOI] [PubMed] [Google Scholar]
- (6).Drazan K Molecular Biology of Hepatitis C Infection. Liver Transpl 2000, 6, 396–406. [DOI] [PubMed] [Google Scholar]
- (7).Götte M; Feld JJ Direct-Acting Antiviral Agents for Hepatitis C: Structural and Mechanistic Insights. Nat. Rev. Gastroenterol. Hepatol 2016, 13, 338–351. [DOI] [PubMed] [Google Scholar]
- (8).Raney KD; Sharma SD; Moustafa IM; Cameron CE Hepatitis C Virus Non-Structural Protein 3 (HCV NS3): A Multifunctional Antiviral Target. J. Biol. Chem 2010, 285, 22725– 22731. [DOI] [PMC free article] [PubMed] [Google Scholar]
- (9).Lamarre D; Anderson PC; Bailey M; Beaulieu P; Bolger G; Bonneau P; Bös M; Cameron DR; Cartier M; Cordingley MG; et al. An NS3 Protease Inhibitor with Antiviral Effects in Humans Infected with Hepatitis C Virus. Nature 2003, 426, 186–189. [DOI] [PubMed] [Google Scholar]
- (10).Halfon P; Locarnini S Hepatitis C Virus Resistance to Protease Inhibitors. J. Hepatol 2011, 55, 192–206. [DOI] [PubMed] [Google Scholar]
- (11).Kuntzen T; Timm J; Berical A; Lennon N; Berlin AM; Young SK; Lee B; Heckerman D; Carlson J; Reyor LL; et al. Naturally Occurring Dominant Resistance Mutations to Hepatitis C Virus Protease and Polymerase Inhibitors in Treatment-Naive Patients. Hepatology 2008, 48, 1769–1778. [DOI] [PMC free article] [PubMed] [Google Scholar]
- (12).Ganesan A; Barakat K Applications of Computer-Aided Approaches in the Development of Hepatitis C Antiviral Agents. Expert Opin. Drug Discovery 2017, 12, 407–425. [DOI] [PubMed] [Google Scholar]
- (13).Kurt Yilmaz N; Swanstrom R; Schiffer CA Improving Viral Protease Inhibitors to Counter Drug Resistance. Trends Microbiol 2016, 24, 547–557. [DOI] [PMC free article] [PubMed] [Google Scholar]
- (14).Cao ZW; Han LY; Zheng CJ; Ji ZL; Chen X; Lin HH; Chen YZ Computer Prediction of Drug Resistance Mutations in Proteins. Drug Discovery Today 2005, 10, 521–529. [DOI] [PubMed] [Google Scholar]
- (15).Romano KP; Ali A; Royer WE; Schiffer CA Drug Resistance against HCV NS3/4A Inhibitors Is Defined by the Balance of Substrate Recognition Versus Inhibitor Binding. Proc. Natl. Acad. Sci. U. S. A 2010, 107, 20986–20991. [DOI] [PMC free article] [PubMed] [Google Scholar]
- (16).Soumana DI; Ali A; Schiffer CA Structural Analysis of Asunaprevir Resistance in HCV NS3/4A Protease. ACS Chem. Biol 2014, 9, 2485–2490. [DOI] [PMC free article] [PubMed] [Google Scholar]
- (17).Özen A; Sherman W; Schiffer CA Improving the Resistance Profile of Hepatitis C NS3/4A Inhibitors: Dynamic Substrate Envelope Guided Design. J. Chem. Theory Comput 2013, 9, 5693– 5705. [DOI] [PMC free article] [PubMed] [Google Scholar]
- (18).Pan D; Xue W; Zhang W; Liu H; Yao X Understanding the Drug Resistance Mechanism of Hepatitis C Virus NS3/4A to ITMN-191 Due to R155K, A156V, D168A/E Mutations: A Computational Study. Biochim. Biophys. Acta, Gen. Subj 2012, 1820, 1526– 1534. [DOI] [PubMed] [Google Scholar]
- (19).Xue W; Ban Y; Liu H; Yao X Computational Study on the Drug Resistance Mechanism against HCV NS3/4A Protease Inhibitors Vaniprevir and MK-5172 by the Combination Use of Molecular Dynamics Simulation, Residue Interaction Network, and Substrate Envelope Analysis. J. Chem. Inf. Model 2014, 54, 621–633. [DOI] [PubMed] [Google Scholar]
- (20).Hotiana HA; Haider MK Structural Modeling of Hcv NS3/4A Serine Protease Drug-Resistance Mutations Using End-Point Continuum Solvation and Side-Chain Flexibility Calculations. J. Chem. Inf. Model 2013, 53, 435–451. [DOI] [PubMed] [Google Scholar]
- (21).Guo Z; Prongay A; Tong X; Fischmann T; Bogen S; Velazquez F; Venkatraman S; Njoroge FG; Madison V Computational Study of the Effects of Mutations A156T, D168V, and D168Q on the Binding of Hcv Protease Inhibitors. J. Chem. Theory Comput 2006, 2, 1657–1663. [DOI] [PubMed] [Google Scholar]
- (22).Fu J; Wei J Molecular Dynamics Study on Drug Resistance Mechanism of HCV NS3/4A Protease Inhibitor: BI201335. Mol. Simul 2015, 41, 674–682. [Google Scholar]
- (23).Gulnik SV; Suvorov LI; Liu B; Yu B; Anderson B; Mitsuya H; Erickson JW Kinetic Characterization and Cross-Resistance Patterns of HIV-1 Protease Mutants Selected under Drug Pressure. Biochemistry 1995, 34, 9282–9287. [DOI] [PubMed] [Google Scholar]
- (24).Ishikita H; Warshel A Predicting Drug-Resistant Mutations of HIV Protease. Angew. Chem., Int. Ed 2008, 47, 697–700. [DOI] [PubMed] [Google Scholar]
- (25).Singh N; Frushicheva MP; Warshel A Validating the Vitality Strategy for Fighting Drug Resistance. Proteins: Struct., Funct., Genet 2012, 80, 1110–1122. [DOI] [PMC free article] [PubMed] [Google Scholar]
- (26).Di Marco S; Rizzi M; Volpari C; Walsh MA; Narjes F; Colarusso S; De Francesco R; Matassa VG; Sollazzo M Inhibition of the Hepatitis C Virus NS3/4A Protease the Crystal Structures of Two Protease-Inhibitor Complexes. J. Biol. Chem 2000, 275, 7152– 7157. [DOI] [PubMed] [Google Scholar]
- (27).Martínez-González JA; González M; Masgrau L; Martínez R Theoretical Study of the Free Energy Surface and Kinetics of the Hepatitis C Virus NS3/NS4A Serine Protease Reaction with the NS5A/5B Substrate. Does the Generally Accepted Tetrahedral Intermediate Really Exist? ACS Catal 2015, 5, 246–255. [Google Scholar]
- (28).Warshel A; Weiss RM An Empirical Valence Bond Approach for Comparing Reactions in Solutions and in Enzymes. J. Am. Chem. Soc 1980, 102, 6218–6226. [Google Scholar]
- (29).Kamerlin SC; Warshel A The EVB as a Quantitative Tool for Formulating Simulations and Analyzing Biological and Chemical Reactions. Faraday Discuss 2010, 145, 71–106. [DOI] [PMC free article] [PubMed] [Google Scholar]
- (30).Kamerlin SC; Warshel A The Empirical Valence Bond Model: Theory and Applications. Wiley Interdiscip. Rev.: Comput. Mol. Sci 2011, 1, 30–45. [Google Scholar]
- (31).Zwanzig RW High-Temperature Equation of State by a Perturbation Method. I. Nonpolar Gases. J. Chem. Phys 1954, 22, 1420–1426. [Google Scholar]
- (32).Warshel A, Chu ZT; Villa J; Strajbl M; Schutz CN; Shurki A; Vicatos S; Plotnikov NV; Schopf P Molaris-XG, v 9.15. University of Southern California: Los Angeles, 2012. [Google Scholar]
- (33).Singh UC; Kollman PA An Approach to Computing Electrostatic Charges for Molecules. J. Comput. Chem 1984, 5, 129– 145. [Google Scholar]
- (34).Besler BH; Merz KM; Kollman PA Atomic Charges Derived from Semiempirical Methods. J. Comput. Chem 1990, 11, 431–439. [Google Scholar]
- (35).Frisch MJ; Trucks GW; Schlegel HB; Scuseria GE; Robb MA; Cheeseman JR; Scalmani G; Barone V; Petersson GA; Nakatsuji H; et al. Gaussian 09, Revision D.01; Gaussian, Inc.: Wallingford CT, 2009. [Google Scholar]
- (36).King G; Warshel A Investigation of the Free Energy Functions for Electron Transfer Reactions. J. Chem. Phys 1990, 93, 8682–8692. [Google Scholar]
- (37).Lee FS; Warshel A A Local Reaction Field Method for Fast Evaluation of Long-Range Electrostatic Interactions in Molecular Simulations. J. Chem. Phys 1992, 97, 3100–3107. [Google Scholar]
- (38).Štrajbl M; Florián J; Warshel A Ab Initio Evaluation of the Potential Surface for General Base-Catalyzed Methanolysis of Formamide: A Reference Solution Reaction for Studies of Serine Proteases. J. Am. Chem. Soc 2000, 122, 5354–5366. [Google Scholar]
- (39).Pettersen EF; Goddard TD; Huang CC; Couch GS; Greenblatt DM; Meng EC; Ferrin TE UCSF Chimera—A Visualization System for Exploratory Research and Analysis. J. Comput. Chem 2004, 25, 1605–1612. [DOI] [PubMed] [Google Scholar]
- (40).Lee FS; Chu ZT; Warshel A Microscopic and Semimicroscopic Calculations of Electrostatic Energies in Proteins by the Polaris and Enzymix Programs. J. Comput. Chem 1993, 14, 161–185. [Google Scholar]
- (41).Sham YY; Chu ZT; Tao H; Warshel A Examining Methods for Calculations of Binding Free Energies: LRA, LIE, PDLDLRA, and PDLD/S-LRA Calculations of Ligands Binding to an HIV Protease. Proteins: Struct., Funct., Genet 2000, 39, 393–407. [PubMed] [Google Scholar]
- (42).Singh N; Warshel A Toward Accurate Microscopic Calculation of Solvation Entropies: Extending the Restraint Release Approach to Studies of Solvation Effects. J. Phys. Chem. B 2009, 113, 7372–7382. [DOI] [PMC free article] [PubMed] [Google Scholar]
- (43).Romano KP; Ali A; Aydin C; Soumana D;Özen A; Deveau LM; Silver C; Cao H; Newton A; Petropoulos CJ; et al. The Molecular Basis of Drug Resistance against Hepatitis C Virus NS3/4A Protease Inhibitors. PLoS Pathog 2012, 8, e1002832. [DOI] [PMC free article] [PubMed] [Google Scholar]
- (44).Dunbrack RL Rotamer Libraries in the 21st Century. Curr. Opin. Struct. Biol 2002, 12, 431–440. [DOI] [PubMed] [Google Scholar]
- (45).Webb B; Sali A Protein Structure Modeling with Modeller. Methods Mol. Biol 2014, 1137, 1–15. [DOI] [PubMed] [Google Scholar]
- (46).Bayly CI; Cieplak P; Cornell WD; Kollman PA A Well-Behaved Electrostatic Potential Based Method Using Charge Restraints for Deriving Atomic Charges: The RESP Model. J. Phys. Chem 1993, 97, 10269–10280. [Google Scholar]
- (47).Case DA; Betz RM; Botello-Smith W; Cerutti DS; Cheatham TE III; Darden TA; Duke RE; Giese TJ; Gohlke H; Goetz AW, et al. AMBER 2016: University of California: San Francisco, CA, 2016. [Google Scholar]
- (48).Chakrabarty S; Warshel A Capturing the Energetics of Water Insertion in Biological Systems: The Water Flooding Approach. Proteins: Struct., Funct., Genet 2013, 81, 93–106. [DOI] [PMC free article] [PubMed] [Google Scholar]
- (49).Åqvist J; Medina C; Samuelsson J-E A New Method for Predicting Binding Affinity in Computer-Aided Drug Design. Protein Eng., Des. Sel 1994, 7, 385–391. [DOI] [PubMed] [Google Scholar]
- (50).Åqvist J; Hansson T On the Validity of Electrostatic Linear Response in Polar Solvents. J. Phys. Chem 1996, 100, 9512–9521. [Google Scholar]
- (51).Warshel A; Naray-Szabo G; Sussman F; Hwang JK How Do Serine Proteases Really Work? Biochemistry 1989, 28, 3629–3637. [DOI] [PubMed] [Google Scholar]
- (52).Ishida T; Kato S Theoretical Perspectives on the Reaction Mechanism of Serine Proteases: The Reaction Free Energy Profiles of the Acylation Process. J. Am. Chem. Soc 2003, 125, 12035–12048. [DOI] [PubMed] [Google Scholar]
- (53).Uritsky N; Shokhen M; Albeck A Stepwise Versus Concerted Mechanisms in General-Base Catalysis by Serine Proteases. Angew. Chem., Int. Ed 2016, 55, 1680–1684. [DOI] [PubMed] [Google Scholar]
- (54).Dahl G; Sandström A; Åkerblom E; Danielson UH Resistance Profiling of Hepatitis C Virus Protease Inhibitors Using Full-Length NS3. Antivir. Ther 2007, 12, 733–740. [PubMed] [Google Scholar]
- (55).Lin C; Lin K; Luong Y-P; Rao BG; Wei Y-Y; Brennan DL; Fulghum JR; Hsiao H-M; Ma S; Maxwell JP; et al. In Vitro Resistance Studies of Hepatitis C Virus Serine Protease Inhibitors, VX-950 and BILN 2061 Structural Analysis Indicates Different Resistance Mechanisms. J. Biol. Chem 2004, 279, 17508–17514. [DOI] [PubMed] [Google Scholar]
- (56).Ali A; Aydin C; Gildemeister R; Romano KP; Cao H; Özen A. e. l.; Soumana D; Newton A; Petropoulos CJ; Huang W; et al. Evaluating the Role of Macrocycles in the Susceptibility of Hepatitis C Virus NS3/4A Protease Inhibitors to Drug Resistance. ACS Chem. Biol 2013, 8, 1469–1478. [DOI] [PMC free article] [PubMed] [Google Scholar]
- (57).Johansson A; Poliakov A; Åkerblom E; Wiklund K; Lindeberg G; Winiwarter S; Danielson UH; Samuelsson B; Hallberg A Acyl Sulfonamides as Potent Protease Inhibitors of the Hepatitis C Virus Full-Length NS3 (Protease-Helicase/Ntpase): A Comparative Study of Different C-Terminals. Bioorg. Med. Chem 2003, 11, 2551–2568. [DOI] [PubMed] [Google Scholar]
- (58).Tong X; Bogen S; Chase R; Girijavallabhan V; Guo Z; Njoroge FG; Prongay A; Saksena A; Skelton A; Xia E Characterization of Resistance Mutations against HCV Ketoamide Protease Inhibitors. Antiviral Res 2008, 77, 177–185. [DOI] [PubMed] [Google Scholar]
- (59).Kieffer TL; Sarrazin C; Miller JS; Welker MW; Forestier N; Reesink HW; Kwong AD; Zeuzem S Telaprevir and Pegylated Interferon−Alpha-2a Inhibit Wild-Type and Resistant Genotype 1 Hepatitis C Virus Replication in Patients. Hepatology 2007, 46, 631–639. [DOI] [PubMed] [Google Scholar]
- (60).Lenz O; Verbinnen T; Lin T-I; Vijgen L; Cummings MD; Lindberg J; Berke JM; Dehertogh P; Fransen E; Scholliers A; et al. In Vitro Resistance Profile of the Hepatitis C Virus NS3/4A Protease Inhibitor TMC435. Antimicrob. Agents Chemother 2010, 54, 1878–1887. [DOI] [PMC free article] [PubMed] [Google Scholar]
- (61).Jindal G; Ramachandran B; Bora RP; Warshel A Exploring the Development of Ground-State Destabilization and Transition-State Stabilization in Two Directed Evolution Paths of Kemp Eliminases. ACS Catal 2017, 7, 3301–3305. [DOI] [PMC free article] [PubMed] [Google Scholar]
Associated Data
This section collects any data citations, data availability statements, or supplementary materials included in this article.


