Abstract
Serotonin receptor (5-HT3AR)1, a cationic pentameric ligand-gated ion channel (pLGIC), is the clinical target for management of nausea and vomiting associated with radiation and chemotherapies2. Upon binding, serotonin induces a global conformational change encompassing the ligand-binding extracellular domain (ECD), the transmembrane domain (TMD), and the intracellular domain (ICD), the molecular details of which are unclear. Here, we present two serotonin-bound structures of the full-length 5-HT3AR in distinct conformations at 3.32 Å and 3.89 Å resolutions that reveal the mechanism underlying channel activation. When compared to Apo-5-HT3AR, serotonin-bound states underwent a large twisting motion in the ECD and TMD leading to the opening of a 165 Å long permeation pathway. Notably, this motion results in creation of lateral portals for ion permeation at the interface of the TMD and ICD. Combined with molecular dynamics simulations, these structures provide novel insights into conformational coupling across domains and functional modulation.
Keywords: Cys-loop receptors, gating, modulation
Recent high-resolution pLGIC structures have illuminated several fundamentals of the gating mechanism3–7. However, a key missing link is the information on conformational coupling between the different domains and particularly, how the ICD modulates the overall channel function. The ICD plays a role in plasma membrane expression8 and regulates single-channel conductance, rectification, and gating 9,10. Recently, we reported the structure of the full-length mouse 5-HT3AR (Extended Data Table 1a) in the unliganded-state (referred here as Apo) solved by single-particle cryo-electron microscopy (cryo-EM)11, which revealed the salient features of the resting conformation. To gain insights into the serotonin-activation mechanism, we determined 5-HT3AR structure in the presence of 100 μM serotonin by Cryo-EM. High-resolution data collection and processing revealed two distinct populations of the receptor with final 3D reconstructions to overall resolutions of 3.32 Å and 3.89 Å, which we will refer to as State 1 and State 2, respectively (Extended Data Figs. 1 and 2, Extended Data Table 1b). The map for both states contained density for the entire ECD, TMD and a large region of the ICD (Extended Data Fig. 3) and the overall 3D architectures are as seen previously with the Apo11.
Apo, State 1 and State 2 structures reveal distinct conformations of the pore (Figs. 1a and 1b). Apo is constricted at multiple locations along the permeation pathway (Lys108/Asp105 in the ECD, Leu260 (L9′) and Glu250 (E-1′) in the TMD, and Arg416 in the ICD) to radii below ~2.76 Å (radius of a hydrated Na+ ion)12, reflective of its non-conductive conformation. While Leu260 in the middle of M2 is a part of the activation gate13, Glu250 at the intracellular end forms the selectivity filter14. Compared to Apo, State 1 shows an expansion of the pore at each of these constriction points. The radius at Leu260 is ~ 3.0 Å and the pore within M2 is narrowest at Ser253 (S2′) ~ 2.7 Å, suggesting that these locations may impede permeation of hydrated Na+ ion. On the other hand, State 2 has the widest pore among the three structures (> 3.2 Å), notably at positions below Leu260 and extending all the way into the ICD, indicating a potentially conductive conformation. In comparison to Apo, the M2 helices are rotated clockwise by 7.5º in State 1 and 13º in State 2 and positioned outward (Fig. 1c) with the Leu260 sidechains rotated away from the pore axis. Additionally, in State 2, the helix is bent at Ser253 and tilted 25º away from the pore-axis at the level of Glu250 thereby creating a wider vestibule at the intracellular end of M2.
Figure 1. Ion permeation pathway.
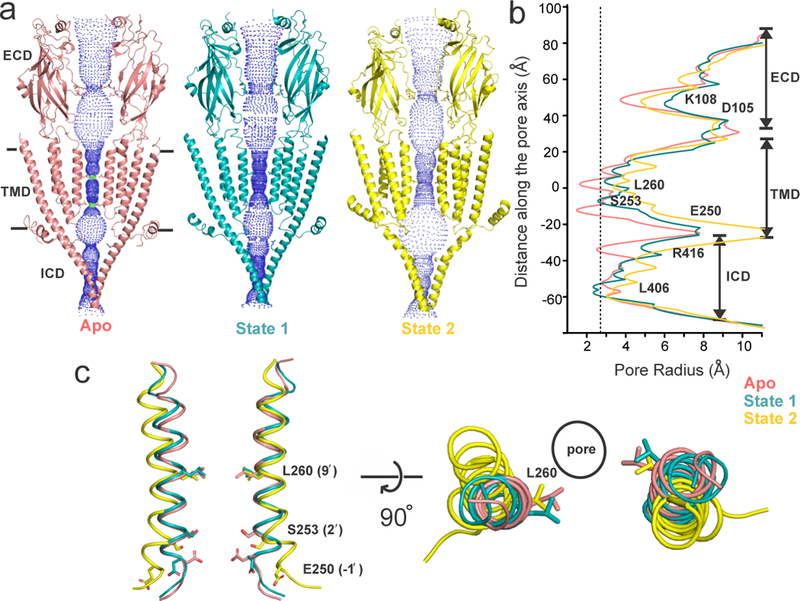
a, The profile of ion permeation pathway for the full-length 5-HT3AR in the Apo state (salmon red) and in the two serotonin-bound conformations, State 1 (teal) and State 2 (yellow). For clarity, the cartoon representation is shown only for two subunits. Green and blue spheres define radii of 1.8–3.3 Å and > 3.3 Å, respectively. Position at which the pore is constricted below 2.76 Å radius in the Apo state is shown as sticks. b, The pore radii is plotted as a function of distance along the pore axis. The dashed line indicates an approximate radius of a hydrated Na+ ion12. c, Side (left) and top view (right) of the pore-lining M2 helices from a superpositioning of the Apo, State 1 and State 2 structures.
State 1 and State 2 reveal a distinct new density for serotonin at the neurotransmitter binding site located at the interface of two adjacent subunits (Fig. 2a, right panels). Residues from Loops A, B, and C on the principal (+) subunit and Loops D, E, and F from the complementary (−) subunit15,16 form a cage-like enclosure for serotonin (Fig. 2a, left panels). In comparison to the outward or “open” orientation of Loop C in Apo, in both States 1 and 2, Loop C is in a closed position (Fig. 2b), consistent with agonist-bound conformations of AChBP17. Several interactions between serotonin and binding-site residues (Trp156, Arg65, and Trp63) have previously been proposed18,16,19 and these residues are within 4 Å from serotonin in State1 and State 2.
Figure 2. The serotonin-binding site and global conformational differences between the Apo and serotonin-bound states.
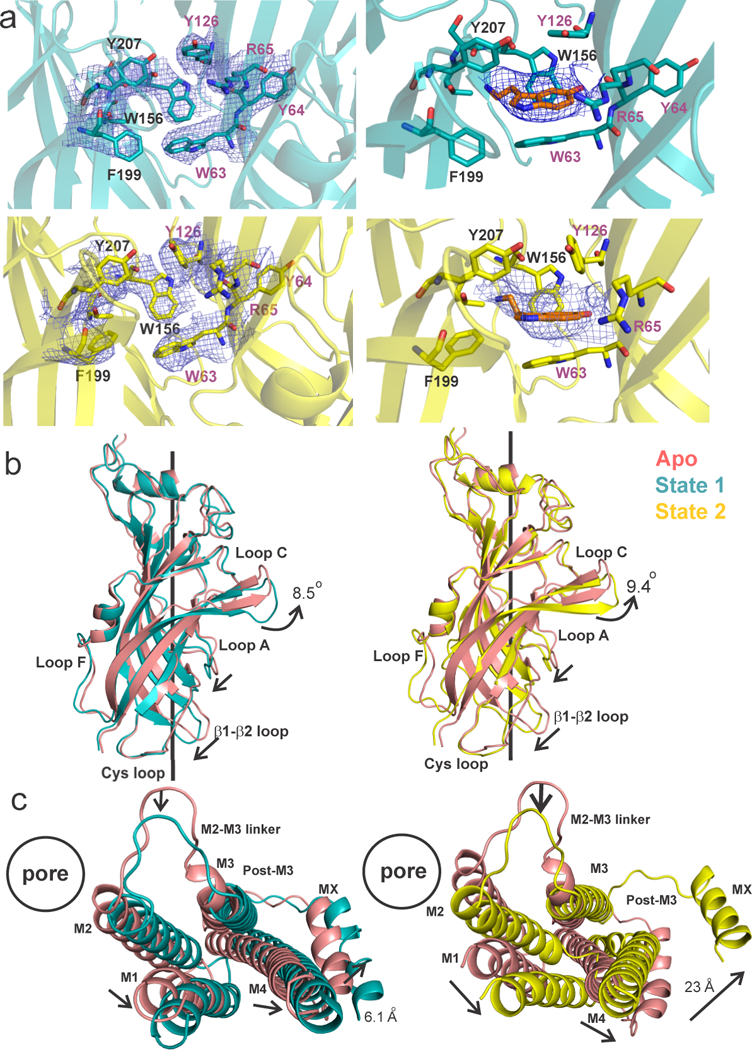
a, Top, the State 1 map (contoured at 10σ) is shown around the side chain of residues at the subunit interface that constitute the serotonin-binding site (left). The density map (7.5 σ) for serotonin in State 1 (right). Bottom, the State 2 density map for the residues (9 σ) and serotonin (7.5 σ). b, A comparison of the ECDs of Apo with State 1 (left) and State 2 (right) when aligned with respect to the TMD. The arrows indicate the direction of displacements between the two structures. c, A view of the (−) subunit TMDs from the extracellular end when aligned with respect to the ECDs of the (+) subunit. A comparison is made for State 1 with Apo (left) and State 2 with Apo (right).
A comparison with Apo reveals a global twisting of the ECD and TMD in serotonin-bound states (Extended Data Fig. 4a). There is an overall counter-clockwise rotation of the ECD around the pore axis leading to major repositioning of individual interfacial loops (Extended Data Fig. 4b and Fig. 2b), similar to other pLGICs5,20. As a result, buried areas between adjacent subunits are reduced in State 1 (3,096 Å2) and State 2 (2, 533 Å2) compared to Apo (3, 161 Å2). This change is also reflected in decreased inter-subunit interactions at the ECD-TMD and TMD-ICD interfaces transitioning from Apo-to-State 1-to-State 2 (Extended Data Fig. 5). At the level of the TMD, serotonin induces a clockwise rotation with an expansion of the TM helices away from the pore axis (Extended Data Figs. 4a bottom, 4c). An outward displacement of M2 is accompanied by a significant outward movement of the M2-M3 loop away from the inter-subunit interface (Fig. 2c) which reduces its interactions with pre-M1 and β8-β9 loop in the neighboring subunit as seen in Apo (Extended Data Fig. 5a).
The most striking difference among the three structures is the conformation of the ICD comprised largely of the M3-M4 linker. The MA (membrane-associated) helix21 in Apo and State 1 appears as a straight helix extending into M4. In State 2, the MA-M4 helix is bent (20º with respect to MA) in the vicinity of Gly430 and appears as two separate helices that are tilted away from the pore axis3 (Fig. 3a and Extended Data Fig. 6) and thereby enlarging the central cavity at the TMD-ICD interface (Fig. 1a). Gly430 may introduce greater flexibility at the hinge-point between MA and M4 helices. In Apo, the ion exit pathways are occluded at two different levels: (i) the post-M3 loop obstructs the lateral portals lined by MA-M4 helices (Extended Data Fig. 5b). (ii) the MA helices form a tight bundle which sterically occludes ion permeation along the pore-axis (Fig. 1b and Extended Data Fig. 6). While in State 1 there are small conformational changes in these regions, there are dramatic protein motions transitioning to State 2. The post-M3 loop extends away from the MA-M4 helix and as a consequence, creates lateral portals with openings of dimensions 16.0 Å x 11.4 Å (Figs. 3b and 3c). These portals are large enough to accommodate hydrated Na+ ions and thereby may serve as exit pathways for permeant ions (Fig. 3b), consistent with the early predictions based on work in nAChR21 and 5-HT3AR22. The MX helix in Apo and State 1 lies parallel at the putative membrane-water interface and in State 2, it is displaced upward from the interface and as a consequence pulls the post-M3 loop away from the lateral portal. Additionally, the outward movement of MA disrupts the tight packing of the helical bundle structure thereby widening the pore in this region.
Figure 3. Opening of the lateral portal for ion exit.
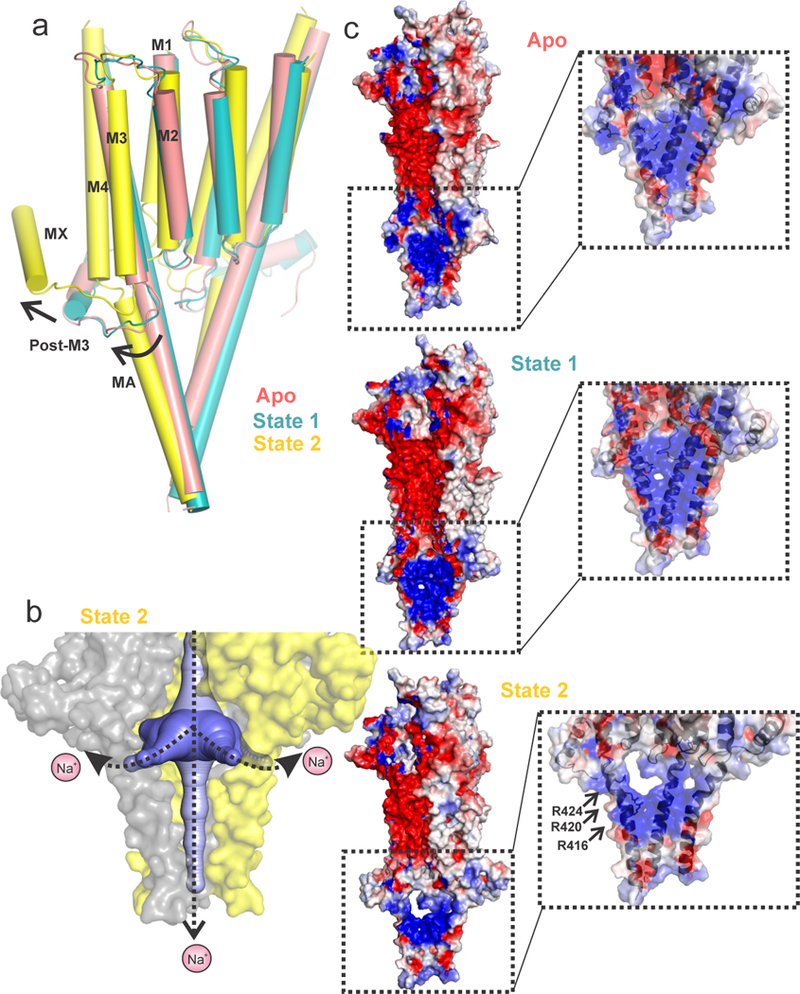
a, An alignment of Apo, State 1 and State 2 structures. The TMD and ICD are shown for two adjacent subunits. The arrows show the direction of relative movements of the helices. b, The solvent-accessible vestibule in the ICD of State 2 was calculated with a minimum cavity radius of 2.8 Å. One of the subunits in the surface representation is removed for clarity. The plausible ion exit pathways are indicated by dotted arrows. c, The solvent-accessible electrostatic potential map generated using the APBS tool. The inset shows a zoomed-in view of the ICD to highlight the progressive opening of the lateral portal from the Apo structure to State 2. Residues Arg416, Arg420, and Arg424 (shown in stick representation) are implicated in regulating the single channel conductance of 5-HT3AR.
The electrostatic potential maps show that while the ion permeation pathway in the ECD and the TMD is lined predominantly by electronegative sidechains (Fig. 3c), the ICD is lined by clusters of positively charged residues on the MA helix. In State 2, the entry ways to the lateral portals are lined by three key arginine residues (Arg416, Arg420, Arg424) from the MA helix (Extended Data Fig. 6a) which are reported to be responsible for the unusually low single-channel conductance of 5-HT3AR (0.4–0.6 pS)23 through mechanisms involving steric occlusion and electrostatic repulsion22. As expected, mutations to the Arg sidechain significantly increase single-channel conductance (up to 40 fold)9. Previous studies have demonstrated that both the length and the sequence of the M3-M4 linker have significant effects on channel function10,24 and several positions in MA regulate single-channel conductance22,25, inward rectification10, gating, and desensitization10,26,27. Collectively, these studies in the light of the structures presented here, underscore the role of the ICD in many aspects of channel function.
To assess the conductance of Apo, State 1, and State 2, we performed molecular dynamics simulations on the structures inserted, in silico, within a phospholipid bilayer (Fig. 4). An analysis of simulated water density along the pore axis suggests that Apo is closed to water, with two hydrophobic constrictions that are de-wetted (one at ~ −60 Å in the ICD, lined by hydrophobic residues Leu402, Leu406, and Ile409 on the MA helix and the other at ~ 0 Å around Leu260 in M2). In simulations performed with a transmembrane potential, no permeation events were observed for Na+ ions in this conformation. For State 1, similar energetic barriers for water were present along the pore. However, a small number of Na+ ions were observed to traverse the channel when simulated with a potential difference. State 2, on the other hand, did not present a barrier for water within the TMD and Na+ permeation events were observed throughout the simulations. However, the hydrophobic region at −60 Å was de-wetted almost entirely and Na+ ions failed to permeate this region. The ions instead exited the ICD through the lateral portals, consistent with the earlier predictions that these regions serve as exit pathways for ions21,22 (Supplementary Video 1).
Figure 4. Molecular dynamics simulations of Apo, State 1, and State 2 structures.
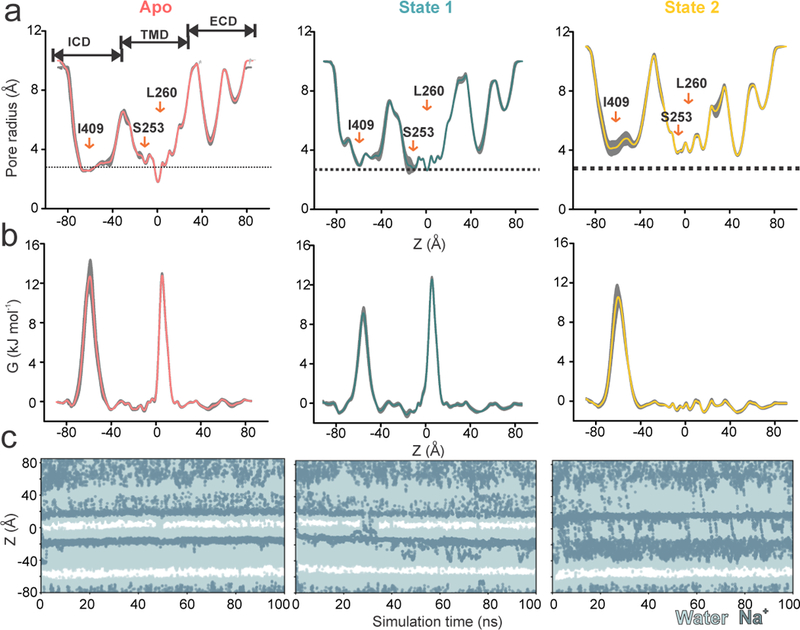
Each structure was subjected to three 50 ns equilibrium simulations, with the replicates initiated from separately assembled protein-membrane systems. Radius and energy profiles were calculated for each simulation (using the final 40 ns of the trajectory, with a sampling interval of 0.5 ns) and averaged across replicates. For each structure, its mean profiles and the one-standard-deviation range between calculations (n = 3) are shown as gray band. a, Averaged radii along the central pore axis. The dashed line indicates the approximate radius of a hydrated Na+ ion. b, Corresponding free energy profiles of a water molecule along the central pore axis. c, Trajectories of water and Na+ ion coordinates within 5 Å of the channel axis inside the pore over 100 ns with a 0.2 V transmembrane potential difference, with the cytoplasmic side having a negative potential. White stretches indicate regions devoid of water and ions. The energetic barriers due to the ring of L260 and Ile409 are at z ~ 0 Å and −60 Å, respectively. One of three independent 100ns replicates is shown for each structure.
Overall, these findings reveal that Apo is non-conductive while State 2 represents a conductive conformation. Brief and infrequent permeation events observed for State 1 suggest that it may have low-conductance. A closer look at State 1 shows that the pore was de-wetted when the Leu260 sidechains were pointing-in (as seen in Apo) and the pore was hydrated when the sidechains were pointing-away (Extended Data Fig. 7). Interestingly, Glu250 sidechains also underwent significant shifts in conformation leading to changes in the local pore-radius, sometimes reduced to ~2.4 Å when the Glu sidechains were pointing-in (Extended Data Fig. 8). Therefore, based on these analyses we conclude that while being mostly non-conductive, sidechain fluctuations may allow a small conductance in State 1.
A comparison with representative pLGIC conformational states shows that, in general agreement, in the resting conformation, the hydrophobic extracellular half of M2 forms the activation gate with 9′ being the narrowest region, and in the desensitized conformation, the intracellular end is constricted (Extended Data Fig. 9). However, notable differences in the extent of constrictions may reflect their inherent differences in gating kinetics, origin, or perhaps the nature of biochemical modification involved in determining these structures. Leu260 (9′) is conserved across pLGICs and our finding is consistent with its role in gating and desensitization28–30. At the intracellular end, Ser253 (2′) lines the narrowest region in State 1 and mutation to S253T shows serotonin-induced currents (10 µM) with remarkably slow kinetics of decay (Figs. 5a and 5b). The narrow pore at this position is also in agreement with Cd2+ coordination studies 31. Glu250 (−1′) is the narrowest region in nAChR structure captured in a desensitized conformation4 and the sidechain shows extensive side-chain fluctuations in the State 1 MD simulations. We find that a charge-preserving mutation at this position (E250D) led to an enhanced desensitization (Figs. 5a, and 5c). In State 2, Glu250 appears to be potentially interacting with His309 in M3 from the adjacent subunit (Fig. 5d) and the H309S mutant also shows rapidly desensitizing currents (Figs. 5c and 5d, bottom). There was no notable change in the desensitization of G249A consistent with findings that the M1-M2 linker has relatively minimal effect on desensitization27. Overall, these results are in agreement with the idea that the intracellular end of M2 plays an important role in ion selectivity and gating.
Figure 5. Functional characterization of mutations at the pore-lining positions.
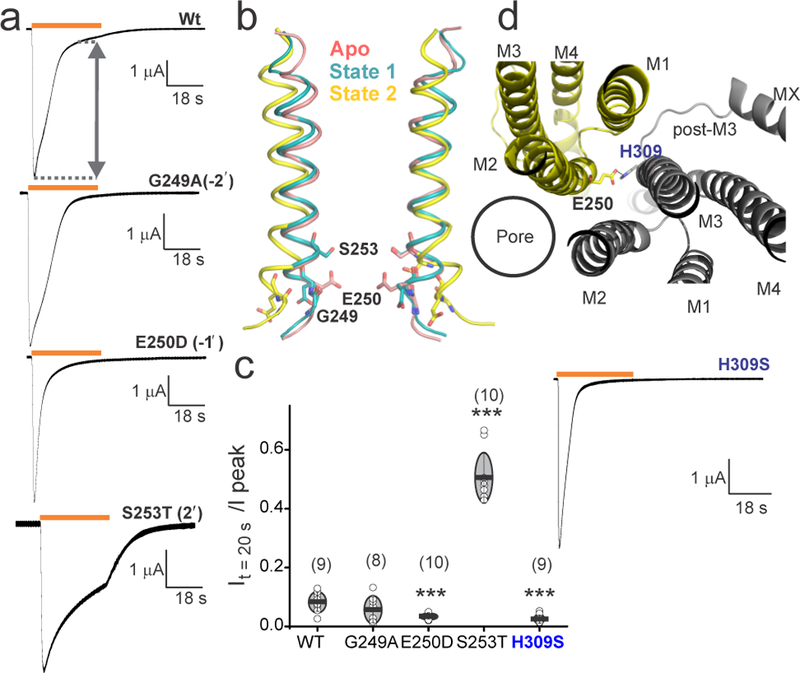
a, Two electrode voltage-clamp (TEVC) recording (at −60mV) of wt 5-HT3AR, G249A, E250D and S253T mutants expressed in oocytes. Currents were elicited in response to application of 10 µM serotonin (duration of serotonin application shown as an orange line). b, Positions of the mutated residues in M2 (ribbons) are shown as stick representation on two subunits in Apo, State 1, and State 2. c, A plot of the ratio of current measured at t = 20 sec over the peak current amplitude. The number of individual oocyte recordings are indicated in parenthesis. The mean value is shown as a horizontal line and SD as error bars. The significance (P-values) from two sample t-test for mutants and wt at 95% confidence level: E250D (0.0003), S253T (9.6E-11), and H309S (0.0002), indicated by ***. d, The interaction between Glu250 and His309 from two adjacent subunits as seen from the extracellular end (top). TEVC recording of 10 µM serotonin-induced current for the H309S mutant (bottom).
The Apo and serotonin-bound 5-HT3AR structures provide many new insights into the activation mechanism. Serotonin induces a global twisting in the ECD, TMD, and ICD leading to reduced inter-subunit interactions and greater solvent-exposed surfaces. The State 2 conformation features large protein motions in the ICD which widen the central cavity and open ion-exit pathways at the lateral portals and along the pore axis. The overall pore conformation suggests that State 2 likely represents a conductive, open state. We cannot unequivocally assign a functional state to the State 1 conformation, and it is unclear whether it corresponds to a pre-open, non-conducting intermediate or a desensitized state. Future studies are necessary to further evaluate this conformation and determine the significance of potential intermediate states in channel gating.
Methods
Cloning and functional measurements in oocytes
The gene encoding 5-HT3AR (purchased from GenScript USA Inc) was inserted into the pTLN vector for Xenopus laevis oocyte expression and confirmed by DNA sequencing. The DNA linearization was carried out by incubation with the Mlu1 restriction enzyme overnight at 37 ºC. The mRNA synthesis was done using the mMessage mMachine kit (Ambion) as per manufacturer’s instruction. The eluted mRNA was purified with RNAeasy (Qiagen), and injected (3–10 ng) into Xenopus laevis oocytes (stages V-VI). As a control to verify no endogenous currents were present, oocytes were injected with the same volume of water. The oocytes used in this study were kindly provided by Dr. Walter F. Boron. Female Xenopus laevis were purchased from Nasco. All animal experimental procedures were approved by Institutional Animal Care and Use Committee (IACUC) of Case Western Reserve University. Oocytes were maintained at 18 ºC in OR3 media (GIBCO BRL Leibovitz media containing glutamate, 500 units each of penicillin and streptomycin, pH adjusted to 7.5, osmolarity adjusted to 197 mOsm). Two electrode voltage-clamp experiments were performed at room temperature 2–5 days post injection on a Warner Instruments Oocyte clamp OC-725. The currents were sampled and digitized at 500 Hz with a Digidata 1332A and analyzed by Clampfit 10.2 (Molecular Devices). Oocytes were clamped at a holding potential of −60 mV, and currents were recorded in response to serotonin application. Solutions were changed using a syringe pump perfusion system flowing at a rate of 6 ml/min. The electrophysiological solutions contained 96 mM NaCl, 2 mM KCl, 1.8 mM CaCl2, 1 mM MgCl2, and 5 mM HEPES (pH 7.4, osmolarity adjusted to 195 mOsm). All chemical reagents were purchased from Sigma-Aldrich. For wt and mutants, the current decay was assessed by the ratio of the current measured at time =20 sec (from the start of ligand application) over peak current amplitude.
Cloning and transfection
Codon optimized mouse 5-HT3AR gene (NCBI Reference Sequence: NM_001099644.1) was purchased from GenScript USA Inc and subcloned into pFastBac1 vector. The pFastBac1 vector includes four Strep-tags (WSHPQFEK) at the N-terminus, followed by a linker sequence (GGGSGGGSGGGS) and a TEV-cleavage sequence (ENLYFQG). The construct also includes a C-terminal 1D4-tag32. Spodoptera frugiperda cells (Sf9, Invitrogen) were cultured in ESF921 medium (Expression System) in the absence of antibiotics and incubated at 28 ˚C without CO2 exchange. Sub-confluent cells were transfected with recombinant bacmid DNA using Cellfectin II transfection reagent (Invitrogen) per manufacturer instructions. The cell culture supernatants were collected and centrifuged at 1,000 × g for 5 min to remove cell debris to obtain progeny 1 (P1) recombinant baculovirus 72 hr post-transfection. P2 viruses were obtained through consecutive round of Sf9 cells infection with P1 viruses. The supernatants (P2) were used to infect Sf9 cells, thus generating P3 viruses. These viruses (P3) were used for recombinant protein production.
Expression and purification of recombinant protein
Recombinant protein production was performed by infection of approximately 2.5×10⁶ per ml Sf9 cells with P3 recombinant viruses. After 72 h post-infection, the cell media were harvested and centrifuged at 8,000 × g for 20 min at 4oC to separate the supernatant from the pellet. The cell pellet was then resuspended in 20 mM Tris-HCl, pH 7.5, 36.5 mM sucrose, and 1% protease inhibitor cocktail. Cells were disrupted by sonication on ice and non-lysed cells were removed by centrifugation (3000 × g for 15 min). The membrane fraction was separated by ultracentrifugation (167,000 × g for 1 hr) and solubilized with 1% C12E9 in a buffer containing 500 mM NaCl, 50 mM Tris pH 7.4, 10% glycerol, and 0.5% protease inhibitor by rotating for 2h at 4 °C. Non-solubilized material was removed by ultracentrifugation (167,000 × g for 15 min). The supernatant was collected and bound with 1D4 beads pre-equilibrated with 150 mM NaCl, 20 mM HEPES pH 8.0, and 0.01% C12E9 for 2 hrs at 4 °C. The beads were then washed with 100 column volumes of 150 mM NaCl, 20 mM HEPES pH 8.0, and 0.01% C12E9 (Buffer A). The protein was then eluted with Buffer A supplemented with 3mg/ml 1D4 peptide (NH2- TETSQVAPA-CO2H). Eluted protein was then concentrated and deglycosylated with PNGase F (NEB) by incubating 5 units of the enzyme per 1μg of the protein for 2 h at 37 °C under gentle agitation. Deglycosylated protein was then applied to a Superose 6 column (GE healthcare) equilibrated with Buffer A. The peak fractions around 13.9 ml were pooled and concentrated to 2–3 mg/ml using 50 kDa MWCO Millipore filters (Amicon) and used subsequently for cryo-EM studies.
Sample preparation and Cryo-EM data acquisition
Functional characterization shows that serotonin-induced 5-HT3AR currents saturate at 30 μM and beyond11,33,34. Therefore, the 5-HT3AR protein (~2.5 mg/mL) was filtered and first incubated with 100 μM serotonin for 30 min. After which, 3 mM Fluorinated Fos-choline 8 (Anatrace) was added and the sample was incubated until blotting35. The sample was blotted twice with 3.5 μL sample each time onto Cu 300 mesh Quantifoil 1.2/1.3 grids (Quantifoil Micro Tools), and immediately after the second blot, the grid was plunge frozen into liquid ethane using a Vitrobot (FEI). The grids were imaged using a 300 kV FEI Titan Krios microscope equipped with a Gatan K2-Summit direct detector camera. Movies containing 40-frames were collected at 130,000x magnification (set on microscope) in super-resolution mode with a physical pixel size of 0.532 Å/pix, dose rate of 3.754 electrons/pix/s, and a total exposure time of 12 seconds. Defocus values of the images ranged from −1.0 to −2.5 µm (input range setting for data collection) as per the automated imaging software Latitute S (Gatan Co.).
Image processing
Beam-induced motion was corrected using MotionCor36 with a B-factor of 150 pix2. Super-resolution counting images were binned (2 X 2) in Fourier space, making a final pixel size of 1.064 Å. All subsequent data processing was conducted in RELION 2.137. The defocus values of the motion-corrected micrographs were estimated using Gctf software38. Approximately, 3000 particles were manually picked from the 2810 micrographs and sorted into two-dimensional (2D) classes. The best of these classes were then used as templates for automated particle picking. A loose auto-picking threshold was selected to ensure no good particles were missed at this stage. This resulted in ~749,970 auto-picked particles that were subjected to 2D classification to remove suboptimal particles. An initial 3D model was generated from the Apo-5-HT3AR cryo-EM structure (PDB code: 6BE1) and low-pass filtered to 60 Å using EMAN239. Multiple rounds of 3D auto-refinements and 3D classifications generated 5 good classes. Among them two classes (containing total of 115,992 particles) belonged to State 1 and the other three classes (containing a total of 25,547 particles) represented the State 2 conformation. Subsequent 3D re-classifications, auto-refinement, imposing C5 symmetry, and post-processing yielded State 1 and State 2 5-HT3AR structures with final total particles of 103,698 and 18,839, respectively. In the post-processing step in RELION, a soft mask was calculated and applied to the two half-maps before the Fourier shell coefficient (FSC) was calculated. The B-factor estimation and map sharpening were performed in the post processing step. An overall resolution of State 1 and State 2 was calculated to 3.32 Å and 3.89 Å, respectively (based on the gold-standard Fourier shell coefficient (FSC) = 0.143 criterion). Local resolutions were estimated using the RESMAP software40.
5-HT3AR model building
The map for State 1 and State 2 contained density for the entire ECD, TMD and a large region of the ICD. The final refined models comprised of residues Thr8-Ile332, Leu397-Ser461. The missing region (333–396) is of the unstructured MX loop that links the amphipathic MX helix6 and the MA (membrane-associated) helix21. The Apo-5-HT3AR cryo-EM structure (PDB-ID: 6BE1) was used as an initial model and aligned to the 5-HT3AR cryo-EM map calculated with RELION 2.1. Cryo-EM map was converted to the mtz format using mapmask and sfall tools in CCP4i software 41. The mtz map was then used for manual model building in COOT42. After initial model building, the State 1 and State 2 models were refined against their respective EM-derived maps using the phenix.real_space_refinement tool from the PHENIX software package 43, employing rigid body, local grid, NCS, and gradient minimization. The models were then subjected to additional rounds of manual model fitting and refinement, resulting in good final models to map cross-correlation (Extended Data Table 1). Stereochemical properties of the model were evaluated by Molprobity44.
Protein surface area and interfaces were analyzed by using PDBePISA server (http://www.ebi.ac.uk/pdbe/pisa/). To compare the Apo, State 1, and State 2 structures all ligands, ions, and water molecules were removed from the PDB files. Additional residues in the Apo-5-HT3AR structure were also removed before analysis so that surface area comparisons were made between identical construct lengths. Electrostatic surface potential calculations were carried out using the APBS tools plug-in PyMOL45. The pore profile was calculated using the HOLE program46. All the tunnels were calculated using Caver3.0 PyMOL plug-in with minimal tunnel radius of 2.8 Å47. Figures were prepared using PyMOL (The PyMOL Molecular Graphics System, version 2.0.4 Schrödinger, LLC)
Molecular dynamics simulations
Each simulation cell (of approximate dimensions 13.5 × 13.5 × 19.5 nm3) contains the full-length receptor structure embedded in a phospholipid (POPC, i.e., 1-palmitoyl-2-oleoyl-sn-glycero-3-phosphocholine) bilayer, with an aqueous solution of Na+ and Cl- ions on either side. The protein-bilayer systems were assembled and equilibrated following a previously established protocol48 and the TIP4P water model49 was employed. Simulations were performed with GROMACS version 5.150,51, using the OPLS all-atom protein force field with united-atom lipids52, and at an integration time-step of 2 fs. A Verlet cut-off scheme was applied, and long-range electrostatic interactions were measured using the Particle Mesh Ewald method53. The temperature and pressure were maintained at 37 °C and 1 bar, respectively, using the velocity-rescale thermostat54 in combination with a semi-isotropic Parrinello and Rahman barostat55, with coupling constants of τT = 0.1 ps and τP = 1 ps. Bonds were constrained through the LINCS algorithm56, and an additional harmonic restraint at a force constant of 1000 kJ mol−1 nm−2 was placed on the protein backbone atoms to preserve the original conformational state of the cryo-EM structure.
For water free energy estimation, three 50 ns simulation replicates were each initiated from an independently assembled receptor-membrane system, containing NaCl at a concentration of 0.15 M. Using the Channel Annotation Package (www.channotation.org), the equilibrium density of water molecules at successive positions along the central pore axis was measured, and free energy profiles were derived through an inverse Boltzmann calculation-based method57. For monitoring ion permeation events, a separate set of simulations, each of 100 ns duration and with 0.7 M NaCl included in the simulation cell, were conducted in the presence of a 0.2 V transmembrane potential difference. This was applied by imposing an external, uniform electric field across the simulation cell along the membrane normal direction. The field strength was of magnitude 0.05 V nm−1, with the cytoplasmic side having either negative or positive potential in different simulation runs.
Extended Data
Extended Data Figure 1. Data processing workflow.
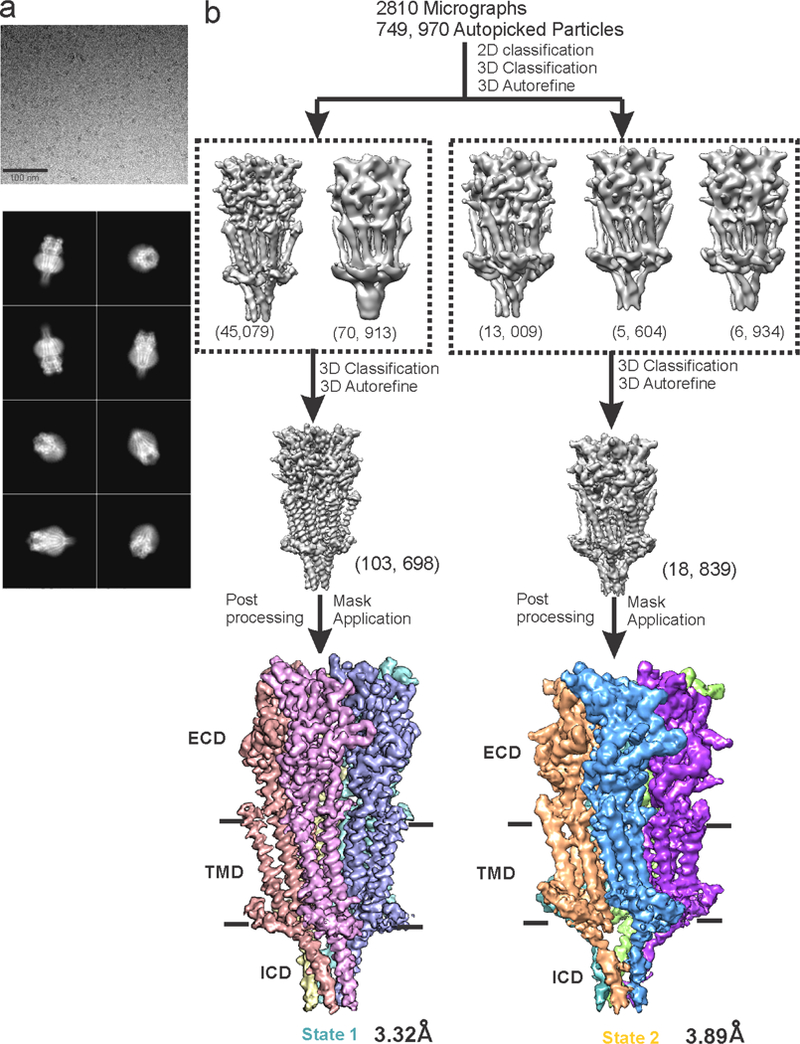
a, A representative micrograph of 5-HT3AR incubated with 100 μM serotonin in vitreous ice (top). Selected 2D classes showing various orientations (bottom). b, A schematic representation of the steps followed in data processing leading to 3.32 Å and 3.89 Å reconstructions of State 1 and State 2, respectively. Each subunit is shown in a different color for clarity. Classes within the boxes represent two distinct conformations. Based on the number of particles for each state, it appears that State 1 is more populated than State 2 under our current conditions.
Extended Data Figure 2. Estimation of resolution and validation of the models.
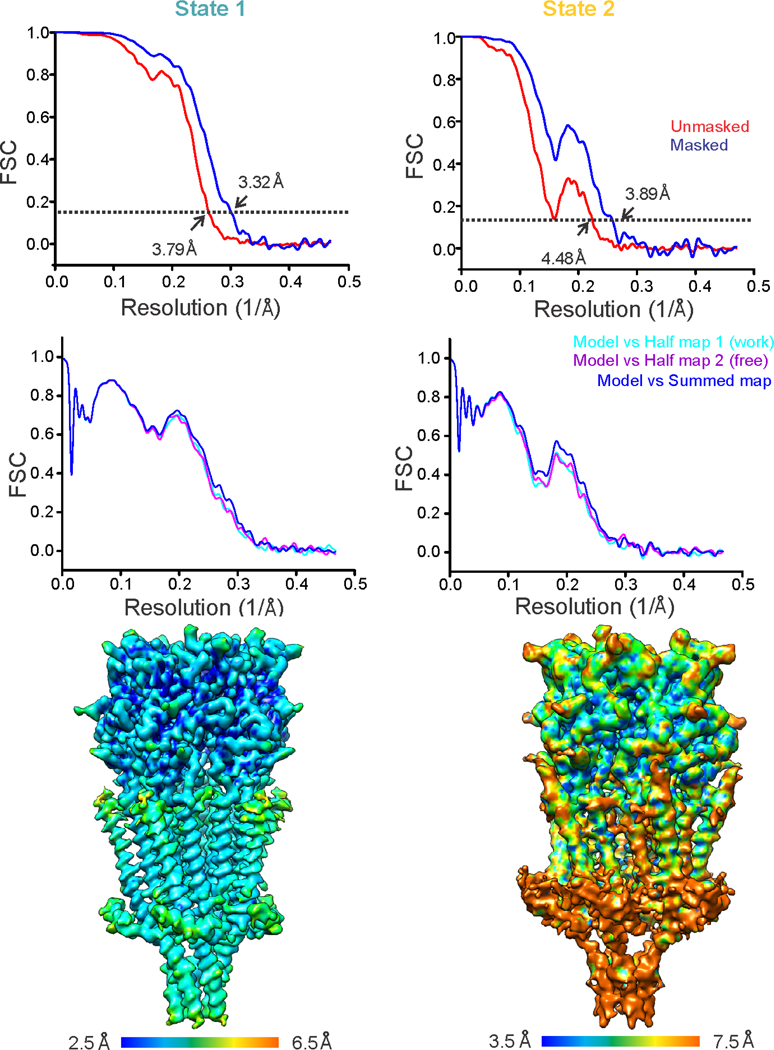
a, Fourier shell correlation (FSC) curves before (red) and after (blue) the application of soft mask in RELION for State 1 (left) and State 2 (right). The dashed line represents FSC of 0.143. b, For cross validation, FSC curves of the refined model versus summed map (full dataset, blue), refined model versus half map 1 (used during refinement, cyan), and refined model versus half map 2 (not used during refinement, purple) were calculated for State 1 (left) and State 2 (right). c, Local resolution of State 1 (left) and State 2 (right) reconstructions were estimated using ResMap program40.
Extended Data Figure 3. Map correlation of State 1 and State 2.
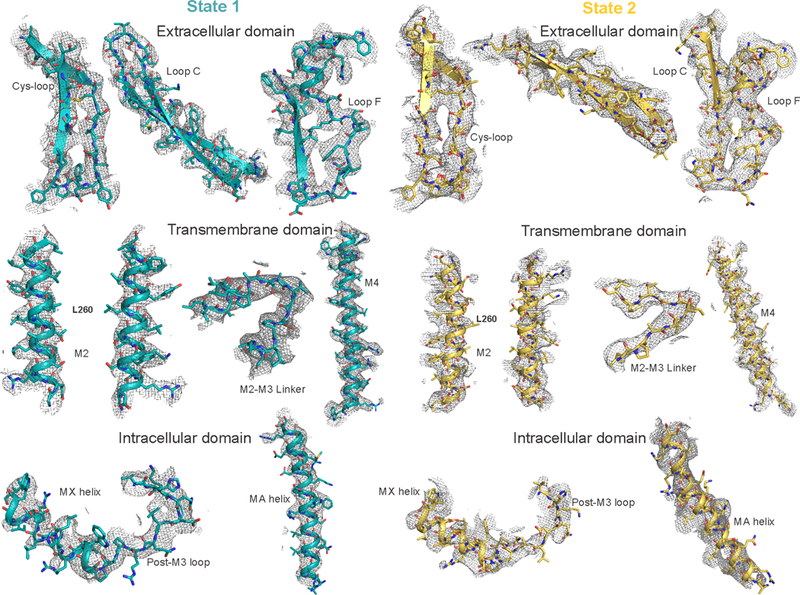
Various regions of the model (shown as a cartoon) and corresponding density map (mesh) around the residues are shown to validate the final model. Residues are depicted as sticks. The depicted regions in State 1 and the corresponding contour levels: Cys-loop (7.0σ), Loop C (8.0σ), Loop F (8.0σ), M2 (6.0σ), M2-M3 linker (7.0σ), M4 (6.5σ), MX helix (7.5σ) and MA helix (7.5σ). The depicted regions in State 2 and the corresponding contour levels: Cys-loop (8.5σ), Loop C (8.0σ), Loop F (8.0σ), M2 (6.0σ), M2-M3 linker (7.0σ), M4 (7.0σ), MX helix (7.0σ) and MA helix (6.0σ).
Extended Data Figure 4. Serotonin-induced conformational changes in the ECD and TMD.
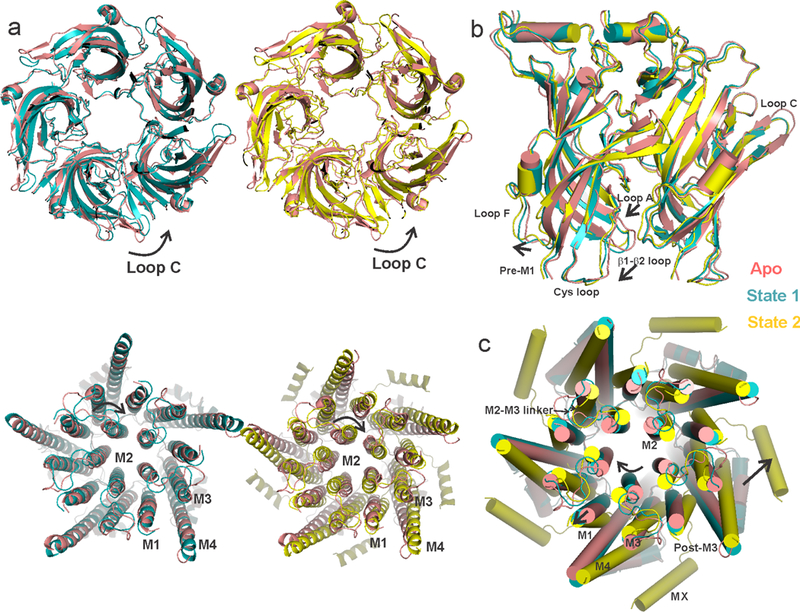
a, A global alignment of the Apo structure with State 1 (left) and State 2 (right). The top panel shows the ECD and the bottom panel shows the TMD, both viewed from the extracellular end. The arrows indicate the direction of rotation with respect to the Apo state. State 1 and State 2 structures superimpose with Apo-ECD with an RMSD of 1.16 for State 1 and 1.41 for State 2 (residues 8–220). State 1, and particularly State 2, diverge significantly in the TMD and ICD (RMSD of 1.1 for State 1 and 4.24 for State 2 for residues 221–462). b, A side-view of the ECDs upon aligning State 1 and State 2 to the Apo state. c, A top view of the TMDs when aligned with respect to the ECD. The arrows show relative displacements in different regions of State 1 and State 2 with respect to Apo.
Extended Data Figure 5. Inter-subunit interaction at the ECD-TMD-ICD interface.
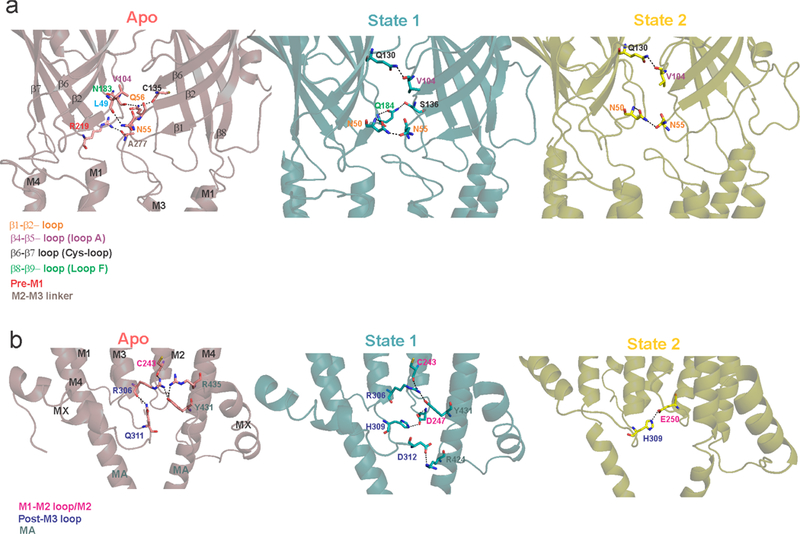
a, Inter-subunit interactions at the ECD-TMD interface in Apo, State 1 and State 2. b, Inter-subunit interactions at the TMD-ICD interface in the three states. The potential interactions were predicted as polar contacts in PyMOL. Interacting residues are shown as stick. Residue labels are color-coded based on their location. The Apo state has the largest buried surface area (31, 610 Å2) which progressively decreases going towards State 1 (30, 960 Å2) and then State 2 (25, 340 Å2).
Extended Data Figure 6. The intracellular domain of State 2.
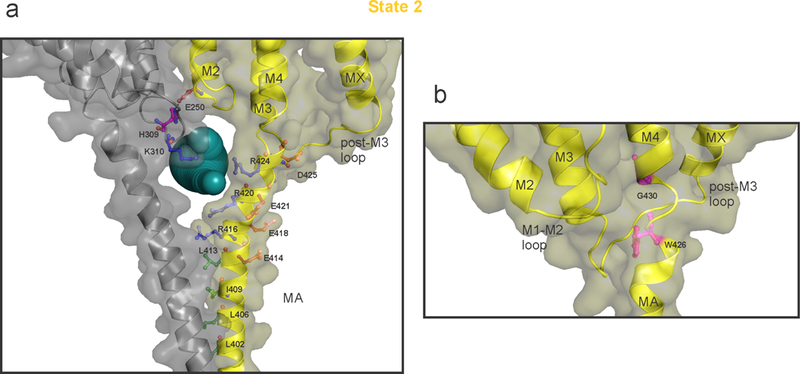
a, A detailed view of the ICD with key residues shown in stick representation. Only two adjacent subunits are shown for clarity. The solvent-accessible vestibule in the ICD calculated using Caver3.0 47 with a minimum cavity radius of 2.8 Å is shown as dark-cyan spheres. The positively charged residues lining the portal are shown as blue sticks. The negatively charged residues in the vicinity are shown in red-brown. Residues which form the hydrophobic patch at the N-terminal end of MA helix are shown as green sticks. Residues His309 (post-M3 loop) and Glu250 (M2) are in a potential interaction and shown in magenta. b, A zoomed view of the ICD to highlight the break in MA-M4 helices (highlighted in magenta) at Gly430. Glycine mediated TM helix distortion at (i-3 position) is well-studied58 and Gly430 may play a dynamic role at the hinge-point between MA and M4 helices. A similar bend in MA-M4 helix was previously observed in the Torpedo nAChR structure even in the absence of glycine at the equivalent position3.
Extended Data Figure 7. Molecular dynamics simulations of State 1.
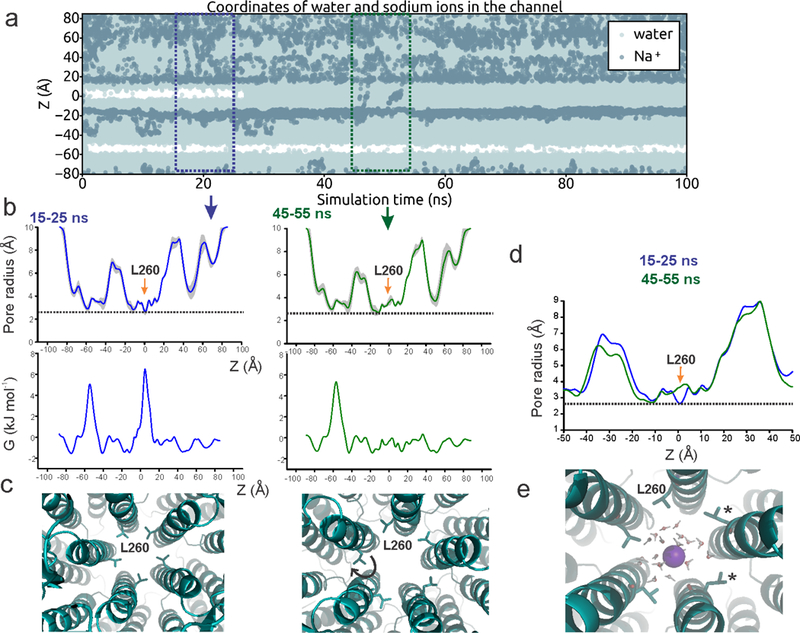
a, Trajectories of water and Na+ ion coordinates within 5 Å of the channel axis inside the pore over 100 ns with a 0.2 V transmembrane potential difference, with the cytoplasmic side having a positive potential. Stretches of white regions indicate areas devoid of water or ions. b, Time-averaged radii along the central pore axis of State 1 structure during two 10 ns fractions of the simulation (within the boxed region of panel a) (top). The orange arrows indicate positions of Leu260. The dashed line indicates the approximate radius of a hydrated Na+ ion. Free energy profile of a water molecule along the central pore axis during the 10 ns window (bottom). The barrier at the Leu260 position disappears in the 45–55 ns time frame. c, Snapshots of pore conformation around Leu260 (shown in stick representation) during the corresponding time window. The widening of the pore radii and the disappearance of the barrier for water permeation is associated with the rotameric reorientation of the Leu260 sidechain (indicated by the arrow). d, An overlay of the pore radii from the two time windows. Changes at position Leu260 are marked by the arrow. e, Snapshot of pore conformation around Leu260 as a Na+ ion (purple) is passing through, with two Leu260 sidechains rotated away (indicated by *). Three independent simulations were run.
Extended Data Figure 8. Snapshots of the State 1 pore conformation from the MD simulation.
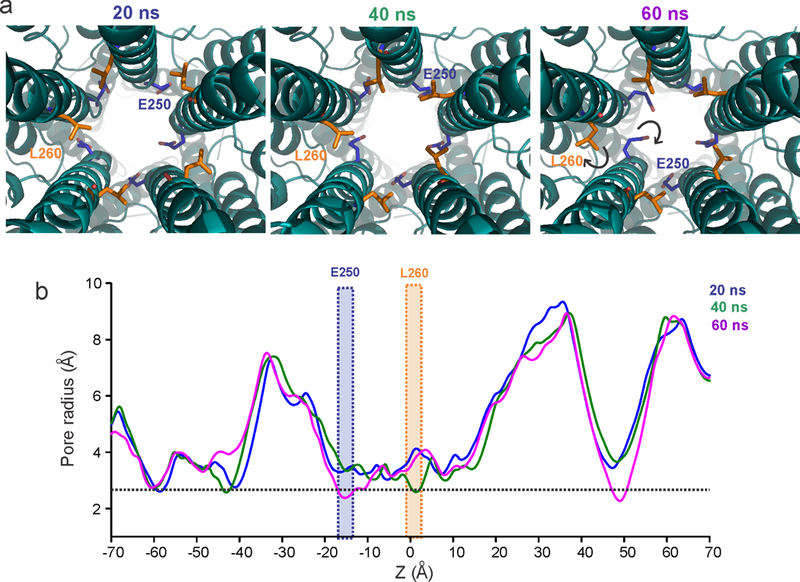
a, Sidechain orientations of Leu260 and Glu250 during different time points (indicated above) in the simulation. b, The corresponding pore radii profiles. The positions of Glu250 and Leu260 are highlighted.
Extended Data Figure 9. Comparison of pLGIC pore profiles.
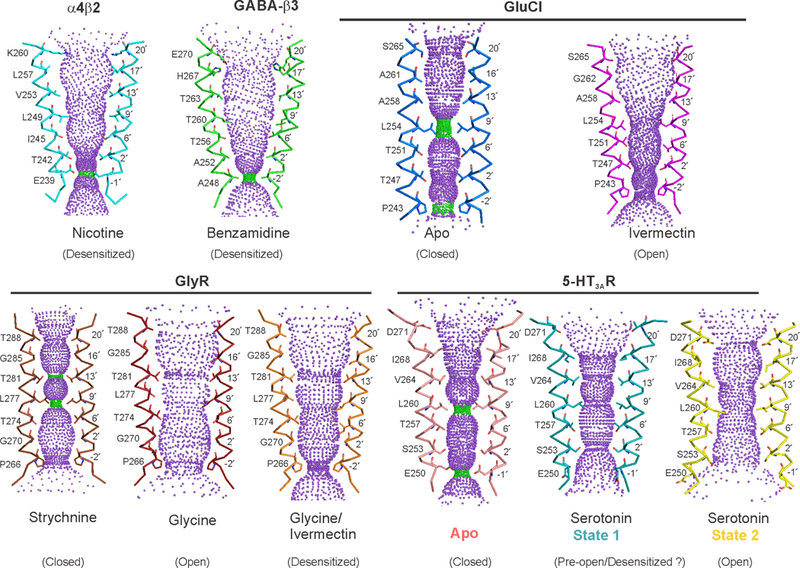
Pore profiles calculated using the HOLE program46 for the M2 region of nAChR (PDB ID: 5KXI)4, β3-GABA receptor (PDB ID: 4COF)7, GluCl (Apo- PDB ID: 4TNV59 and ivermectin-bound- PDB ID: 3RHW60), GlyR (strychnine-bound- PDB ID: 3JAD, glycine-bound- PDB ID: 3JAE, and glycine/ivermectin-bound- PDB ID: 3JAF)5 and 5-HT3AR (Apo- PDB ID: 6BE111, State 1- PDB ID: 6DG7, and State 2- PDB ID: 6DG8). Only two M2 helices are shown as ribbon for clarity. Pore facing residues are shown as stick representation. Green and magenta spheres define radii of 1.8–3.3 Å and > 3.3 Å, respectively.
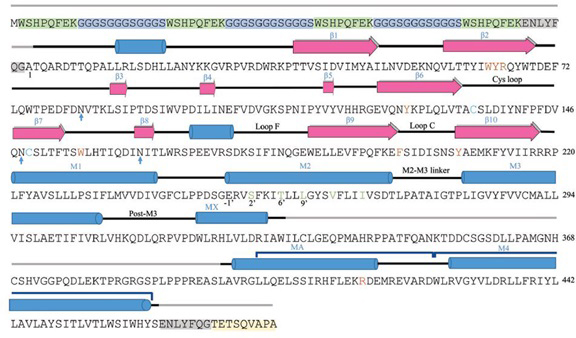
Extended Data Table 1:
Sequence of mouse 5-HT3AR used in the cryo-EM study and the data on cryo-EM and refinement. a, Full length mouse 5-HT3AR sequence used in the cryo-EM study. Regions in the sequence highlighted in green, blue, gray, and yellow represent strep-tag, linker, TEV cleavage site, and 1D4-tag, respectively. Secondary structural elements as seen in State 1 are plotted above the sequence. Loops in gray color are not seen in the final refined structure. All the important loops, sheets, and helices are labeled. Glycosylation sites are marked as blue arrows. Key residues within the serotonin-binding sites are highlighted in brown color. Cysteines present in the cys-loop are shown as cyan color. Pore-facing residues in M2 are shown in green color. Arg416 in the ICD is shown in red. b, Cryo-EM data collection, refinement and validation statistics.
| a |
 |
||
|---|---|---|---|
| b | State 1 (EMDB-7882) (PDB 6DG7) | State 2 (EMDB-7883) (PDB 6DG8) | |
| Data collection and processing | |||
| Magnification | 130,000x | ||
| Voltage (kV) | 300 | ||
| Electron exposure (e-/Å2) | 40 | ||
| Defocus range (µm) | −1.0 to −2.5 | ||
| Pixel size (Å) | 0.532 | ||
| Symmetry imposed | C5 | ||
| Initial particle images (no.) | 749,970 | ||
| Final particle images (no.) | 103,698 | 18,839 | |
| Map resolution (Å) | 3.32 | 3.89 | |
| FSC threshold | 0.143 | 0.143 | |
| Refinement | |||
| Initial model used (PDB code) | 6BE1 | 6BE1 | |
| Model resolution (Å) | 4.31 | 4.31 | |
| FSC threshold | 0.143 | 0.143 | |
| Map sharpening B factor (Å2) | −50 | −50 | |
| Model composition | |||
| Non-hydrogen atoms | 16,720 | 16,715 | |
| Protein residues | 16,175 | 16,175 | |
| Ligands | 545 | 540 | |
| B factors (Å2) | |||
| Protein | 154.41 | 244.56 | |
| Ligand | 133.45 | 169.20 | |
| R.m.s. deviations | |||
| Bond lengths (Å) | 0.004 | 0.004 | |
| Bond angles (°) | 1.032 | 1.031 | |
| Validation | |||
| MolProbity score | 1.53 (94th Percentile) | 1.56 (94th Percentile) | |
| Clashscore | 3.40 (97th Percentile) | 4.89 (94th Percentile) | |
| Poor rotamers (%) | 1.27 | 0.55 | |
| Ramachandran plot | |||
| Favored (%) | 95.61 | 95.61 | |
| Allowed (%) | 4.39 | 4.39 | |
| Disallowed (%) | 0.00 | 0.00 | |
Supplementary Material
Acknowledgements
This research was, in part, supported by the National Cancer Institute’s National Cryo-EM Facility at the Frederick National Laboratory for Cancer Research and we are very grateful for the imaging time. We thank the Cleveland Center for Membrane and Structural Biology for the access to the Cryo-EM instrumentation, Denice Major for assistance with hybridoma and cell culture at Department of Ophthalmology and Visual Sciences (NIH Core Grant P30EY11373), Dr. Walter F. Boron for kindly providing us Xenopus oocytes and unrestricted access of the oocyte rig, Gianni Klesse and Stephen Tucker for the Channel Annotation Package methodology. This work was supported by the NIH grant (1R01GM108921), the Cryo-EM supplement (3R01GM108921-03S1) to S.C and the AHA postdoctoral Fellowship to S.B (17POST33671152).
Footnotes
Competing Financial Interest: The authors declare that there is no competing financial interest.
Data Availability Statement
Accession Numbers-The coordinates of the 5-HT3AR structure and the Cryo-EM map has been deposited under PDB ID: 6DG7 (State 1) and 6DG8 (State 2); EMD ID: EMD-7882 (State 1) and EMD-7883 (State 2) with the wwPDB and EMDB. All relevant data are available from the authors.
References
- 1.Maricq AV, Peterson AS, Brake AJ, Myers RM & Julius D Primary structure and functional expression of the 5HT3 receptor, a serotonin-gated ion channel. Science 254, 432–437 (1991). [DOI] [PubMed] [Google Scholar]
- 2.Machu TK Therapeutics of 5-HT3 receptor antagonists: current uses and future directions. Pharmacol Ther 130, 338–347, doi:10.1016/j.pharmthera.2011.02.003 (2011). [DOI] [PMC free article] [PubMed] [Google Scholar]
- 3.Unwin N Refined structure of the nicotinic acetylcholine receptor at 4A resolution. J Mol Biol 346, 967–989 (2005). [DOI] [PubMed] [Google Scholar]
- 4.Morales-Perez CL, Noviello CM & Hibbs RE X-ray structure of the human alpha4beta2 nicotinic receptor. Nature 538, 411–415, doi:10.1038/nature19785 (2016). [DOI] [PMC free article] [PubMed] [Google Scholar]
- 5.Du J, Lu W, Wu S, Cheng Y & Gouaux E Glycine receptor mechanism elucidated by electron cryo-microscopy. Nature, doi:10.1038/nature14853 (2015). [DOI] [PMC free article] [PubMed] [Google Scholar]
- 6.Hassaine G et al. X-ray structure of the mouse serotonin 5-HT3 receptor. Nature 512, 276–281, doi:10.1038/nature13552 (2014). [DOI] [PubMed] [Google Scholar]
- 7.Miller PS & Aricescu AR Crystal structure of a human GABAA receptor. Nature 512, 270–275, doi:10.1038/nature13293 (2014). [DOI] [PMC free article] [PubMed] [Google Scholar]
- 8.Connolly CN Trafficking of 5-HT(3) and GABA(A) receptors (Review). Mol Membr Biol 25, 293–301, doi:10.1080/09687680801898503 (2008). [DOI] [PubMed] [Google Scholar]
- 9.Peters JA et al. The 5-hydroxytryptamine type 3 (5-HT3) receptor reveals a novel determinant of single-channel conductance. Biochem Soc Trans 32, 547–552, doi:10.1042/BST0320547 (2004). [DOI] [PubMed] [Google Scholar]
- 10.Baptista-Hon DT, Deeb TZ, Lambert JJ, Peters JA & Hales TG The minimum M3-M4 loop length of neurotransmitter-activated pentameric receptors is critical for the structural integrity of cytoplasmic portals. J Biol Chem 288, 21558–21568, doi:10.1074/jbc.M113.481689 (2013). [DOI] [PMC free article] [PubMed] [Google Scholar]
- 11.Basak S et al. Cryo-EM structure of 5-HT3A receptor in its resting conformation. Nat Commun 9, 514, doi:10.1038/s41467-018-02997-4 (2018). [DOI] [PMC free article] [PubMed] [Google Scholar]
- 12.Marcus Y Ionic Radii in Aqueous Solution. Chem. Rev 88, 1475–1498 (1988). [Google Scholar]
- 13.Panicker S, Cruz H, Arrabit C & Slesinger PA Evidence for a centrally located gate in the pore of a serotonin-gated ion channel. J Neurosci 22, 1629–1639 (2002). [DOI] [PMC free article] [PubMed] [Google Scholar]
- 14.Thompson AJ & Lummis SC A single ring of charged amino acids at one end of the pore can control ion selectivity in the 5-HT3 receptor. Br J Pharmacol 140, 359–365, doi:10.1038/sj.bjp.0705424 (2003). [DOI] [PMC free article] [PubMed] [Google Scholar]
- 15.Brejc K et al. Crystal structure of an ACh-binding protein reveals the ligand-binding domain of nicotinic receptors. Nature 411, 269–276 (2001). [DOI] [PubMed] [Google Scholar]
- 16.Kesters D et al. Structural basis of ligand recognition in 5-HT3 receptors. EMBO Rep 14, 49–56, doi:10.1038/embor.2012.189 (2013). [DOI] [PMC free article] [PubMed] [Google Scholar]
- 17.Hansen SB et al. Structures of Aplysia AChBP complexes with nicotinic agonists and antagonists reveal distinctive binding interfaces and conformations. Embo J 24, 3635–3646 (2005). [DOI] [PMC free article] [PubMed] [Google Scholar]
- 18.Beene DL et al. Cation-pi interactions in ligand recognition by serotonergic (5-HT3A) and nicotinic acetylcholine receptors: the anomalous binding properties of nicotine. Biochemistry 41, 10262–10269 (2002). [DOI] [PubMed] [Google Scholar]
- 19.Yuan S, Filipek S & Vogel H A Gating Mechanism of the Serotonin 5-HT3 Receptor. Structure 24, 816–825, doi:10.1016/j.str.2016.03.019 (2016). [DOI] [PubMed] [Google Scholar]
- 20.Sauguet L et al. Crystal structures of a pentameric ligand-gated ion channel provide a mechanism for activation. Proc Natl Acad Sci U S A 111, 966–971, doi:10.1073/pnas.1314997111 (2014). [DOI] [PMC free article] [PubMed] [Google Scholar]
- 21.Miyazawa A, Fujiyoshi Y, Stowell M & Unwin N Nicotinic acetylcholine receptor at 4.6 A resolution: transverse tunnels in the channel wall. J Mol Biol 288, 765–786 (1999). [DOI] [PubMed] [Google Scholar]
- 22.Kelley SP, Dunlop JI, Kirkness EF, Lambert JJ & Peters JA A cytoplasmic region determines single-channel conductance in 5-HT3 receptors. Nature 424, 321–324, doi:10.1038/nature01788 (2003). [DOI] [PubMed] [Google Scholar]
- 23.Hussy N, Lukas W & Jones KA Functional properties of a cloned 5-hydroxytryptamine ionotropic receptor subunit: comparison with native mouse receptors. J Physiol 481 ( Pt 2), 311–323 (1994). [DOI] [PMC free article] [PubMed] [Google Scholar]
- 24.McKinnon NK, Bali M & Akabas MH Length and amino acid sequence of peptides substituted for the 5-HT3A receptor M3M4 loop may affect channel expression and desensitization. PLoS One 7, e35563, doi:10.1371/journal.pone.0035563 (2012). [DOI] [PMC free article] [PubMed] [Google Scholar]
- 25.Hales TG et al. Common determinants of single channel conductance within the large cytoplasmic loop of 5-hydroxytryptamine type 3 and alpha4beta2 nicotinic acetylcholine receptors. J Biol Chem 281, 8062–8071, doi:10.1074/jbc.M513222200 (2006). [DOI] [PubMed] [Google Scholar]
- 26.Hu XQ, Sun H, Peoples RW, Hong R & Zhang L An interaction involving an arginine residue in the cytoplasmic domain of the 5-HT3A receptor contributes to receptor desensitization mechanism. J Biol Chem 281, 21781–21788, doi:10.1074/jbc.M600676200 (2006). [DOI] [PubMed] [Google Scholar]
- 27.Papke D & Grosman C The role of intracellular linkers in gating and desensitization of human pentameric ligand-gated ion channels. J Neurosci 34, 7238–7252, doi:10.1523/JNEUROSCI.5105-13.2014 (2014). [DOI] [PMC free article] [PubMed] [Google Scholar]
- 28.Yakel JL, Lagrutta A, Adelman JP & North RA Single amino acid substitution affects desensitization of the 5-hydroxytryptamine type 3 receptor expressed in Xenopus oocytes. Proc Natl Acad Sci U S A 90, 5030–5033 (1993). [DOI] [PMC free article] [PubMed] [Google Scholar]
- 29.Revah F et al. Mutations in the channel domain alter desensitization of a neuronal nicotinic receptor. Nature 353, 846–849 (1991). [DOI] [PubMed] [Google Scholar]
- 30.Basak S, Schmandt N, Gicheru Y & Chakrapani S Crystal structure and dynamics of a lipid-induced potential desensitized-state of a pentameric ligand-gated channel. Elife 6, doi:10.7554/eLife.23886 (2017). [DOI] [PMC free article] [PubMed] [Google Scholar]
- 31.Panicker S, Cruz H, Arrabit C, Suen KF & Slesinger PA Minimal structural rearrangement of the cytoplasmic pore during activation of the 5-HT3A receptor. J Biol Chem 279, 28149–28158, doi:10.1074/jbc.M403545200 (2004). [DOI] [PubMed] [Google Scholar]
- 32.MacKenzie D, Arendt A, Hargrave P, McDowell JH & Molday RS Localization of binding sites for carboxyl terminal specific anti-rhodopsin monoclonal antibodies using synthetic peptides. Biochemistry 23, 6544–6549 (1984). [DOI] [PubMed] [Google Scholar]
- 33.Stevens R, Rusch D, Solt K, Raines DE & Davies PA Modulation of human 5-hydroxytryptamine type 3AB receptors by volatile anesthetics and n-alcohols. J Pharmacol Exp Ther 314, 338–345, doi:10.1124/jpet.105.085076 (2005). [DOI] [PMC free article] [PubMed] [Google Scholar]
- 34.Thompson AJ & Lummis SC A single channel mutation alters agonist efficacy at 5-HT3A and 5-HT3AB receptors. Br J Pharmacol 170, 391–402, doi:10.1111/bph.12287 (2013). [DOI] [PMC free article] [PubMed] [Google Scholar]
- 35.Zhang Z & Chen J Atomic Structure of the Cystic Fibrosis Transmembrane Conductance Regulator. Cell 167, 1586–1597 e1589, doi:10.1016/j.cell.2016.11.014 (2016). [DOI] [PubMed] [Google Scholar]
- 36.Zheng SQ et al. MotionCor2: anisotropic correction of beam-induced motion for improved cryo-electron microscopy. Nat Methods 14, 331–332, doi:10.1038/nmeth.4193 (2017). [DOI] [PMC free article] [PubMed] [Google Scholar]
- 37.Fernandez-Leiro R & Scheres SHW A pipeline approach to single-particle processing in RELION. Acta Crystallogr D Struct Biol 73, 496–502, doi:10.1107/S2059798316019276 (2017). [DOI] [PMC free article] [PubMed] [Google Scholar]
- 38.Mindell JA & Grigorieff N Accurate determination of local defocus and specimen tilt in electron microscopy. J Struct Biol 142, 334–347 (2003). [DOI] [PubMed] [Google Scholar]
- 39.Tang G et al. EMAN2: an extensible image processing suite for electron microscopy. J Struct Biol 157, 38–46, doi:10.1016/j.jsb.2006.05.009 (2007). [DOI] [PubMed] [Google Scholar]
- 40.Kucukelbir A, Sigworth FJ & Tagare HD Quantifying the local resolution of cryo-EM density maps. Nat Methods 11, 63–65, doi:10.1038/nmeth.2727 (2014). [DOI] [PMC free article] [PubMed] [Google Scholar]
- 41.Collaborative Computational Project, N. The CCP4 suite: programs for protein crystallography. Acta crystallographica. Section D, Biological crystallography 50, 760–763, doi:10.1107/S0907444994003112 (1994). [DOI] [PubMed] [Google Scholar]
- 42.Emsley P & Cowtan K Coot: model-building tools for molecular graphics. Acta crystallographica. Section D, Biological crystallography 60, 2126–2132, doi:10.1107/S0907444904019158 (2004). [DOI] [PubMed] [Google Scholar]
- 43.Adams PD et al. PHENIX: building new software for automated crystallographic structure determination. Acta crystallographica. Section D, Biological crystallography 58, 1948–1954 (2002). [DOI] [PubMed] [Google Scholar]
- 44.Chen VB MolProbity: all-atom structure validation for macromolecular crystallography. Acta Crystallogr. D 66, 12–21 (2010). [DOI] [PMC free article] [PubMed] [Google Scholar]
- 45.Baker NA, Sept D, Joseph S, Holst MJ & McCammon JA Electrostatics of nanosystems: application to microtubules and the ribosome. Proc. Natl Acad. Sci. USA 98, 10037–10041 (2001). [DOI] [PMC free article] [PubMed] [Google Scholar]
- 46.Smart OS, Neduvelil JG, Wang X, Wallace BA & Sansom MS HOLE: a program for the analysis of the pore dimensions of ion channel structural models. J Mol Graph 14, 354–360, 376 (1996). [DOI] [PubMed] [Google Scholar]
- 47.Chovancova E CAVER 3.0: a tool for the analysis of transport pathways in dynamic protein structures. PLOS Comput. Biol 8, e1002708 (2012). [DOI] [PMC free article] [PubMed] [Google Scholar]
- 48.Stansfeld PJ & Sansom MS Molecular simulation approaches to membrane proteins. Structure 19, 1562–1572, doi:10.1016/j.str.2011.10.002 (2011). [DOI] [PubMed] [Google Scholar]
- 49.Jorgensen WL, Chandrasekhar J, Madura JD, Impey RW & Klein ML . Comparison of simple potential functions for simulating liquid water. J Chem Phys 926–935 (1983). [Google Scholar]
- 50.Berendsen HJC, van der Spoel D & van Drunen R GROMACS: a message-passing parallel molecular dynamics implementation. Comput Phys Commun 91, 43–56 (1995). [Google Scholar]
- 51.Abraham MJ, Murtola T, Schulz R, Pall S, and Jeremy C GROMACS: high performance molecular simulations through multi-level parallelism from laptops to supercomputers. SoftwareX 1, 19–25 (2015). [Google Scholar]
- 52.Jorgensen WL, Maxwell DS & Tirado-Rives J Development and testing of the OPLS all-atom force field on conformational energetics and properties of organic liquids. J Am Chem Soc 118, 11225–11236 (1996). [Google Scholar]
- 53.Darden T, York D & Pedersen L Particle mesh Ewald: an N⋅log(N) method for Ewald sums in large systems. J Chem Phys 98, 10089–10092 (1993). [Google Scholar]
- 54.Bussi G, Donadio D & Parrinello M Canonical sampling through velocity rescaling. J Chem Phys 126, 14101 (2007). [DOI] [PubMed] [Google Scholar]
- 55.Parrinello MR, Polymorphic A transitions in single crystals: a new molecular dynamics method. . J Appl Phys 52 (1981). [Google Scholar]
- 56.Hess B, Bekker H, Berendsen HJC & Fraaije JGEM LINCS: a linear constraint solver for molecular simulations. J Comput Chem 18, 1463–1472 (1997). [Google Scholar]
- 57.Trick JL et al. Functional Annotation of Ion Channel Structures by Molecular Simulation. Structure 24, 2207–2216, doi:10.1016/j.str.2016.10.005 (2016). [DOI] [PMC free article] [PubMed] [Google Scholar]
- 58.Cordes FS, Bright JN & Sansom MS Proline-induced distortions of transmembrane helices. J Mol Biol 323, 951–960 (2002). [DOI] [PubMed] [Google Scholar]
- 59.Althoff T, Hibbs RE, Banerjee S & Gouaux E X-ray structures of GluCl in apo states reveal a gating mechanism of Cys-loop receptors. Nature 512, 333–337, doi:10.1038/nature13669 (2014). [DOI] [PMC free article] [PubMed] [Google Scholar]
- 60.Hibbs RE & Gouaux E Principles of activation and permeation in an anion-selective Cys-loop receptor. Nature 474, 54–60, doi:10.1038/nature10139 (2011). [DOI] [PMC free article] [PubMed] [Google Scholar]
- 61.Wallace AC, Laskowski RA & Thornton JM LIGPLOT: a program to generate schematic diagrams of protein-ligand interactions. Protein Eng 8, 127–134 (1995). [DOI] [PubMed] [Google Scholar]
Associated Data
This section collects any data citations, data availability statements, or supplementary materials included in this article.


