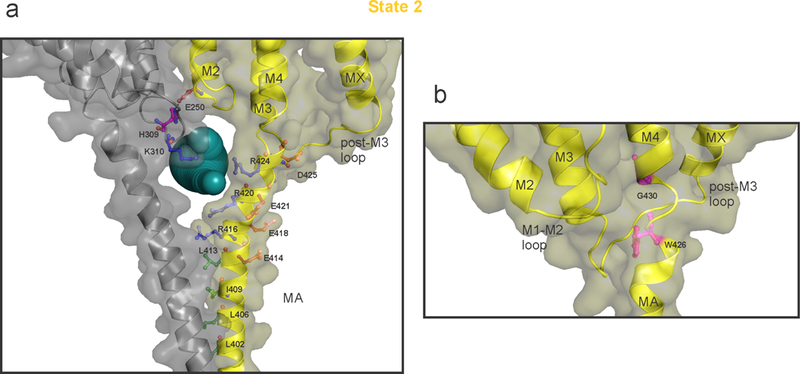
Extended Data Figure 6. The intracellular domain of State 2.

a, A detailed view of the ICD with key residues shown in stick representation. Only two adjacent subunits are shown for clarity. The solvent-accessible vestibule in the ICD calculated using Caver3.0 47 with a minimum cavity radius of 2.8 Å is shown as dark-cyan spheres. The positively charged residues lining the portal are shown as blue sticks. The negatively charged residues in the vicinity are shown in red-brown. Residues which form the hydrophobic patch at the N-terminal end of MA helix are shown as green sticks. Residues His309 (post-M3 loop) and Glu250 (M2) are in a potential interaction and shown in magenta. b, A zoomed view of the ICD to highlight the break in MA-M4 helices (highlighted in magenta) at Gly430. Glycine mediated TM helix distortion at (i-3 position) is well-studied58 and Gly430 may play a dynamic role at the hinge-point between MA and M4 helices. A similar bend in MA-M4 helix was previously observed in the Torpedo nAChR structure even in the absence of glycine at the equivalent position3.
