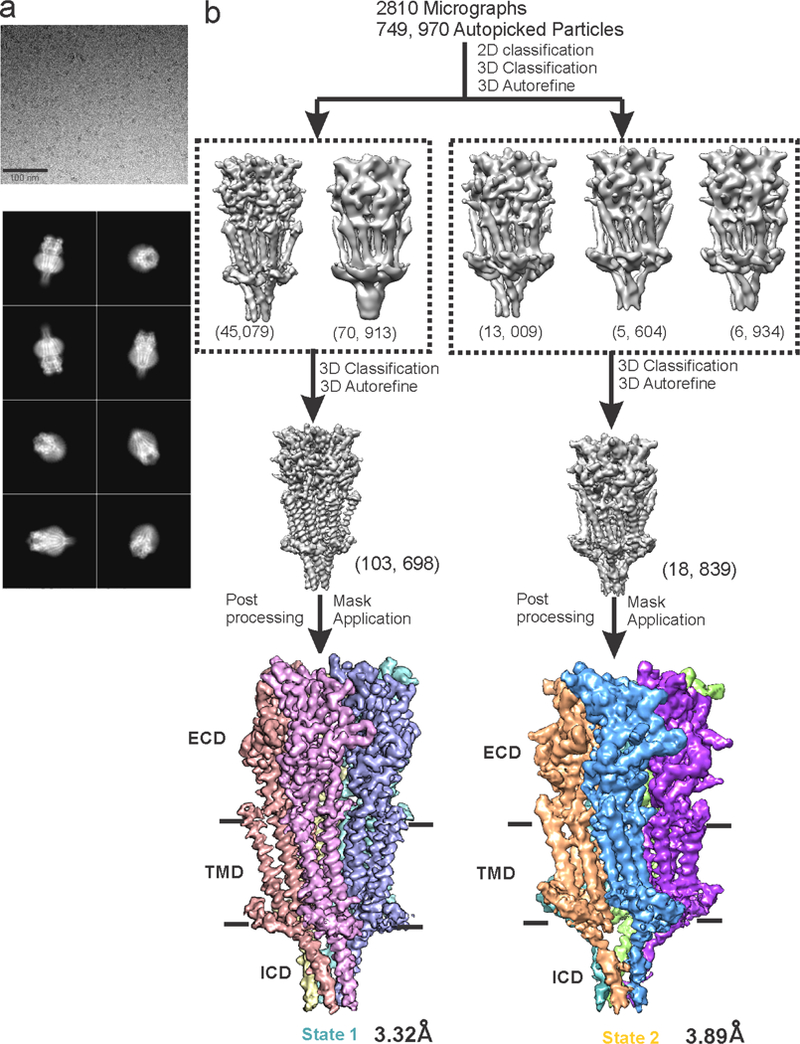
Extended Data Figure 1. Data processing workflow.

a, A representative micrograph of 5-HT3AR incubated with 100 μM serotonin in vitreous ice (top). Selected 2D classes showing various orientations (bottom). b, A schematic representation of the steps followed in data processing leading to 3.32 Å and 3.89 Å reconstructions of State 1 and State 2, respectively. Each subunit is shown in a different color for clarity. Classes within the boxes represent two distinct conformations. Based on the number of particles for each state, it appears that State 1 is more populated than State 2 under our current conditions.
