Abstract
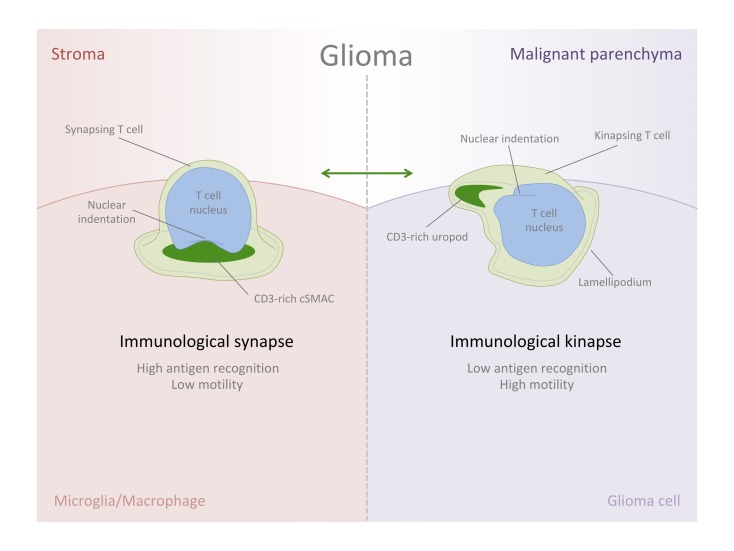
Since the proper activation of T cells requires the physical interaction with target cells through the formation of immunological synapses (IS), an alteration at this level could be a reason why tumors escape the immune response. As part of their life cycle, it is thought that T cells alternate between a static phase, the IS, and a dynamic phase, the immunological kinapse (IK), depending on high or low antigen sensing. Our investigation performed in tissue samples of human glioma shows that T cells are able to establish synapsing interactions not only with glioma tumorigenic cells, but also with stromal myeloid cells. Particularly, the IS displaying a T cell receptor–rich (TCR-rich) central supramolecular activation cluster (cSMAC) is preferentially established with stromal cells, as opposed to malignant cells. Conversely, T cells in the malignant areas showed distinct morphometric parameters compared with nonneoplastic tissue — the former characterized by an elongated shape, well-suited to kinaptic dynamics. Importantly, high-resolution 3-dimensional analyses demonstrated the existence of bona-fide IK preferentially arranged in malignant areas of the tumor. This imbalance of IS/IK states between these 2 microenvironments reveals the low antigenic sensing of T cells when patrolling tumorigenic cells and reflects the immunoevasive environment of the tumor.
Keywords: Immunology
Keywords: Brain cancer
Using high-resolution imaging, immune synapses and kinapses are visualized in patient-derived glioblastoma multiforme tumor tissue.
Introduction
Cancer immunotherapies targeting T cells, and particularly blocking immune checkpoints, are theoretically a promising option for tumor elimination, including glioma (1). However, not every patient responds equally to the treatment, the response being sometimes irrelevant or unexpectedly detrimental in dramatic cases (2–4). Thus, exploring the behavior of T cells within the tumorigenic tissue and their cell-to-cell interactions becomes crucial to understanding immuno-oncology and better defining future immune-based therapeutics.
Activation of T cells requires physical contact with antigen-presenting cells (APCs) through the formation of the immunological synapse (IS) (5). After antigen recognition by CD3/T cell receptor (TCR) complexes, T cells become activated and arrange a particular intercellular and symmetric interface with target cells, establishing a characteristic bull’s eye structure, involving the segregation and clustering of a group of molecules and organelles (6, 7). Importantly, as initially described by Kupfer, T cells organize a CD3/TCR-rich central supramolecular activation cluster (cSMAC) surrounded by lymphocyte function–associated antigen (LFA-1) that segregates to the periphery of the interface forming a ring-shape cluster, named peripheral-SMAC (pSMAC), surrounded as well by a CD45-enriched distal SMAC (dSMAC) (8). Alternatively to IS engagement and as part of their life cycle, T cells dynamically patrol the environment and constantly search for antigens, maintaining a highly motile behavior until forming new stable contacts when antigen sensing is sufficient (9, 10). In this motile state, described as immunological kinapse (IK) and interchangeable with stable IS, a particular subcellular distribution is arranged, formed by a leading lamellipodium, followed by a central lamella and a trailing uropod (11). Hence, the TCR-rich cluster, corresponding to the cSMAC, is segregated to the posterior tail of the motile T cell, the uropod, whereas pSMAC molecules are distributed to the lamella (5), adopting an asymmetric and directional shape. In this phase, the leading lamellipodium functions as a highly sensitive structure (12) dynamically searching for antigens in contrast with the static IS formation. Therefore, it is thought that T cells alternate between IS/IK states (a symmetrization and symmetry–breaking cycle), being 2 inter-convertible states that, when altered, could lead to immunopathology (5).
Lymphocytes form stable contacts in tumors expressing their cognate antigen (13), and — particularly — T cells that populate gliomas are able to engage with target cells to form bona-fide IS (14). However, despite the SMAC formation, the cytotoxic effectiveness of T cells in malignant glioma or glioblastoma multiforme (GBM) is low or at least inefficient to eliminate the tumor (14), along with a high profiling of Tregs that contributes to this low level of efficacy (15, 16). Thus, in this pathological scenario, T cells may undergo small but pivotal alterations at the level of IS arrangement, or subsequent TCR signaling and activation, impeding their correct functioning. In fact, the biological significance of the Kupfer-type IS in glioma remains debated as to whether SMAC formation may be crucial for tumor clearance (17, 18).
Importantly, many immunotherapies, such as the use of neutralizing antibodies against PD-1/PD-L1 immune checkpoint that target T cells, are thought to facilitate the formation of the IS (19). In fact, PD-1 appears to be concentrated in IS (20), forming microclusters at the cSMAC level to inhibit CD3/TCR receptor signaling through the phosphatase SHP2 (21). This way, alterations at this molecular level could be key to enable immune escape.
To date, the visualization of subcellular clusters of T cells with enough resolution in human tissue remains challenging and scarcely explored, but it is clearly indispensable for fully understanding T cell kinetics, especially in current immuno-oncology research. Consequently, imaging immune synaptic interactions and T cell structural and motile cycles in solid tumors is essential to grasp its physiological meaning and especially to understand the potential imbalance of IS/IK states that may lead to immunopathology (5).
Previous studies with fixed tissue multilabeling and 3-D imaging have facilitated the visualization of SMAC signatures in the brain (22), including human glioma (14); however, the high resolution and volumetric visualization of kinapses in tissue, especially outside lymphoid organs, has been subtle.
In the present study, we postulate that T cells in tumorigenic areas may present a high ratio of motility and kinaptic characteristics, and we image in high resolution whether the balance of IS/IK is altered in the 2 distinct histological regions, neoplastic and nonneoplastic, of human glioma samples.
We focused our examination on high-grade glioma cases, which presented elevated infiltration of T cells and a substantial percentage of Tregs. Our 3-D imaging technology of biopsy-tissue blocks allowed the visualization of bona-fide IK with a high level of detail, showing particular morphometric parameters and TCR-rich uropods. These IK are especially frequent in malignant regions of the tumors in alternate balance with a low occurrence of IS. Interestingly, the opposite phenomenon, with inverted IK/IS balance, was seen in stromal areas.
Our results, demonstrating the presence and high frequency of IK in malignant areas of human GBM tissue, suggest the difficulty of T cells in recognizing antigens on glioma cells. Importantly, this contrasts with the high density of IS found in stromal areas, which implies an imbalance of IS/IK that may correlate with T cell anergy in tolerogenic states in GBM. Thus, the intervention in the dynamic states of glioma-infiltrated T cells may be critical to modulate T cell activation and/or anergy, representing fundamental aspects for designing effective immunotherapies.
Results
Elevated T cell infiltration is associated with highly proliferative gliomas.
In order to study the IS/IK balance of T cells inside solid tumors, we analyzed the biopsies of a cohort of 15 glioma patients ranging from low-grade to high-grade glioma (Supplemental Table 1; supplemental material available online with this article; https://doi.org/10.1172/jci.insight.120757DS1), considering the proliferation parameter Ki67 and standard glioma markers such as vimentin and glial fibrillary acidic protein (GFAP) expression, provided by the clinical anatomopathological diagnosis. Samples showed typical histological glioma features (Supplemental Figure 1, A–C) and, in all cases, but with different range density, CD3+ T cells populated GFAP or vimentin immunoreactive areas (Supplemental Figure 1D and Supplemental Figure 2A) and were distributed either in vascular or parenchymal areas (Supplemental Figure 2B). Fluorescence confocal microscopy revealed that T cells often accumulated at blood vessel edges but were also able to cross the endothelium and penetrate the tumor parenchyma (Supplemental Figure 2, C and D). Stereological quantification of the samples revealed a significant increase of CD3+ T cell infiltration in parenchymal areas in contrast with vascular areas, in highly proliferative gliomas (Supplemental Figure 2, E–H). Importantly, both T lymphocyte subpopulations CD8+ and CD4+ were seen homing into the tumors in the analyzed cohort of glioma samples (Supplemental Figure 3). Conversely, as a control, patrolling T cells were scarcely seen in nonpathological human brain cortex and were only observed in apposition to vascular walls and protoplasmic astrocytes (Supplemental Figure 4). Since the significant homing of T cells was associated with highly proliferative gliomas, we focus on the subgroup of biopsies from patients classified as grade IV gliomas or GBM for the following 3-D high-resolution analyses.
Parenchyma-infiltrated CD3+ T cells populate malignant and stromal areas establishing cellular contacts.
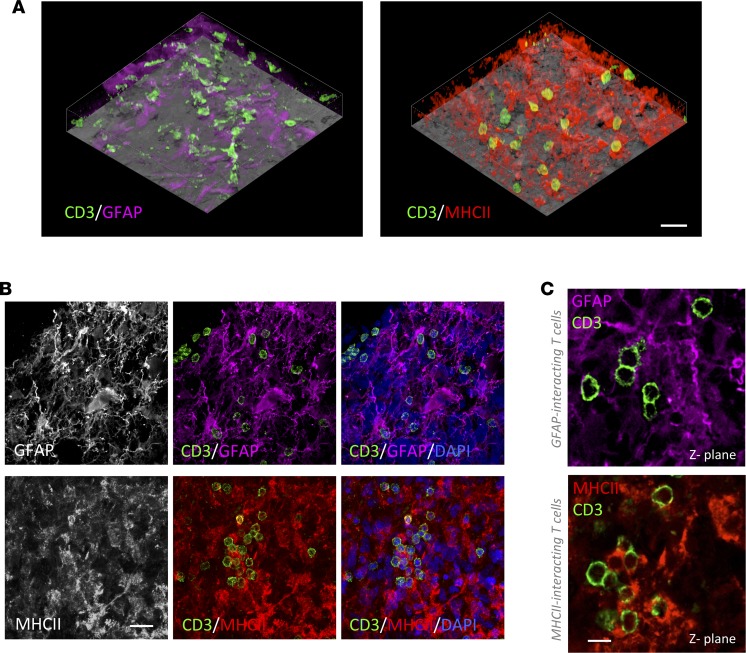
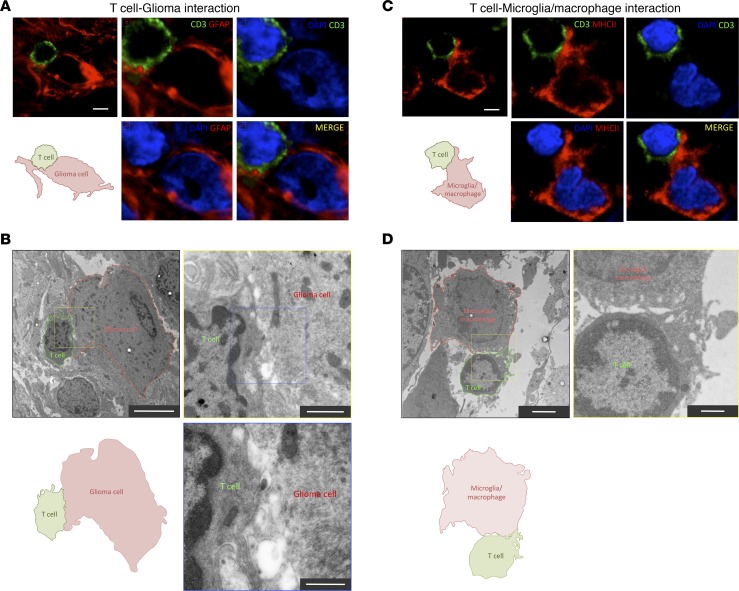
In order to elucidate the particular dynamics of infiltrated lymphocytes within the tumor tissue, we analyzed with fluorescent multilabeling the intercellular appositions of CD3+ T cells comparing malignant with stromal areas. Since microglia/macrophages are the preeminent cell filling GBM stroma (23), we used antibodies against GFAP to label neoplastic glioma cells, massively populating malignant areas, and antibodies against HLA-DR (human form of MHCII) to label nonneoplastic microglia/macrophages populating the stroma (Supplemental Figure 5A). Additionally, we confirmed the identity of MHCII+ cells as microglia/macrophages using antibodies against Iba-1 (Supplemental Figure 6). Three-dimensional transparencies of tissue blocks revealed that both tumorigenic malignant areas (GFAP-rich) and stromal areas (MHCII-rich) of the tumor were highly infiltrated by CD3+ T cells (Figure 1A and Supplemental Videos 1 and 2). More importantly, detailed microscopic analyses demonstrated that infiltrated lymphocytes frequently interacted with either GFAP+ or MHCII+ cells (Figure 1, B and C). For this analysis, we ruled out the possibility of using an anti-vimentin antibody because, despite marking tumor cells, it also labels microglia/macrophages (Supplemental Figure 5D), and it is not possible to distinguish tumorigenic cells from stromal cells with this marker. We also verified at the malignant-stromal intersections that GFAP+ tumor cells do not express detectable levels of MHCII, demonstrating that both markers label clearly distinct populations of cells (Supplemental Figure 5, B and C). Confocal and electron microscopy reflected intimate and membrane-to-membrane appositions of T cells with both glioma cells (Figure 2, A and B) and microglia/macrophages (Figure 2, C and D).
Figure 1. Infiltrated T cells in human GBM interact with both malignant GFAP+ cells and stromal MHCII+ cells.
(A) Tissue block transparencies allow the visualization of T cells (CD3+) infiltrated in malignant GFAP–rich and stromal MHCII–rich areas. Scale bar: 30 μm. (B) Images of the top panel show infiltration of T cells in GFAP+ tumor areas. Tumor cells are labeled with GFAP, and the infiltration of T cells can be clearly visualized within the tumor parenchyma. Nuclei are stained with DAPI. Images of the bottom panel reveal T cell infiltration in MHCII+ tumor areas. MHCII+ populated areas are infiltrated by T cells. Nuclei are visualized with DAPI. Scale bar: 20 μm. (C) Images of single 0.5 μm Z-planes show T cells interacting with GFAP+ cells or MHCII+ cells. Scale bar: 10 μm.
Figure 2. Evidence of bona fide T cell interactions with tumor and myeloid cells.
(A) High-resolution confocal scanning of a T cell–glioma cell interaction from a human GBM biopsy. A CD3+ T cell (green) contacts a GFAP+ glioma cell (red). A schematic diagram illustrates the interaction. Additional images show a zoom-in scanning at the interface of the interaction. In MERGE image, CD3 arrangement forms interdigitations with GFAP structures of the target cell. Scale bar: 5 μm. (B) Electron microscopy of a T cell–glioma cell interaction in a human GBM biopsy. A lymphocyte (outlined in green) interacting with a glioma cell (outlined in red) is depicted. Scale bar: 5 μm. A schematic diagram of the interaction is illustrated. (Top right) Higher magnification of the interface is shown from the indicated yellow square. Scale bar: 2 μm. The area of interaction presents some interdigitations of pseudopods. (Bottom right) Higher magnification is showed from the blue square. Scale bar: 500 nm. (C) High-resolution confocal scanning of a T cell establishing a close apposition with a MHCII+ cell in human GBM biopsy. A T cell is labeled with CD3 (green), and microglia/macrophages are visualized with MHCII (red) staining. A schematic diagram illustrates the interaction. Additional images show a zoom-in at the interface of the interaction. Scale bar: 5 μm. (D) Electron microscopy of a T cell–macrophage interaction in a human GBM biopsy. A lymphocyte (outlined in green) interacting with a myeloid cell (outlined in red) is depicted. Scale bar: 2 μm. A schematic diagram of the interaction is illustrated. (Top right) Higher magnification of the interface is shown from the yellow square. Scale bar: 500 nm.
Interacting T cells preferentially establish IS with MHCII+ cells in GBM.
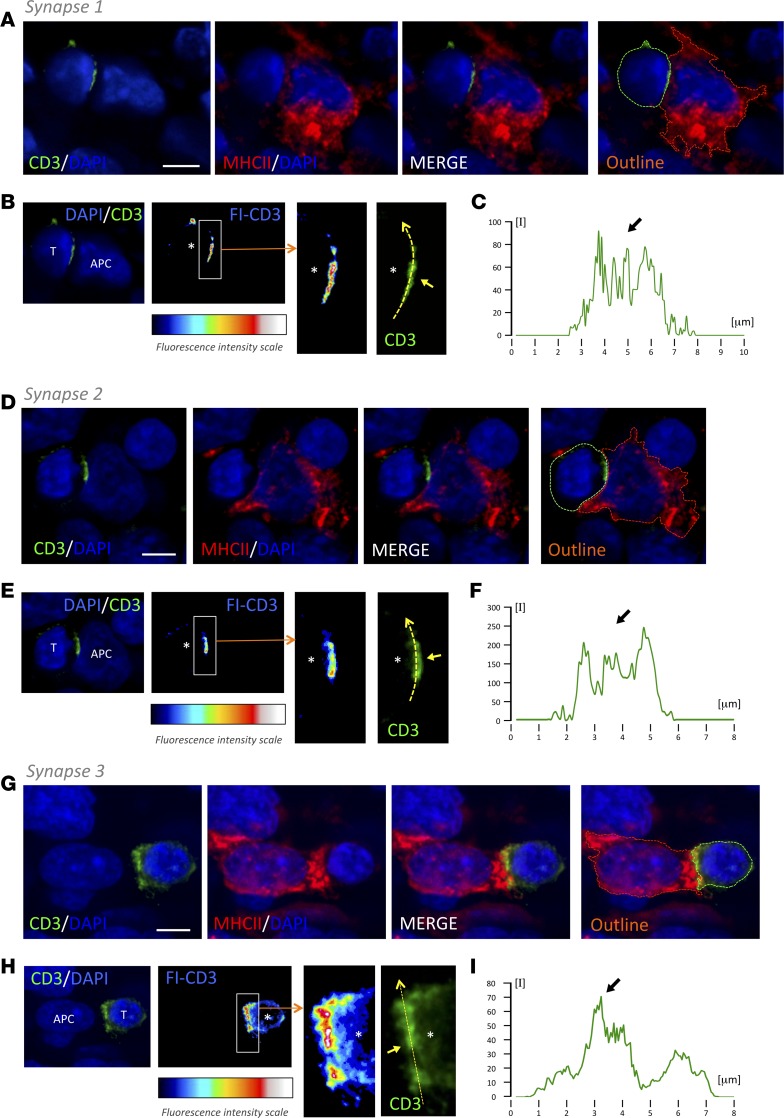
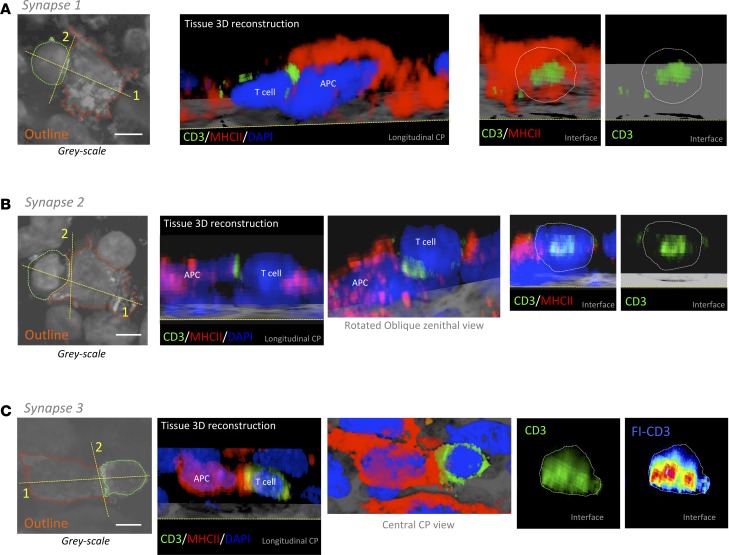
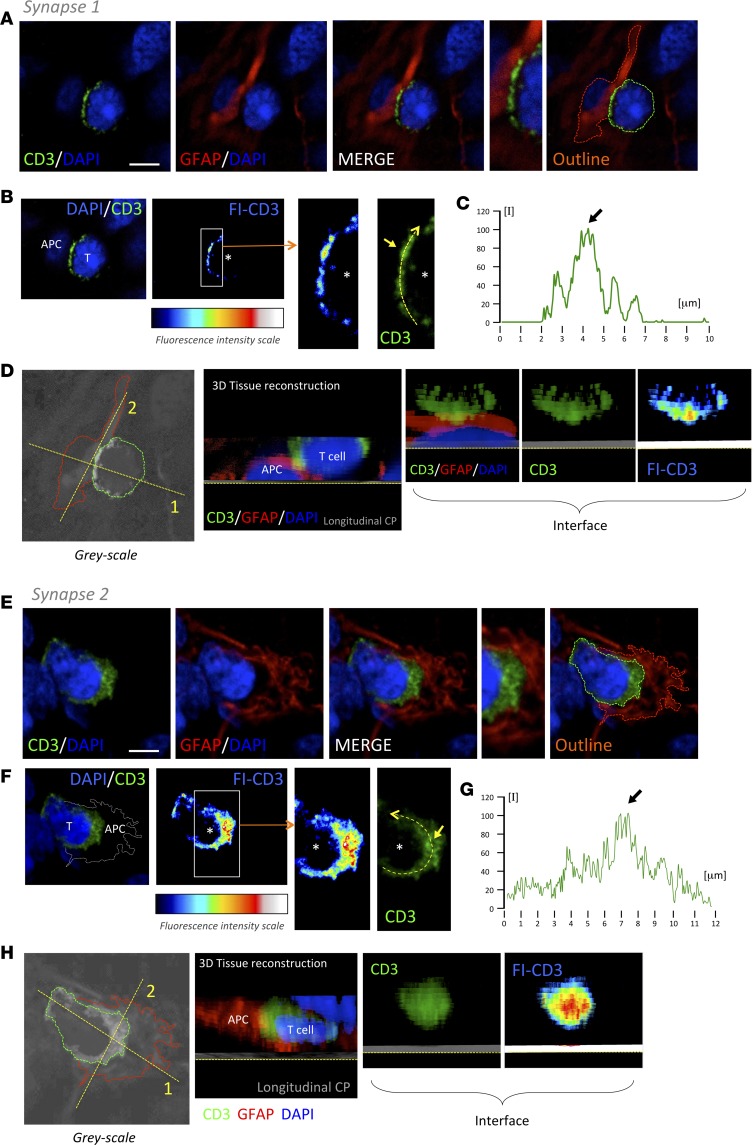
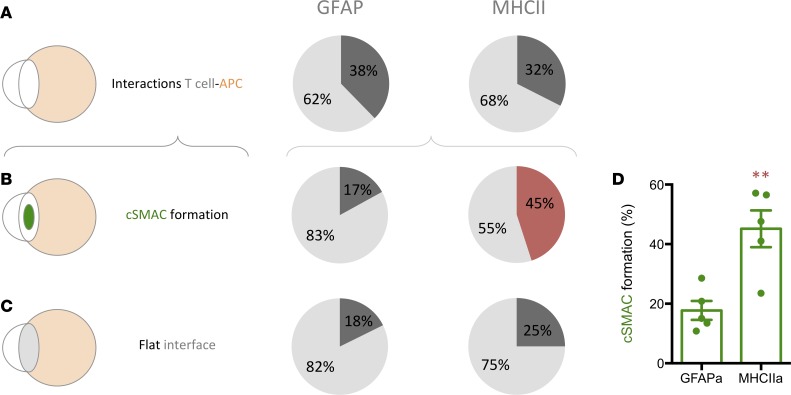
Three-dimensional high-resolution confocal microscopy of thick tissue blocks from biopsies revealed the formation of TCR/CD3 features of IS. We combined antibodies against CD3 with either anti-MHCII or anti-GFAP antibodies and systematically scanned for events of intercellular interactions. Importantly, the polarization and formation of the discrete TCR/CD3 central cluster, cSMAC, at interfaces with target cells was distinguished and imaged in 3 dimensions (Figures 3, 4, and 5). The segregation of TCR/CD3 could be analyzed with a fluorescence intensity scale, as well as with measurements of relative fluorescence. Representative examples of IS of T cell–MHCII+ cell and T cell–GFAP+ cell are shown (Figures 3, 4, and 5, and Supplemental Videos 3 and 4). The quantification of these events in 3-D stacks has shown that, despite the almost identical occurrence of T cell–target interactions in GFAP-rich and MHCII-rich areas, the frequency of cSMAC formation with MHCII+ target cells (45.1 ± 6.1) represents more than double that of the cSMAC frequency observed with GFAP+ target cells (accounting for only 17.7 ± 6.1), suggesting that tumor-infiltrated T cells actively engage with antigens presented by MHCII+ cells but, on the contrary, show a reduced engagement with antigens exhibited by GFAP+ cells (Figure 6). This is coherent with the high density of CD4+ T cells present at vascular surroundings where MHCII+ cells are also abundant (Supplemental Figure 3, C and D). Since MHCII+ stromal microglia/macrophages specifically present antigens to tumor-infiltrated CD4+ T cells, suggesting that this activation may favor the increase of the regulatory arm, we also analyzed the percentage of population of Tregs within the tumor in our biopsy cohort using FOXP3+ immunostaining. We observed the presence of Tregs in the tumors with an increased percentage in highly anaplastic cases (Supplemental Figure 7).
Figure 3. T cells form TCR/CD3 cSMAC at the T cell–MHCII interacting interface.
Three-dimensional confocal analyses of 3 representative examples of T cell cSMAC formation with MHCII-expressing cells within GBM tissue (synapse 1 [A, B, and C], synapse 2 [D, E, and F], and synapse 3 [G, H, and I]). (A, D, G) T cell, evidenced by CD3 (green), establishes a close apposition with a MHCII+ cell (red). Cell nuclei are counterstained with DAPI (blue). Outlines of the 2 interacting cells are also illustrated (green and red broken lines). (B, E, H) At the level of the interface between the T cell and the APC, we visualized the intensity of CD3 fluorescence (FI-CD3), according to the fluorescence intensity scale, and we observed an increase in CD3 at the center of the interaction. A higher magnification of the white rectangle is shown. Asterisks indicate the location of the T cell. Regular green channel fluorescence intensity was measured along the yellow broken arrow, and it is illustrated in graphs C, F, and I. Arrows indicate the cSMAC CD3-high fluorescent areas. Scale bars: 5 μm.
Figure 4. Three-dimensional reconstructions of synapses.
Outlines of the 2 interacting cells are illustrated for each synapse from Figure 3 (green and red broken lines) in A, B, and C. Considering the planes 1 (longitudinal) and 2 (interface) indicated with yellow broken lines in the outlines, 3-D reconstructions of the interacting cells (CD3/MHCII/DAPI) are shown in the respective clipping planes (CP) to observe the CD3 clusters. At interfaces, a white broken line outlines the T cell body limit. In the case of synapse 2, a rotated oblique zenithal view is shown. Regarding synapse 3, we also show a central CP view, and because CD3/TCR expression occupies the entire interface, we use the fluorescence intensity scale to visualize the cSMAC. Scale bars: 5 μm.
Figure 5. T cells form TCR/CD3 cSMAC at the T cell–GFAP+ cell interacting interface.
Three-dimensional confocal analyses of 2 representative examples of T cell cSMAC formation with GFAP-expressing cells within GBM tissue (synapse 1 [A, B, C, and D] and synapse 2 [E, F, G, and H]). (A and E) T cell, evidenced by CD3 (green), establishes a close apposition with a GFAP+ cell (red). Cell nuclei are counterstained with DAPI (blue). (B and F) At the level of the interface between the T cell and the APC illustrated in A and E, we visualized the intensity of CD3 fluorescence (FI-CD3), according to the fluorescence intensity scale, and we observed an increase in CD3 at the center of the interaction. A higher magnification of the white rectangle is shown. Asterisks indicate the location of the T cell. The CD3 intensity in the regular green channel represented was measured along the yellow broken arrow. The measurement of the intensity at this level is illustrated in graphs C and G. Arrows indicate the cSMAC high fluorescent areas. (D and H) Over gray-scale color, outlines of the 2 interacting cells are illustrated (green and red broken lines). Considering the planes 1 and 2 (yellow broken lines) illustrated, a 3-D reconstruction of the interacting cells (CD3/MHCII/DAPI) are shown in a longitudinal clipping plane (CP) and a CP at the interface to observe the CD3 cluster at the intercellular interaction. Scale bars: 5 μm.
Figure 6. T cells preferentially establish TCR/CD3 central cluster with MHCII+ cells in human GBM.
Percentages of infiltrated T cells interacting with either GFAP+ or MHCII+ cells in 3-D confocal scanning of GBM biopsies. (A) Infiltrated T cells establish interactions in the same proportion with GFAP+ and MHCII+ cells. (B) Interacting T cells establish TCR/CD3 cSMAC preferentially with MHCII+ cells. (C) An increase, although not significant, of the formation of flat interfaces can be observed between T cells and MHCII+ cells. (D) The percentage of T cells forming cSMAC is significantly higher when interacting with MHCII+ cells compared with GFAP+ cells. **P < 0.01, Student t test.
Infiltrated T cells preferentially show kinetic morphology in GFAP areas.
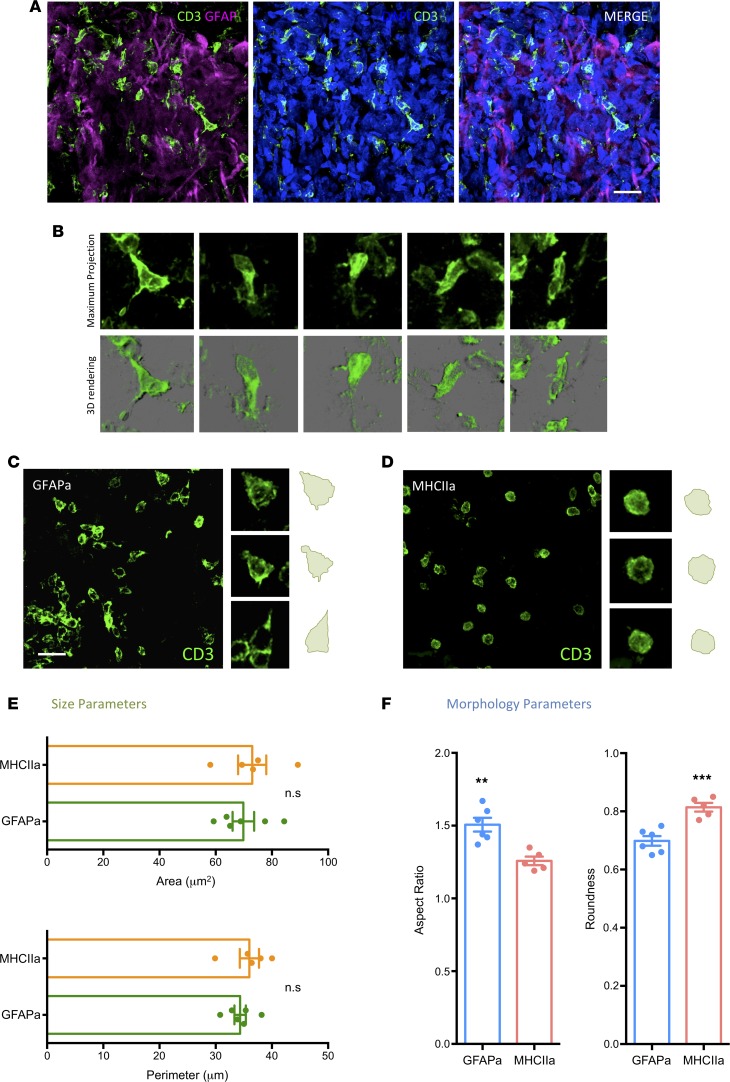
Considering that decreased levels of IS formation would be balanced with an increase of kinapses (19), and because a reduced antigen engagement may result in higher motility of the cells (9), we analyzed the morphometric aspects of T cells in tumorigenic GFAP-rich areas to compare with stromal MHCII-rich sites. T cells in abundant glioma cell locations show a distinctive kinetic morphology characterized by a typical elongated shape (Figure 7A), where in some cases, a leading lamellipodium and a trailing uropod can be appreciated (Figure 7B). Morphometric analyses of our captured data revealed significantly reduced roundness, together with an increased aspect ratio (Figure 7, C–F) in T cells of GFAP-rich tumorigenic locations, compatible with higher restlessness and reduced antigen-engagement; this is in contrast with MHCII-rich sites, where T cells appear rounded, compatible with static IS and higher frequency of antigen engagement. This increase of kinaptic morphology in malignant areas is consistent with a dynamic desensitization to antigens (24), and it could be facilitated by the expression of immune checkpoints on glioma cells, such as PD-L1 (25, 26), which is an immune suppressive pathway in tumors (27) and induces the TCR-stop signal, in contrast with CTLA-4 (28).
Figure 7. Presence of T cells with elongated morphology in human GBM compatible with kinaptic dynamics.
(A) Representative confocal scanning of tumorigenic parenchyma from a human GBM biopsy. Infiltrated T cells marked with CD3 (green) populating tumor areas identified by the presence of highly reactive GFAP+ cells (magenta). Counterstaining with DAPI (blue) is shown for nuclei identification and to illustrate the hypercellularity of the area. The MERGE channel is also depicted. (B) Examples of T cells with elongated shape captured from the scan represented in A. The top panel shows the maximum intensity projection of the scanned tissue block, whereas the bottom panel shows a 3-D reconstruction of the same cells. Morphometric analyses of T cells populating GFAP-rich glioma areas (GFAPa) (C) in comparison with MHCII-rich stromal areas (MHCIIa) (D) revealed significant elongation of cells in the former, meaning that even though the size of T cells revealed no significant changes between the 2 tumor locations (E), T cells appear significantly elongated in tumorigenic areas (GFAPa) in comparison with stromal areas (MHCIIa) (F). Scale bars: 20 μm. **P < 0.01 and ***P < 0.001, Student t test and Mann-Whitney U test.
Bona fide IK are abundant in malignant areas.
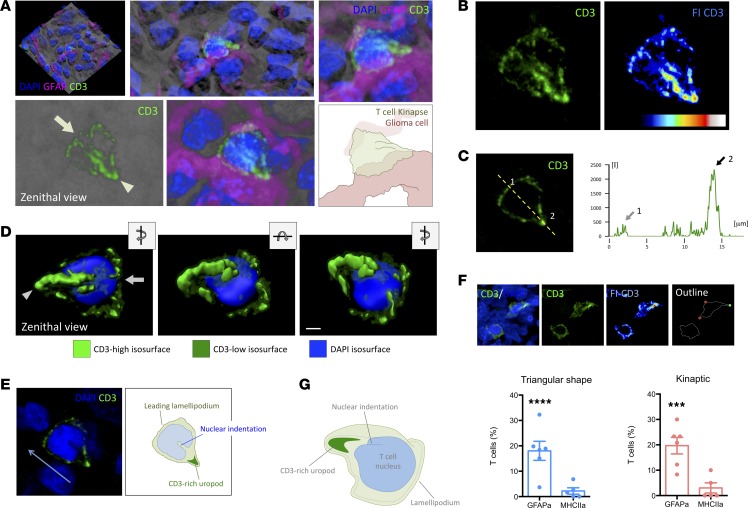
A detailed high-resolution 3-D rendering demonstrated the typical kinaptic microanatomy of the T cells, with high occurrence in malignant areas of the tumors, showing the typical triangular shape with a front edge or lamellipodium and a TCR-rich trailing uropod (Figure 8, A–C, and Supplemental Video 5). Volumetric rendering allowed building different isosurfaces for the high and low fluorescence intensity of CD3/TCR to distinguish the microanatomical distribution of CD3 and the architecture of the kinapse, especially regarding the high spreading and intensity of CD3 at the trailing uropod (Figure 8D, and Supplemental Video 6). Interestingly, the indentation of the T cell nucleus appears oriented to the back of the cell (Figure 8E), corresponding to the location of the microtubule-organizing center (MTOC) and the Golgi, as previously defined in vitro (29). We quantified the T cells exhibiting a characteristic kinapse, including the T cells presenting a CD3-high fluorescent uropod, evidenced by the rainbow intensity scale, in both malignant and stromal areas (Figure 8F). We observed strong significant differences between the 2 GBM areas (Figure 8F), with the proportion of bona-fide IK in malignant areas being dramatically higher than in stromal areas.
Figure 8. Bona fide IK are more abundant in malignant areas of human GBMs.
(A) Three-dimensional rendering of a confocal scanning of the tissue block biopsy containing T cells. Higher magnification of the reconstructed transparency shows a representative CD3+ T cell with kinaptic morphology (green). Zenithal view of the kinaptic T cell reveals the characteristic triangular shape with a clear leading lamellipodium (arrow) and TCR/CD3-rich uropod (arrowhead). The visualization of the GFAP+ adjacent tumor cells (magenta) and DAPI+ nuclei (blue) revealed close apposition with malignant cells. Zoom-in image of the transparency-based reconstruction displays the shape and details of the CD3 distribution. Magnification, 2×. An illustration depicting the interpretation of the T cell shape is also shown. (B) Confocal transparency projection shows the distribution of CD3 with higher fluorescence intensity at the trailing uropod. Fluorescence intensity scale (FI-CD3) evidences the uropod highly fluorescent. (C) Measurement of the relative fluorescence of CD3 along the yellow broken line revealed a scarce increase of fluorescence at the front lamellipodium (arrow 1) but a high increase at the uropod (arrow 2). (D) Three-dimensional isosurface rendering of kinaptic cell distinguishing the areas with low and high CD3 intensity and nucleus. Zenithal view, slight rotation of the x axis, and slight rotation of the z axis are shown. Scale bar: 2 μm. (E) Central optical plane of the T cell kinapse shows the orientation of the nuclear indentation toward the uropod, suggesting the direction of the motile T cell (blue arrow). A diagram for interpretation is also shown. (F) Examples of T cells with either regular rounded or triangular shape, and the latter with a high fluorescent CD3+ uropod. On the outline, red circles limit the leading front, and green circle indicates the CD3-rich uropod of the kinaptic T cell. Graphs show the quantification of percentages of T cells with triangular shape and with bona fide IK. ***P < 0.001 and ****P < 0.0001, Student t test and Mann-Whitney U test. (G) Illustrative diagram of the shape of a human T cell kinapse in a malignant area.
Since malignant areas lacked MHCII, we hypothesized that cytotoxic T lymphocytes (CTLs) would be preferentially located in this tumor environment. After corroborating the expression of CD3 by CD8+ T cells with double immunolabeling (Supplemental Figure 8A), we examined the presence of CD8+ T cells in the malignant areas. We observed a wide distribution of CTLs within the GFAP-rich tumor parenchyma (Supplemental Figure 8B), which were frequently seen interacting with glioma cells and showing kinaptic shape (Supplemental Figure 8, C–E). To rule out whether only CTLs were populating malignant areas, we multiple labeled the samples with CD3, CD8, and GFAP. We observed that both CTLs and non-CTLs were present in GFAP-rich areas, showing morphologies compatible with kinaptic dynamics (Supplemental Figure 9).
Discussion
This study demonstrates that characteristic IK are formed in vivo in humans, and it shows that the balance with their symmetric phase, the IS, can be altered in pathological conditions. The high IK frequency seen in malignant GBM areas indicates that T cells may experience anergy, entering a tolerogenic state preventing tumor immunity.
Our report shows that T cells, including CD8 and CD4 subsets (Supplemental Figure 3), vastly infiltrate the tissue in high-grade proliferative gliomas in concordance with previous knowledge (30) but implying tangible parenchymatose homing and endothelial crossing (Supplemental Figure 2). Importantly, T cells populate both malignant and stromal areas of the tumor ,as visualized in tissue block confocal transparencies (Figure 1; Supplemental Videos 1 and 2). High-resolution zoom-in confocal scanning and electron microscopy demonstrated that parenchyma-infiltrated T cells closely interact with neoplastic and nonneoplastic cells on a membrane-to-membrane basis (Figure 2), compatible with antigen-mediated interaction. Thus, we analyzed the TCR/CD3 polarization, characteristic of IS signature forming cSMAC, in the intercellular space with neoplastic (glioma cells) or nonneoplastic cells (tumor-associated macrophages; TAMs) (Figures 3, 4, and 5, and Supplemental Videos 3 and 4). Besides cSMAC visualization, other characteristics of in-tissue IS were seen, as we already demonstrated in previous findings (14, 22), including flat interface or oriented nuclear indentation toward the target cell. However, the quantification of IS events revealed that cSMAC formation was much more frequent (more than double) with stromal cells than with malignant cells, despite similar levels of interaction (Figure 6), revealing the difficulty of T cells to recognize antigens on the glioma cell surface. Importantly, T cells within the neoplastic parenchyma, in contrast with the stroma, show elongated morphology, suggesting high motility and migration compatible with kinaptic dynamics, neoantigen search, and tumor evasion (Figure 7).
By utilizing our recently published technique (31), we were able to discern IK in human tissue displaying the characteristic triangular shape with a leading lamellipodium and a TCR/CD3-rich trailing uropod (Figure 8). We could also appreciate that the typical nuclear indentation, which is known to host the Golgi apparatus, the MTOC, and cytolytic granules (32–34), appears oriented toward the uropod as described in previous studies in vitro (29, 35).
The presence of frequent IK in neoplastic GBM areas reflects poor TCR sensing that can be due to several factors. First, the tangible increase in IS with stromal myeloid cells could imply tolerance induction. Actually, MHCII-type prolonged engagements could be tolerogenic for T cells. Recent studies performed in an autochthonous model of breast cancer show that T cells are arrested by TAMs shortly after tumor entry, later becoming increasingly motile, suggesting reduced TCR signaling (24). This is compatible with our results where a primary engagement of T cells with myeloid microglia/macrophages in GBM, especially CD4+ T cells in MHCII-rich perivascular stroma, may induce an antigen desensitization reflected later in malignant areas. Secondly, besides the previous sensitization taking place by T cell arrest in stromal areas, T cell crawling in neoplastic tissue may also be facilitated by the expression of PD-L1 by tumor GBM cells, which has been observed in some GBM cases (1, 25). However, the consistency and degree of PD-L1 expression by glioma cells still remains controversial and scarcely studied (4). Previous reports in other scenarios have shown that PD-1/PD-L1 interactions promote tolerance by blocking TCR stop signal (28), which is compatible with the IK triggering. This is apparently a very dynamic process in which PD-1 is clustered at the IS cSMAC level (20) and able to inhibit CD3/TCR receptor signaling (21). At this point, coinhibitory receptor PD-1 may play a critical role in preventing the stabilization of IS, especially when encountering high levels of tumor cell ligand PD-L1 (36). In this context, weak PD-1/PD-L1 interactions might favor symmetric SMAC, stopping T cell motility, whereas strong PD-1/PD-L1 binding may induce T cell anergy (37, 38), breaking the symmetry of the SMAC (11) and, thus, promoting IK.
We found that both CTLs and non-CTLs populate the GFAP-rich malignant areas displaying kinaptic shape (Supplemental Figure 9). More generally, and in the light of our findings, CD8+ T cells — after reaching the tumor parenchyma — would directly engage with glioma cells as motile IK (Supplemental Figure 8), scarcely forming IS, whereas CD4+ T cells — after being arrested at MHCII populated areas with solid IS — may later enter the malignant environment with an IK motile behavior similarly to their CD8 T CTLs counterparts (Supplemental Figures 3 and 9). These results indicate that tumorigenic cells may escape immunity by locally preventing the formation of IS, but also by favoring antigen presentation by stromal TAMs, which could increase the antigen-specific regulatory arm toward tolerance. High MHCII interactions within the tumor suggest the increase of CD4-type infiltration (Supplemental Figure 3) and activation, including Tregs, which we have seen populating our GBM samples (Supplemental Figure 7). The increased proportion of Tregs could be due, on the one hand, to the activation or switching enabled by the tumor microenvironment (i.e., cytokines such as TGF-β) (39), or, on the other hand, to the induced CD4+ T cell anergy, able to generate Treg precursors by the hypomethylation of particular genes to differentiate FOXP3 Tregs (40). In addition, it is thought that FOXP3 expression could also be promoted by PD-L1 interactions through AKT/mTOR signaling inhibition, acting like a molecular switch to transform naive T cells into Tregs (41). All strategies are putatively designed to promote tumor immunity by diminishing the cytotoxic T cell response.
In this context, it is important to consider that PD-L1 and Tregs are critical elements in immune tolerance, as it is likely that levels of both factors may be closely connected with cancer patients’ survival, including glioma (1, 42), in which higher expression of PD-L1 has been correlated with a worse outcome (43). Although GBM shows Treg accumulation (44), a direct relation with clinical prognosis is still unclear (45). Despite the success of immunotherapy blocking immune checkpoint PD-L1/PD-1 in some particular cases (4), the mechanisms of action — and particularly its role in malignant glioma — remains undecided (46). Nevertheless, it is critical to ponder whether PD-L1 may have a pivotal role in the induction and maintenance of Tregs (41), as well as T cell anergy.
The fact that infiltrated T cells display a dramatically higher proportion of kinapse arrangement in malignant areas is compatible with a random walk in search for neo-antigens, which also implies that the motility of T cells is not impaired but rather promoted in GBM. The differential kinetics between malignant and stromal areas indicates that neoplastic cells present characteristics to induce immune evasion. Factors like PD-L1 may break the IS symmetry, facilitating the T cells passing through these tumor regions. This suggests that T cells have difficulties in seeing or finding neo-antigens on the tumor cell surface, enabling immune escape of glioma at the antigen-sensing level. Therefore, as blocking PD-L1 may be effective in some circumstances, strategies also targeting TCR/CD3 such as chimeric antigen receptor (CAR) T cells or CD19/CD3 bispecific T cell engagers (BiTE) should be further explored for killing tumors (47–49). In this setup, the intervention at the IS and IK levels, modulating TCR/CD3 dynamics in T cell cycle, may be crucial for designing an effective antibody-based immunotherapy.
Methods
Patients and samples
Biopsies from 15 patients, admitted to the General Hospital of Valencia (Valencia, Spain), diagnosed with glioma were used for this research project (Supplemental Table 1). None of the patients received immunotherapy treatments. Tumors were excised and prepared following the protocol described in a previous publication (14) and approved by the 2 institutions involved, including the Ethics Committee on Animal and Human Research of the Universitat Autònoma de Barcelona (Bellaterra, Barcelona, Spain) and the Research Committee of the General Hospital of Valencia, which included the informed consent of the patients. This procedure requires the immediate fixation of biopsies after resection, allowing the preservation of the microstructure. After fixation, samples were cryoprotected and sectioned in a cryostat (Leica Microsystems). The pathology department of the hospital provided the diagnosis and grade, including the Ki67 proliferation index. Samples showed the typical features of glioma: marked cellularity with hyperchromatism and pleomorphism, gemistocytic differentiation, glomeruloid vessels, necrotic palisades, and aberrant mitoses (Supplemental Figure 1).
Histological evaluation
Histochemistry.
Thionine staining was performed to evaluate the typical structural pathological features of glioma in the samples. For this, Thionine (Certistain, Merck) solution in acetate buffer (25 mg/100 ml acetate buffer pH 4.6; Stem solution A, sodium acetate 0.1 M [Merck]; Stem solution B, Acetic acid 0.1 M [Panreac]) was used. All the samples were first mounted on gelatinized slides, dried and then rinsed in distilled water, stained in thionine solution for 5 minutes, washed in distilled water, dehydrated in increasing concentrations of ethanol (70%, 80%, 90%, and 100%; Fluka Analytical), and fixed in xylene (Thermo Fisher Scientific). Then sections were cover-slipped to be analyzed with the conventional light microscope (Eclipse 80i microscope, Nikon), taking the required pictures with the digital camera connected to the microscope (DXM 1200F Digital Camera, Nikon).
IHC.
Free-floating IHC by DAB detection was performed on 60 μm–thick tumor sections to visualize immune-cell markers and glial-tumor cell markers, using primary antibodies to recognize: GFAP (1:500, mouse IgG1, clone GA5, MAB360; MilliporeSigma); CD3 (1:100, rabbit polyclonal, A0452; Dako); Vimentin (1:100, mouse IgM, clone LN-6, V2258; MilliporeSigma); FOXP3 (1:2, mouse IgG1, clone 236A, Lot 117; CNIO); CD8 (1:20, mouse IgG2b, clone 4B11, MCA1817; AbD Serotec); CD4 (1:20, mouse IgG1, clone 1F6, NCL-CD4-1F6; Novocastra); and HLA-DP, -DQ, and -DR (1:100, mouse monoclonal, clone CR3/43, M0775; Dako). Samples were first treated with citrate (10 mM, pH 6, 60°C, 20 minutes) to increase antigen retrieval and antibody penetration. Then, 0.3% hydrogen peroxide was used to inactivate endogenous peroxidase, and sections were blocked for 1 hour with 0.5% Triton X-100 with 10% horse serum (MilliporeSigma) before incubating for 48 hours with primary antibody diluted in TBS-0.5% Triton X-100, 1% horse serum, and 0.1% sodium azide. The primary antibodies used are described above. Secondary antibodies were biotinylated goat anti-mouse (1:1,000, goat IgG; BA-9200, Vector Laboratories) or biotinylated goat anti-rabbit (1:1,000, goat IgG; BA-1000, Vector Laboratories), diluted in 0.5% Triton X-100 with 1% horse serum and 0.1% sodium azide, according to the host of the primary antibodies. Secondary antibodies were detected by using the Vectastain Elite ABC HRP and DAB HRP Substrate Kits (Vector Laboratories). Sections were mounted on gelatinized glass slides and were dehydrated through graded ethanol solutions (70%, 80%, 90%, and 100%) and xylene before coverslipping.
Stereology and quantification.
The number of Vimentin+ cells, T cells (CD3+), and FOXP3+ Tregs immunostained with DAB was quantified using stereological methods in serial sections. Conventional microscope (Nikon EclipseTe2000e) with a motorized stage (Prior ProScan II) and connected to a high-resolution digital camera (Hamamatsu, Orca-ER) was used to systematically sample each tumor section. Pictures were taken automatically and homogeneously over the section using specialized image-analysis software (Metamorph, Molecular Devices) with the 40× oil objective. For each section, we established the X and Y coordinates of a conventional rectangle covering the section surface. This rectangle was divided into a number of columns and rows necessary to obtain the sufficient number of sample-frames for the quantification, establishing a minimum of 25 frames per section. Once the pictures were taken, we counted the positive cells with image analysis software (ImageJ version 1.47, NIH) following stereological criteria. We considered each picture as a physical dissector for stereological quantification of particles in focus in 1 Z optical plane. For T cells, all the cells that appear inside the field were counted except for the ones hitting the left and top border of the physical dissector. We distinguished the vascular and parenchymal dissectors following the criteria of previously published protocols (50). For vimentin+ cells, we used a stereological grid and only the cells touching the crossing of the grid were counted, as previously described (51). The estimation of the positive cells was expressed as the average number of positive cells per counting frame.
Detection of IS/IK in 3-D in tissue
Immunofluorescence in tissue blocks.
To visualize the microanatomical details of IS in thick tissue sections, we followed the protocol that we recently published (31). In summary, free-floating immunolabeling was performed on 60 μm–thick sections for multiple staining to visualize 3-D CD3+ T cells in combination with either GFAP+ cells or MHCII+ cells (HLA-DP, DQ, DR+ cells in humans). The samples were pretreated with hot citrate buffer to ameliorate antibody binding and antigen retrieval. Next, nonspecific antibody binding sites were blocked during 45 minutes with 0.5% Triton X-100 with 10% horse serum (MilliporeSigma) before incubating 48 hours with primary antibody diluted in 0.1% horse serum in TBS-0.5% Triton X-100, 0.1% sodium azide. The primary antibodies used were anti–human CD3 (1:100, rabbit polyclonal, A0452; Dako); anti–human CD8 (1:25, mouse IgG1, clone 144B, ab17147; Abcam), anti-CD31 (1:200, mouse IgG1, clone C31.3 + JC/70A, ab199012; Abcam), and anti-GFAP (1:500, mouse IgG1, clone GA5, MAB360; MilliporeSigma) or anti-GFAP (1:200, chicken polyclonal, ab4674; Abcam), anti-HLA-DP, DQ, DR (1:100, mouse monoclonal, clone CR3/43, M0775; Dako), anti–Iba-1 (1:500, rabbit polyclonal, 019-19741; WAKO), and anti-vimentin (1:100, mouse IgM, clone LN-6, V2258; MilliporeSigma). Secondary fluorescence antibodies, diluted in 0.5% Triton X-100 with 1% horse serum and 0.1% sodium azide, were used accordingly with the host of the primary antibodies for the subsequent detection. The secondary antibodies used were AlexaFluor 488 goat anti–rabbit IgG (1:1,000), AlexaFluor 488 goat anti–mouse IgG1 (1:1,000), AlexaFluor 555 goat anti–chicken IgG (1:1,000), AlexaFluor 555 goat anti–mouse IgG (1:1,000), and AlexaFluor 555 goat anti–mouse IgG (1:200). In the case of MHCII staining, AlexaFluor 555 goat anti–mouse IgM (1:1,000) and AlexaFluor 647 goat anti–rabbit IgG (1:1,000) were used. Then, DAPI (1:1,000) was used to stain the nuclei of the cells. Sections were mounted on glass slides and coverslipped using Prolong antifade reagent (Invitrogen).
Confocal analysis of human tissue.
The percentage of CD3+ cells establishing IS or IK with either GFAP+ tumorigenic cells or MHCII+ cells were quantified in confocal stacks. Human biopsies were imaged with a high-resolution confocal microscope (Zeiss Examiner D1 AX10) with a 40× oil objective and managed with confocal software (ZEN, Zeiss). Stacks covering several layers of T cells were taken with an optical section interval of 0.5 μm, visualized with Illucida FX software (Illucida), and analyzed with the image analysis software ImageJ. Five hundred and sixty-eight interacting T cells were analyzed for GFAP apposition, whereas 456 interacting T cells were analyzed for MHCII cells. We counted separately the total number of T cells in every stack; the total number of contacts were categorized by the display of specific features of active IS such as contacts in which the T cell shows an oriented flat interface and those in which a CD3-rich cSMAC was clearly visible with the rainbow spectrum tool (intensity fluorescence scale). After the analysis, representative examples of those showing the specific features of IS were imaged in detail with the appropriate zoom-in scanning. More details of the confocal imaging protocol can be found in a recent publication (31).
3D visualizations and reconstructions
To visualize confocal-scanned tissue blocks in transparencies and 3-D–based patterns, we used a developed software application able to display the shape and architectural location of T cells, rapidly and in the whole analyzed space, as well as visualizing the T cell position in relation to other cell types (IllucidaFX). This Apple-based application applies shadowing and noise filtering, and it allows the visual adjustment of z axis to correct fixed tissue flattening (31). For particular cells and interactions, we decided to use another software application (Imaris 8.0. Bitplane) that allows the optical isolation of a particular cell and the building of different iso-surfaces to better understand the microarchitecture of the labeled structures. In this case, each fluorophore and level of fluorescence can be individually rendered with high resolution.
Electron microscopy
Thick sections of biopsies were post fixed with 2% paraformaldehyde and 2.5% glutaraldehyde. Tumor sections were contrasted with 2% sodium tetroxide, dehydrated, stained in 2% uranyl acetate, and embedded in Durcupan resin (Fluka; MilliporeSigma). Semithin sections (1.5 μm) were cut with a diamond knife and stained with 1% toluidine blue for light microscopy. Ultrathin sections (70 nm) were cut and stained with lead citrate. Grids were then examined using a FEI Tecnai G2 Spirit transmission electron microscope (FEI Europe) and a digital camera (Morada Soft Imaging System; Olympus).
Statistics
The results were expressed as mean ± SEM and percentages. We first tested the normality for each group by the Shapiro-Wilk normality test. Depending on the normality test results, each parameter was evaluated either by (a) 2-tailed t test for 2 independent samples in the case of normal groups or by (b) Mann-Whitney U test for 2 independent samples in the case of nonnormal groups. In all cases, P ≤ 0.05 was considered significant.
Study Approval
Studies were approved by the Ethics Committee on Animal and Human Research of the Universitat Autònoma de Barcelona (Bellaterra, Barcelona, Spain) and the Research Committee of the General Hospital of Valencia, which included the informed consent of the patients.
Author contributions
LRD, ESL, LR, IM, PVC, GPC, and CB Jr. performed the main research of this manuscript, including processing the samples for multilabeling, microscopy imaging, analyzing, and generating the 3-D renderings. JMG and CB Sr. conducted the brain surgeries and prepared the biopsies. APV assessed the neuropathological diagnosis of the samples. JFV, CAC, and JMGV performed and analyzed the electron microscopy images. CB Jr. designed and coordinated the research. The manuscript was written by CB Jr. and revised and edited by all coauthors.
Supplementary Material
Acknowledgments
This work was supported by grants from the Spanish Ministry of Economy and Competitiveness and the European Regional Development Fund (Fondo Europeo de Desarrollo Regional, FEDER) (reference grants RYC-2010-06729, SAF2013-45178-P, and SAF2015-64123-P) and by the Asociación Española Contra el Cancer (AECC). We would like to thank all the personnel from the Administration and Technical Laboratories of the Institut de Neurociències; for the help provided at the Universitat Autònoma de Barcelona, especially to the technicians at the Microscopy Core; Núria Barba; and Saioa Mendizuri.
This work is dedicated in the loving memory of Carlos Barcia Sr. (1941–2014), former head of the Department of Neurosurgery, Valencia General Hospital, an excellent professional and a better father.
Version 1. 09/20/2018
Electronic publication
Footnotes
Conflict of interest: The authors have declared that no conflict of interest exists.
Reference information: JCI Insight. 2018;3(18): e120757. https://doi.org/10.1172/jci.insight.120757.
Contributor Information
Leire Romarate, Email: leireromarate@gmail.com.
Izaskun Mitxitorena, Email: imitxitorena@gmail.com.
José M. Gallego, Email: chegalsan@yahoo.es.
Ana Pérez-Vallés, Email: perez_ana@gva.es.
Jerónimo Forteza-Vila, Email: jeronimo.forteza@gmail.com.
Clara Alfaro-Cervello, Email: Clara.Alfaro@uv.es.
References
- 1.Preusser M, Lim M, Hafler DA, Reardon DA, Sampson JH. Prospects of immune checkpoint modulators in the treatment of glioblastoma. Nat Rev Neurol. 2015;11(9):504–514. doi: 10.1038/nrneurol.2015.139. [DOI] [PMC free article] [PubMed] [Google Scholar]
- 2.Kato S, Goodman A, Walavalkar V, Barkauskas DA, Sharabi A, Kurzrock R. Hyperprogressors after Immunotherapy: Analysis of Genomic Alterations Associated with Accelerated Growth Rate. Clin Cancer Res. 2017;23(15):4242–4250. doi: 10.1158/1078-0432.CCR-16-3133. [DOI] [PMC free article] [PubMed] [Google Scholar]
- 3.Carbone DP, et al. First-Line Nivolumab in Stage IV or Recurrent Non-Small-Cell Lung Cancer. N Engl J Med. 2017;376(25):2415–2426. doi: 10.1056/NEJMoa1613493. [DOI] [PMC free article] [PubMed] [Google Scholar]
- 4.Lim M, Xia Y, Bettegowda C, Weller M. Current state of immunotherapy for glioblastoma. Nat Rev Clin Oncol. 2018;15(7):422–442. doi: 10.1038/s41571-018-0003-5. [DOI] [PubMed] [Google Scholar]
- 5.Dustin ML. T-cell activation through immunological synapses and kinapses. Immunol Rev. 2008;221:77–89. doi: 10.1111/j.1600-065X.2008.00589.x. [DOI] [PubMed] [Google Scholar]
- 6.Dieckmann NM, Frazer GL, Asano Y, Stinchcombe JC, Griffiths GM. The cytotoxic T lymphocyte immune synapse at a glance. J Cell Sci. 2016;129(15):2881–2886. doi: 10.1242/jcs.186205. [DOI] [PubMed] [Google Scholar]
- 7.Martín-Cófreces NB, Baixauli F, Sánchez-Madrid F. Immune synapse: conductor of orchestrated organelle movement. Trends Cell Biol. 2014;24(1):61–72. doi: 10.1016/j.tcb.2013.09.005. [DOI] [PMC free article] [PubMed] [Google Scholar]
- 8.Monks CR, Freiberg BA, Kupfer H, Sciaky N, Kupfer A. Three-dimensional segregation of supramolecular activation clusters in T cells. Nature. 1998;395(6697):82–86. doi: 10.1038/25764. [DOI] [PubMed] [Google Scholar]
- 9.Moreau HD, et al. Dynamic in situ cytometry uncovers T cell receptor signaling during immunological synapses and kinapses in vivo. Immunity. 2012;37(2):351–363. doi: 10.1016/j.immuni.2012.05.014. [DOI] [PubMed] [Google Scholar]
- 10.Moreau HD, Lemaître F, Garrod KR, Garcia Z, Lennon-Duménil AM, Bousso P. Signal strength regulates antigen-mediated T-cell deceleration by distinct mechanisms to promote local exploration or arrest. Proc Natl Acad Sci USA. 2015;112(39):12151–12156. doi: 10.1073/pnas.1506654112. [DOI] [PMC free article] [PubMed] [Google Scholar]
- 11.Dustin ML. Modular design of immunological synapses and kinapses. Cold Spring Harb Perspect Biol. 2009;1(1):a002873. doi: 10.1101/cshperspect.a002873. [DOI] [PMC free article] [PubMed] [Google Scholar]
- 12.Negulescu PA, Krasieva TB, Khan A, Kerschbaum HH, Cahalan MD. Polarity of T cell shape, motility, and sensitivity to antigen. Immunity. 1996;4(5):421–430. doi: 10.1016/S1074-7613(00)80409-4. [DOI] [PubMed] [Google Scholar]
- 13.Deguine J, Breart B, Lemaître F, Di Santo JP, Bousso P. Intravital imaging reveals distinct dynamics for natural killer and CD8(+) T cells during tumor regression. Immunity. 2010;33(4):632–644. doi: 10.1016/j.immuni.2010.09.016. [DOI] [PubMed] [Google Scholar]
- 14.Barcia C, et al. Infiltrating CTLs in human glioblastoma establish immunological synapses with tumorigenic cells. Am J Pathol. 2009;175(2):786–798. doi: 10.2353/ajpath.2009.081034. [DOI] [PMC free article] [PubMed] [Google Scholar]
- 15.Fecci PE, et al. Increased regulatory T-cell fraction amidst a diminished CD4 compartment explains cellular immune defects in patients with malignant glioma. Cancer Res. 2006;66(6):3294–3302. doi: 10.1158/0008-5472.CAN-05-3773. [DOI] [PubMed] [Google Scholar]
- 16.Learn CA, et al. Profiling of CD4+, CD8+, and CD4+CD25+CD45RO+FoxP3+ T cells in patients with malignant glioma reveals differential expression of the immunologic transcriptome compared with T cells from healthy volunteers. Clin Cancer Res. 2006;12(24):7306–7315. doi: 10.1158/1078-0432.CCR-06-1727. [DOI] [PubMed] [Google Scholar]
- 17.Yang J, Sanderson NS, Wawrowsky K, Puntel M, Castro MG, Lowenstein PR. Kupfer-type immunological synapse characteristics do not predict anti-brain tumor cytolytic T-cell function in vivo. Proc Natl Acad Sci USA. 2010;107(10):4716–4721. doi: 10.1073/pnas.0911587107. [DOI] [PMC free article] [PubMed] [Google Scholar]
- 18.Mitxitorena I, Saavedra E, Barcia C. Kupfer-type immunological synapses in vivo: Raison D’être of SMAC. Immunol Cell Biol. 2015;93(1):51–56. doi: 10.1038/icb.2014.80. [DOI] [PubMed] [Google Scholar]
- 19.Dustin ML. The immunological synapse. Cancer Immunol Res. 2014;2(11):1023–1033. doi: 10.1158/2326-6066.CIR-14-0161. [DOI] [PMC free article] [PubMed] [Google Scholar]
- 20.Pentcheva-Hoang T, Chen L, Pardoll DM, Allison JP. Programmed death-1 concentration at the immunological synapse is determined by ligand affinity and availability. Proc Natl Acad Sci USA. 2007;104(45):17765–17770. doi: 10.1073/pnas.0708767104. [DOI] [PMC free article] [PubMed] [Google Scholar]
- 21.Yokosuka T, Takamatsu M, Kobayashi-Imanishi W, Hashimoto-Tane A, Azuma M, Saito T. Programmed cell death 1 forms negative costimulatory microclusters that directly inhibit T cell receptor signaling by recruiting phosphatase SHP2. J Exp Med. 2012;209(6):1201–1217. doi: 10.1084/jem.20112741. [DOI] [PMC free article] [PubMed] [Google Scholar]
- 22.Barcia C, et al. In vivo mature immunological synapses forming SMACs mediate clearance of virally infected astrocytes from the brain. J Exp Med. 2006;203(9):2095–2107. doi: 10.1084/jem.20060420. [DOI] [PMC free article] [PubMed] [Google Scholar]
- 23.Hambardzumyan D, Gutmann DH, Kettenmann H. The role of microglia and macrophages in glioma maintenance and progression. Nat Neurosci. 2016;19(1):20–27. doi: 10.1038/nn.4185. [DOI] [PMC free article] [PubMed] [Google Scholar]
- 24.Boldajipour B, Nelson A, Krummel MF. Tumor-infiltrating lymphocytes are dynamically desensitized to antigen but are maintained by homeostatic cytokine. JCI Insight. 2016;1(20):e89289. doi: 10.1172/jci.insight.89289. [DOI] [PMC free article] [PubMed] [Google Scholar]
- 25.Berghoff AS, et al. Programmed death ligand 1 expression and tumor-infiltrating lymphocytes in glioblastoma. Neuro-oncology. 2015;17(8):1064–1075. doi: 10.1093/neuonc/nou307. [DOI] [PMC free article] [PubMed] [Google Scholar]
- 26.Liu Y, et al. PD-L1 expression by neurons nearby tumors indicates better prognosis in glioblastoma patients. J Neurosci. 2013;33(35):14231–14245. doi: 10.1523/JNEUROSCI.5812-12.2013. [DOI] [PMC free article] [PubMed] [Google Scholar]
- 27.Iwai Y, Ishida M, Tanaka Y, Okazaki T, Honjo T, Minato N. Involvement of PD-L1 on tumor cells in the escape from host immune system and tumor immunotherapy by PD-L1 blockade. Proc Natl Acad Sci USA. 2002;99(19):12293–12297. doi: 10.1073/pnas.192461099. [DOI] [PMC free article] [PubMed] [Google Scholar]
- 28.Fife BT, et al. Interactions between PD-1 and PD-L1 promote tolerance by blocking the TCR-induced stop signal. Nat Immunol. 2009;10(11):1185–1192. doi: 10.1038/ni.1790. [DOI] [PMC free article] [PubMed] [Google Scholar]
- 29.Dustin ML. The cellular context of T cell signaling. Immunity. 2009;30(4):482–492. doi: 10.1016/j.immuni.2009.03.010. [DOI] [PMC free article] [PubMed] [Google Scholar]
- 30.Carpentier AF, Meng Y. Recent advances in immunotherapy for human glioma. Curr Opin Oncol. 2006;18(6):631–636. doi: 10.1097/01.cco.0000245321.34658.f4. [DOI] [PubMed] [Google Scholar]
- 31.Cribaro GP, Saavedra-López E, Casanova PV, Rodríguez L, Barcia C. Studying the T Cell-Astrocyte Immune Synapse. Methods Mol Biol. 2017;1584:517–531. doi: 10.1007/978-1-4939-6881-7_32. [DOI] [PubMed] [Google Scholar]
- 32.Kupfer A, Dennert G, Singer SJ. Polarization of the Golgi apparatus and the microtubule-organizing center within cloned natural killer cells bound to their targets. Proc Natl Acad Sci USA. 1983;80(23):7224–7228. doi: 10.1073/pnas.80.23.7224. [DOI] [PMC free article] [PubMed] [Google Scholar]
- 33.Stinchcombe JC, Majorovits E, Bossi G, Fuller S, Griffiths GM. Centrosome polarization delivers secretory granules to the immunological synapse. Nature. 2006;443(7110):462–465. doi: 10.1038/nature05071. [DOI] [PubMed] [Google Scholar]
- 34.Barcia C, et al. T cells’ immunological synapses induce polarization of brain astrocytes in vivo and in vitro: a novel astrocyte response mechanism to cellular injury. PLoS ONE. 2008;3(8):e2977. doi: 10.1371/journal.pone.0002977. [DOI] [PMC free article] [PubMed] [Google Scholar]
- 35.Dustin ML. Cell adhesion molecules and actin cytoskeleton at immune synapses and kinapses. Curr Opin Cell Biol. 2007;19(5):529–533. doi: 10.1016/j.ceb.2007.08.003. [DOI] [PMC free article] [PubMed] [Google Scholar]
- 36.Ostrand-Rosenberg S, Horn LA, Haile ST. The programmed death-1 immune-suppressive pathway: barrier to antitumor immunity. J Immunol. 2014;193(8):3835–3841. doi: 10.4049/jimmunol.1401572. [DOI] [PMC free article] [PubMed] [Google Scholar]
- 37.Tsushima F, et al. Interaction between B7-H1 and PD-1 determines initiation and reversal of T-cell anergy. Blood. 2007;110(1):180–185. doi: 10.1182/blood-2006-11-060087. [DOI] [PMC free article] [PubMed] [Google Scholar]
- 38.Saibil SD, Deenick EK, Ohashi PS. The sound of silence: modulating anergy in T lymphocytes. Curr Opin Immunol. 2007;19(6):658–664. doi: 10.1016/j.coi.2007.08.005. [DOI] [PubMed] [Google Scholar]
- 39.Flavell RA, Sanjabi S, Wrzesinski SH, Licona-Limón P. The polarization of immune cells in the tumour environment by TGFbeta. Nat Rev Immunol. 2010;10(8):554–567. doi: 10.1038/nri2808. [DOI] [PMC free article] [PubMed] [Google Scholar]
- 40.Kalekar LA, et al. CD4(+) T cell anergy prevents autoimmunity and generates regulatory T cell precursors. Nat Immunol. 2016;17(3):304–314. doi: 10.1038/ni.3331. [DOI] [PMC free article] [PubMed] [Google Scholar]
- 41.Francisco LM, et al. PD-L1 regulates the development, maintenance, and function of induced regulatory T cells. J Exp Med. 2009;206(13):3015–3029. doi: 10.1084/jem.20090847. [DOI] [PMC free article] [PubMed] [Google Scholar]
- 42.Kalathil SG, Lugade AA, Miller A, Iyer R, Thanavala Y. PD-1+ and Foxp3+ T cell reduction correlates with survival of HCC patients after sorafenib therapy. JCI Insight. 2016;1(11):e86182. doi: 10.1172/jci.insight.86182. [DOI] [PMC free article] [PubMed] [Google Scholar]
- 43.Nduom EK, et al. PD-L1 expression and prognostic impact in glioblastoma. Neuro-oncology. 2016;18(2):195–205. doi: 10.1093/neuonc/nov172. [DOI] [PMC free article] [PubMed] [Google Scholar]
- 44.El Andaloussi A, Lesniak MS. An increase in CD4+CD25+FOXP3+ regulatory T cells in tumor-infiltrating lymphocytes of human glioblastoma multiforme. Neuro-oncology. 2006;8(3):234–243. doi: 10.1215/15228517-2006-006. [DOI] [PMC free article] [PubMed] [Google Scholar]
- 45.Heimberger AB, et al. Incidence and prognostic impact of FoxP3+ regulatory T cells in human gliomas. Clin Cancer Res. 2008;14(16):5166–5172. doi: 10.1158/1078-0432.CCR-08-0320. [DOI] [PubMed] [Google Scholar]
- 46.Lowther DE, et al. PD-1 marks dysfunctional regulatory T cells in malignant gliomas. JCI Insight. 2016;1(5):e85935. doi: 10.1172/jci.insight.85935. [DOI] [PMC free article] [PubMed] [Google Scholar]
- 47.Harris DT, Kranz DM. Adoptive T Cell Therapies: A Comparison of T Cell Receptors and Chimeric Antigen Receptors. Trends Pharmacol Sci. 2016;37(3):220–230. doi: 10.1016/j.tips.2015.11.004. [DOI] [PMC free article] [PubMed] [Google Scholar]
- 48.Hinrichs CS. Molecular Pathways: Breaking the Epithelial Cancer Barrier for Chimeric Antigen Receptor and T-cell Receptor Gene Therapy. Clin Cancer Res. 2016;22(7):1559–1564. doi: 10.1158/1078-0432.CCR-15-1294. [DOI] [PMC free article] [PubMed] [Google Scholar]
- 49.Suryadevara CM, et al. Are BiTEs the “missing link” in cancer therapy? Oncoimmunology. 2015;4(6):e1008339. doi: 10.1080/2162402X.2015.1008339. [DOI] [PMC free article] [PubMed] [Google Scholar]
- 50.Carrillo-de Sauvage MA, et al. CCL2-expressing astrocytes mediate the extravasation of T lymphocytes in the brain. Evidence from patients with glioma and experimental models in vivo. PLoS One. 2012;7(2):e30762. doi: 10.1371/journal.pone.0030762. [DOI] [PMC free article] [PubMed] [Google Scholar]
- 51.Gundersen HJ. Stereology of arbitrary particles. A review of unbiased number and size estimators and the presentation of some new ones, in memory of William R. Thompson. J Microsc. 1986;143(Pt 1):3–45. [PubMed] [Google Scholar]
Associated Data
This section collects any data citations, data availability statements, or supplementary materials included in this article.


