

Abstract
Tumors evade immune control by creating hostile microenvironments that perturb T cell metabolism and effector function1–4. However, it remains unclear how intratumoral T cells integrate and interpret metabolic stress signals. Here we report that ovarian cancer (OvCa), an aggressive malignancy refractory to standard treatments and current immunotherapies5–8, induces Endoplasmic Reticulum (ER) stress and activation of the IRE1α-XBP1 arm of the Unfolded Protein Response (UPR)9,10 in T cells to control their mitochondrial respiration and anti-tumor function. XBP1 upregulation in T cells isolated from human OvCa specimens was associated with decreased intratumoral T cell infiltration and reduced IFNG mRNA expression. Malignant ascites fluid obtained from OvCa patients inhibited glucose uptake and caused N-linked protein glycosylation defects in T cells, leading to IRE1α/XBP1-driven suppression of mitochondrial activity and IFN-γ production. Mechanistically, XBP1 induction limited the influx of glutamine necessary to sustain T cell mitochondrial respiration under glucose-deprived conditions by regulating the abundance of glutamine carriers. Restoring N-linked protein glycosylation, abrogating IRE1α-XBP1 activation or enforcing expression of glutamine transporters enhanced mitochondrial respiration in human T cells exposed to OvCa ascites. XBP1-deficient T cells in the metastatic OvCa milieu exhibited global transcriptional reprogramming and improved effector capacity. Accordingly, OvCa-bearing mice lacking XBP1 selectively in T cells demonstrated superior anti-tumor immunity, delayed malignant progression and increased overall survival. Therefore, controlling ER stress or targeting IRE1α-XBP1 signaling may help restore T cell metabolic fitness and anti-tumor capacity in cancer hosts.
Keywords: ER stress, IRE1, XBP1, T cells, Metabolism, Mitochondria, Cancer, Immunotherapy
IRE1α excises a 26-nucleotide fragment from the XBP1 mRNA under ER stress to generate a spliced version encoding the functionally active XBP1s protein9. This transcription factor mediates adaptation to ER stress by inducing genes involved in protein folding and quality control10. IRE1α-XBP1 endows malignant cells with tumorigenic capacity11 while subverting the function of cancer-associated myeloid cells12–14. However, it remains unknown whether this pathway operates intrinsically in T cells to influence malignant progression.
Intratumoral and ascites-resident CD4+ and CD8+ T cells isolated from human OvCa specimens demonstrated increased XBP1 mRNA splicing compared with peripheral T cells from cancer-free women (Fig. 1a, b). XBP1 levels in OvCa-associated T cells correlated with expression of UPR gene markers HSPA5 and DDIT3, suggesting that these cells experience ER stress in situ (Fig. 1c). Increased expression of XBP1, HSPA5 and DDIT3 was associated with reduced T cell infiltration in the specimens analyzed (Fig. 1d). However, only XBP1 expression correlated with decreased IFNG levels in intratumoral T cells (Fig. 1e), suggesting that ER stress-driven IRE1α-XBP1 activation might influence T cell functions in OvCa.
Figure 1. IRE1α-XBP1 activation in human OvCa-infiltrating T cells.

a, XBP1 splicing assays for CD4+ or CD8+ T cells isolated from ascites or solid tumors of OvCa patients, or from blood of cancer-free female donors. XBP1s, spliced form; XBP1u, unspliced form. Data were generated from three independent experiments. b, Frequency of spliced XBP1/total XBP1 in T cells sorted from the indicated sources (n = 8/group). c-e, Pairwise analyses for sorted tumor-associated CD4+ (circles) and CD8+ (squares) T cells (n = 22 total). c, ER stress response gene expression. d, Proportion of CD45+CD3+ OvCa-infiltrating T cells versus expression of the indicated genes in T cells from the same specimen. e, IFNG versus ER stress response genes in each sample. n-values correspond to biologically independent samples (b-e). One-way ANOVA with Tukey’s post-test, boxes represent median ± interquartile range and whiskers indicate minimum and maximum (b); Spearman’s rank correlation test, Spearman coefficient (r) with p-value (two-tailed), 95% confidence intervals (CI) for all correlation analyses (c-e) are described in Supplemental Table 2.
XBP1 splicing was mainly observed in T cells present in OvCa ascites (Fig. 1b), which is an immunomodulatory and tumorigenic fluid that often accumulates in patients with metastatic or recurrent disease6,15. We exploited this milieu to examine whether OvCa induces IRE1α-XBP1 in T cells to control their activity. We focused on CD4+ T cells since they are the predominant leukocyte population in OvCa ascites16–19, and because the mechanisms regulating their protective capacity in this setting remain unclear. Pre-activated CD4+ T cells from cancer-free women exhibited a dose-dependent increase in XBP1 upon treatment with cell-free ascites supernatants from OvCa patients (Extended data Fig. 1a). FACS-based analyses confirmed XBP1s induction in response to ascites exposure (Fig. 2a, b). T cells treated with the ER stressor tunicamycin (Tm) demonstrated strong XBP1s staining that was abrogated by the IRE1α inhibitor 4μ8C (Extended data Fig. 1b), validating the specificity of XBP1s detection by FACS. Hypoxia, acidic pH and nutrient deprivation disrupt ER homeostasis and trigger the UPR11. While OvCa ascites is hypoxic in vivo20, we observed XBP1s induction in T cells exposed to this fluid even under normoxia (Fig. 2a, b). The pH of independent ascites samples was within neutral range. Ascites treatment modestly augmented the levels of reactive oxygen species (ROS), but this effect was not responsible for XBP1 induction in T cells (Extended data Fig. 1c, d). Glucose is essential for N-linked protein glycosylation and therefore, alterations in its availability can provoke ER stress21. No correlation was found between the ascites glucose concentration and XBP1 induction in CD4+ T cells (Extended data Fig. 1e, f). However, ascites exposure suppressed expression of the major glucose transporter GLUT1 in CD4+ T cells (Fig. 2c, d). Indeed, T cells residing in the ascites of OvCa patients demonstrated negligible GLUT1 surface expression (Extended data Fig. 1g). Glucose uptake was therefore compromised in ascites-exposed CD4+ T cells, and this defect was associated with enhanced expression of XBP1 mRNA and XBP1s (Fig. 2e, Extended data Fig. 1h).
Figure 2. OvCa ascites limits glucose uptake and causes IRE1α/XBP-mediated mitochondrial dysfunction in human CD4+ T cells.

a-f, T cells were activated via CD3/CD28 stimulation for 16 h in the absence or presence of OvCa ascites supernatants at the indicated concentrations. Histograms (a) and quantification (b) of XBP1s staining (n = 16); Iso, isotype control. c, SLC2A1 expression was determined via qRT-PCR (n = 48). Immunoblot and quantification (d) of GLUT1 in ascites-exposed CD4+ T cells. Density of GLUT1 was normalized to β-ACTIN, and data are shown as the relative expression compared with the untreated control (n = 4 for 10% and 50% ascites; n = 2 for 100% ascites, all from two independent experiments). e, Glucose uptake was assessed using 2-NBDG and XBP1 was determined in the same sample. Symbols depict ascites from 3 independent patients tested at increasing concentrations on CD4+ T cells from multiple donors (n = 37). Baseline ECAR (f) and OCR profile (g) of CD4+ T cells exposed to ascites (n = 16). CD4+ T cells were treated with 4μ8C (h, i) or GlcNAc (j) for 1 h and then stimulated via CD3/CD28 for 16 h in the presence of 10% ascites. h, XBP1s determined by FACS (n = 7). i, OCR profile in 4μ8C-treated T cells exposed to ascites (n = 9). j, OCR for GlcNAc-treated T cells exposed to ascites (n = 5). Data are shown as mean ± s.e.m (b, c, d, f, g, i, j). n-values represent biologically independent samples (b-k). One-way ANOVA with Tukey’s post-test (b); Two-tailed Student’s t-test (c, f); One-way ANOVA with Bonferroni’s post-test (d). Spearman’s rank correlation test, 95% CI −0.9076 to −0.6760 (e); Two-tailed paired Student’s t-test (h); *P < 0.05, **P < 0.01, ***P < 0.001, ****P < 0.0001. MFI, Mean fluorescence intensity.
Protein glycosylation requires uridine diphosphate N-acetylglucosamine (UDP-GlcNAc), which is generated via the hexosamine biosynthetic pathway (HBP) using glucose as a substrate21. Ascites-exposed CD4+ T cells displayed N-linked protein glycosylation defects (Extended data Fig. 1i and Table 1), but supplementation with N-acetylglucosamine (GlcNAc), which serves as direct substrate for N-linked glycosylation, attenuated XBP1 activation in this setting (Extended data Fig. 1j). Limited glucose uptake in this setting also dampened the glycolytic capacity of CD4+ T cells (Fig. 2f). The oxygen consumption rates (OCR) of ascites-exposed CD4+ T cells decreased in a dose-dependent manner (Fig. 2g, Extended data Fig. 1k), suggesting that this fluid disturbs mitochondrial activity. Interestingly, T cell mitochondrial respiration also diminished when protein N-glycosylation was directly inhibited using tunicamycin (Extended data Fig. 1l, m). Since pyruvate was always present in culture media, the mitochondrial perturbations observed were unlikely to be caused by reduced T cell glycolysis in the presence of ascites. Hence, IRE1α-XBP1 activation might directly affect T cell mitochondrial function. Blocking IRE1α with 4μ8C inhibited XBP1s induction (Fig. 2h) while enhancing mitochondrial respiration in human CD4+ T cells exposed to OvCa ascites (Fig. 2i, Extended data Fig. 1n). IRE1α inhibition did not modulate glucose uptake or glycolysis in ascites-treated T cells (Extended data Fig. 1o), confirming that impaired glucose import drives IRE1α-XBP1 activation. Attenuating XBP1s induction using GlcNAc (Extended Data Fig. 1j) also augmented mitochondrial respiration in T cells treated with OvCa ascites supernatants (Fig. 2j, Extended Data Fig. 1p, q). Thus, reduced glucose import by ascites-exposed T cells not only dampens glycolysis, but also impairs N-linked protein glycosylation, leading to ER stress and IRE1α/XBP1-driven mitochondrial dysfunction.
We generated conditional knockout mice (Xbp1f/f Cd4cre) to understand how XBP1 regulates T cell function (Extended data Fig. 2a). The absolute cell numbers in lymphoid tissues, as well as the frequency of thymocytes, peripheral CD4+ and CD8+ T cells, and their corresponding subsets, were unaltered upon XBP1 ablation (Extended data Fig. 2b-j). Loss of XBP1 in T cells did not affect the proportions of other immune cell populations in lymphoid tissues (Extended data Fig. 2k, l). Mixed bone marrow chimeras using WT and mice lacking XBP1 in the entire hematopoietic compartment demonstrated normal T cell reconstitution (Extended data Fig. 2m). Proliferation and cell cycle progression was unaltered in CD4+ T cells lacking XBP1 (Extended data Fig. 2n, o). Hence, XBP1 appears to be dispensable for T cell development and baseline functions in naïve mice.
Glucose starvation for 6 h triggered Xbp1 splicing and induction of UPR gene markers (Extended Data Fig. 3a) in CD4+ T cells previously activated via CD3/CD28 stimulation. Glutamine withdrawal alone did not induce IRE1α-XBP1 at the time point analyzed, suggesting that T cells primarily activate this pathway in response to glucose limitation. Mitochondrial respiration was comparable in WT versus XBP1-deficient CD4+ T cells when glucose was present (Fig. 3a). The maximal OCR in WT CD4+ T cells decreased by ~50% upon glucose withdrawal, but XBP1-deficient CD4+ T cells demonstrated superior mitochondrial respiratory capacity in this condition (Fig. 3a), supporting our observations using IRE1α inhibition (Fig. 2j) or GlcNAc supplementation in ascites-exposed human CD4+ T cells (Fig. 2k). T cell mitochondrial structure, morphology or mass were not affected by XBP1 deficiency, and expression of PGC1α also remained unaltered even upon glucose withdrawal or glycolysis inhibition (Extended data Fig. 2p-r). Thus, XBP1 might restrain the utilization of alternative carbon sources that support mitochondrial respiration in the absence of glucose.
Figure 3. XBP1 limits glutamine influx in glucose-deprived CD4+ T cells.

a, c-d, Naïve splenic CD4+ T cells isolated from WT (solid bars) or XBP1-deficient (hatched bars) mice were activated via CD3/CD28 stimulation for 48 h and then incubated for 6 h in the indicated media. a, Maximal OCR of T cells in the presence or absence of glucose (n = 5). b, Glutamine tracing was performed as described in the methods and relative abundance of total 13C-labeled metabolites was determined (n = 4). Immunoblot (c) and quantification (d) of glutamine transporters in the indicated T cells (n = 5 total from five independent experiments). OCR profile (e) and maximal OCR (f) in DMKG-treated WT T cells (n = 14). Data are presented as relative expression compared with WT T cells incubated in the presence of glucose (a, d, f). OCR profile (g) and maximal OCR (h) for SNAT1-overexpressing human CD4+ T cells exposed to OvCa ascites (n = 4). Data are shown as relative expression compared with control virus-transduced T cells that were not exposed to ascites. n-values represent biologically independent samples (a, b, d, f, h). Data are shown as mean ± s.e.m. One-way ANOVA with Tukey’s post-test (a, b, d); Two-tailed paired Student’s t-test (f, h); *P < 0.05, **P < 0.01, ***P < 0.001, ****P < 0.0001.
Glutamine metabolism maintains the TCA cycle in response to glucose deprivation or reduced pyruvate supply22. Indeed, blocking mitochondrial glutamine utilization in glucose-deprived CD4+ T cells further reduced their maximal OCR (Extended Data Fig. 3b). Since glutamine consumption in hematopoietic cells depends on glucose availability23, we hypothesized that XBP1 activation under glucose restriction could impact this process. Glucose starvation impaired [U-13C]-glutamine uptake in WT CD4+ T cells, but XBP1-deficient T cells in the same condition exhibited superior glutamine import and utilization, as evidenced by increased 13C enrichment in glutamine, glutamate and various TCA cycle metabolites (Extended Data Fig. 3c-i). Consequently, glucose-deprived T cells lacking XBP1 maintained higher levels of total mitochondrial metabolite pools derived from [U-13C]-glutamine compared with their WT counterparts (Fig. 3b). Hence, XBP1 restricts glutamine influx in T cells under glucose starvation.
IRE1α-XBP1 activation can mediate the degradation of glutamine transporters under ER stress by activating the Endoplasmic Reticulum-Associated Degradation (ERAD) system24–26, likely as a strategy to dampen metabolism under adverse conditions. Glucose withdrawal decreased the protein levels of the glutamine transporters ASCT2, SNAT1 and SNAT2 in WT CD4+ T cells (Fig. 3c, d). However, their XBP1-deficient counterparts demonstrated higher transporter expression under the same condition (Fig. 3c, d), which was confirmed by immunofluorescence confocal microscopy (Extended Data Fig. 4a, b). Loss of XBP1 did not modulate expression of genes encoding glutamine carriers under glucose limitation (Extended Data Fig. 4c), but treatment with the proteasome inhibitor MG132 restored SNAT1 levels in WT T cells experiencing ER stress due to glucose limitation (Extended Data Fig. 4d, e). These data suggest that XBP1 activation restricts glutamine influx in glucose-deprived CD4+ T cells by controlling the abundance of glutamine carriers, likely via post-translational regulatory mechanisms.
Cells catabolize glutamine into alpha-ketoglutarate (α-KG) to replenish TCA cycle intermediates and sustain mitochondrial respiration22. Treatment with dimethyl-αKG (DMKG), a cell permeable analog of α-KG, improved maximal mitochondrial respiration in T cells under glucose restriction (Fig. 3e, f). Ascites-exposed human CD4+ T cells, unable to import glucose and demonstrating IRE1α/XBP1-driven mitochondrial dysfunction (Fig. 2), also showed reduced glutamine transporters levels (Extended Data Fig. 5a, b), but DMKG treatment was sufficient to increase their maximal respiratory capacity in this milieu (Extended Data Fig. 5c, d). Furthermore, overexpressing SNAT1 (Extended Data Fig. 5e, f) markedly enhanced mitochondrial function in human CD4+ T cells exposed to patient-derived OvCa ascites (Fig. 3g, h). These results indicate that glucose restriction causes T cell mitochondrial dysfunction through XBP1-mediated inhibition of glutamine influx, and that overexpressing glutamine transporters or supplementing glutamine-derived TCA intermediates, such as α-KG, can restore mitochondrial respiration in ascites-exposed T cells.
We developed orthotopic ovarian cancer in female mice lacking XBP1 in T cells to evaluate the role of this pathway in vivo. CD4+ and CD8+ T cells isolated from ovarian tumors driven by p53 loss and mutant-KRas27, or from ascites and spleens of hosts bearing metastatic ID8-Def29b/Vegf-A OvCa28 demonstrated marked overexpression of total and spliced Xbp1 transcripts, as well as robust induction of UPR gene markers (Extended data Fig. 6a, b). However, OvCa-associated T cells did not present signs of regulated IRE1α-dependent mRNA decay (RIDD) (Extended data Fig. 6c, d).
Transcriptomic analyses identified 151 differentially expressed genes in WT versus XBP1-deficient CD4+ T cells residing in the ascites of mice bearing metastatic ID8-Def29b/Vegf-A OvCa28. T cell activation-related genes such as Cd69, Cd44, Cd28 and Nfkb1, as well as mediators of anti-tumor immunity such as Ccl5, Ifng, Klrk1 and Fasl were upregulated in XBP1-deficient CD4+ T cells in the ascites, compared with their WT counterparts (Fig. 4a). These genes were not differentially expressed in WT versus XBP1-deficient splenic CD44hi CD62Llo CD4+ T cells sorted from naïve mice (Extended data Fig. 7a), demonstrating a context-specific function for XBP1 in OvCa-associated T cells. Loss of XBP1 did not cause RIDD29, nor altered expression of transcription factors governing helper T cell differentiation or CD4+ Treg proportions at tumor sites (Extended data Fig. 7b-d). Immunosuppressive gene signatures driven by TGFβ1, PGE2, and IL-10 signaling were predicted to be repressed in XBP1-deficient CD4+ T cells present in OvCa ascites, while immuno-activating gene networks induced by ETS1, CD40 ligand engagement and protein kinases such as RIPK2 and MAP3K14 were activated in these cells (Extended data Fig. 7e). Accordingly, downstream cellular functions such as activation, proliferation and migration of immune cells were predicted to be induced in ascites-infiltrating CD4+ T cells lacking XBP1 (Extended data Fig. 7f). OvCa-bearing mice lacking XBP1 in T cells had increased proportions of CD4+ T cells secreting IFN-γ at tumor sites compared with their WT counterparts, while the frequency of infiltrating IL-17-producing CD4+ T cells remained unaltered (Fig. 4b). Of note, only tumor antigen-specific CD4+ T cells devoid of XBP1 demonstrated maximal IFN-γ production in the OvCa microenvironment (Fig. 4c). XBP1-deficient intratumoral CD8+ T cells also showed enhanced effector profiles as evidenced by increased IFN-γ and perforin expression, even at advanced tumor stages, compared with their WT counterparts (Extended Data Fig. 7g, h). XBP1 ablation did not influence glucose import, but increased the mitochondrial membrane potential of CD44hi CD4+ T cells at tumor sites compared with WT controls (Extended Data Fig. 7j, k). Expression of PD-1, CTLA-4, or Tim-3 was not altered (Extended data Fig. 7l), suggesting that the enhanced effector profile of XBP1-deficient T cells is likely to be independent of immune checkpoint signaling.
Figure 4. T cell-intrinsic IRE1α-XBP1 signaling promotes OvCa progression.
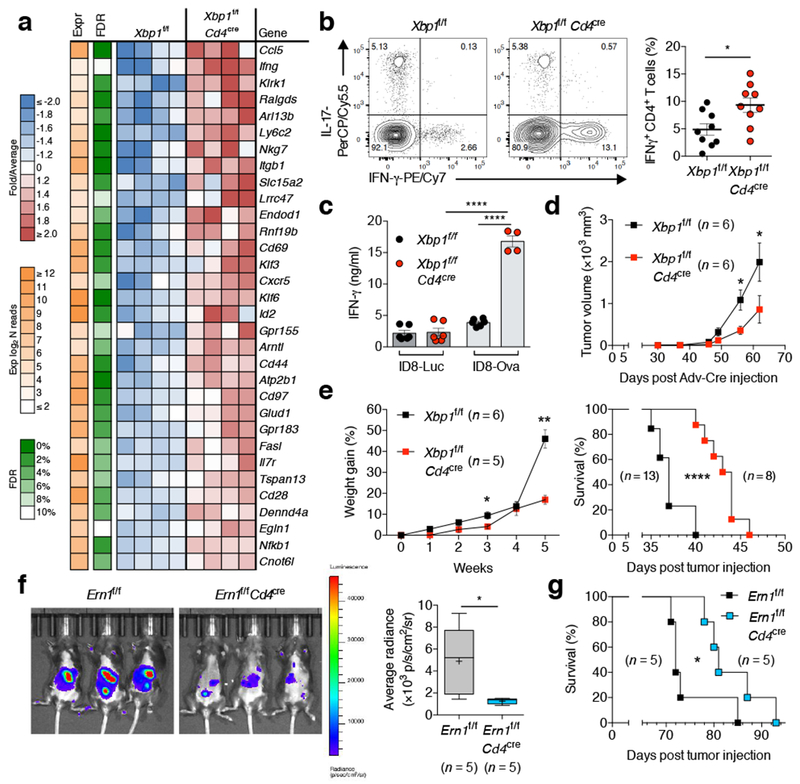
a, Transcriptional profiling of WT versus XBP1-deficient CD4+ T cells sorted from the peritoneal cavity of mice bearing metastatic ID8-Def29/VegfA OvCa for 20 days. Top upregulated genes in XBP1-deficient CD4+ T cells are shown (n = 4). b, FACS analyses of OvCa-associated CD4+ T cells from the indicated mice bearing metastatic OvCa for 20–23 days. Representative intracellular staining for IFN-γ and IL-17 (left) and global IFN-γ analysis (right) in CD45+CD3+CD4+ T cells (n = 9). c, IFN-γ secretion by CD4+ T cells isolated from the peritoneal cavity of the indicated OvCa-bearing mice upon ex vivo stimulation with OVA peptide (n = 6 for all groups except for XBP1-deficient hosts challenged with ID8-ova). d, Growth of p53/K-ras-driven ovarian tumors in hosts reconstituted with bone marrow from the indicated genotypes (n = 6). e, Ascites accumulation (left, n = 5–6) and overall survival (right, n = 8–13) for the indicated mice bearing ID8-Def29/Vegf-A OvCa. f, Imaging (left) and quantification (right) of peritoneal carcinomatosis in Ern1f/f or Ern1f/f Cd4cre mice bearing luciferase-expressing ID8 OvCa for 20 days (n = 5). g, Survival rates for mice depicted in panel f. n-values represent biologically independent mice (a-g). Data are shown as mean ± s.e.m. (b, c, d, e). Boxes represent median ± interquartile range and whiskers indicate minimum and maximum (f). Two-tailed Student’s t-test (b); One-way ANOVA with Tukey’s post-test (c); Two-tailed Mann-Whitney test (d, e, f); Log-rank test (e, g). *P < 0.05, **P < 0.01, ****P < 0.0001.
IFN-γ overexpression emerged as a top biomarker of enhanced effector function by CD4+ T cells lacking XBP1. We sought to validate these findings in the human context. Exposure to patient-derived OvCa ascites dampened IFN-γ production by CD4+ T cells (Extended Data Fig. 8a, b), but disabling IRE1α-XBP1 with 4μ8C partly alleviated this effect while enhancing T cell mitochondrial respiration (Extended Data Fig. 8c-e). 4μ8C had minimal effects on T cell viability, T-bet or RORγt expression in ascites-exposed CD4+ T cells (Extended Data Fig. 8f-h). Notably, enforcing SNAT1 expression in T cells also augmented their capacity to express IFN-γ under glucose deprivation or OvCa ascites exposure (Extended Data Fig. 8i).
We next assessed whether IRE1α-XBP1 activation in T cells influenced malignant progression. Growth of p53/K-ras-driven ovarian tumors27 was compromised in female hosts whose hematopoietic compartment lacked XBP1 selectively in T cells (Fig. 4d). Reduced tumor growth was also evidenced in Xbp1f/f Cd4cre female mice challenged with ID8-based OvCa cells in the flank (Extended Data Fig. 7m). Female mice lacking XBP1 in T cells showed decreased ascites accumulation and increased survival when challenged with metastatic ID8-Def29b/Vegf-A tumors28 (Fig. 4e). Similar results were observed when these tumors were developed in Ern1f/f Cd4cre mice (Extended Data Fig. 7n), indicating that canonical IRE1α-XBP1 activation in T cells, rather than XBP1-independent IRE1α kinase signaling or RIDD29, is responsible for the delayed OvCa progression observed in XBP1-deficient hosts. Indeed, Ern1f/f Cd4cre mice bearing parental ID8 tumors30 that do not overexpress Defb29 and Vegf-A also showed reduced peritoneal carcinomatosis and extended survival compared with their Ern1f/f littermate controls (Fig. 4f, g).
Here, we present experimental evidence indicating that OvCa exploits the IRE1α-XBP1 arm of the UPR to cripple T cell metabolism and anti-tumor capacity. While the UPR normally facilitates adaptation to ER stress under nutrient-rich conditions, our findings suggest that T cells experience maladaptive IRE1α-XBP1 activation within tumors where glucose availability is restricted (Extended Data Fig. 9). We propose that disruption of ER homeostasis in intratumoral T cells operates as an integrated “immunometabolic checkpoint” influencing adaptive immunity and malignant progression in cancer hosts.
METHODS
Patient-derived specimens
Stage III-IV human ovarian carcinoma tumors and malignant ascites fluid were procured through Surgical Pathology at Weill Cornell Medicine and Memorial Sloan Kettering Cancer Center. The Weill Cornell Medicine IRB conducted a review of the project described and determined that the activities do not constitute human subjects research as these specimens were classified as surgical discard and remained totally de-identified. Collection and analysis of OvCa specimens at Memorial Sloan Kettering Cancer Center were approved by an institutional IRB protocol and were obtained under informed consent. Tumor single-cell suspensions were prepared as previously described28. Malignant ascites samples were centrifuged for 10 min at 1,300rpm. Ascites supernatants were collected, depleted of cells by passing through 0.22μm filters, and stored frozen at −80°C as in small aliquots until use. Red blood cells in cell pellets were lysed with ACK lysing buffer (Gibco). Tumor infiltrating T cells (CD45+CD20−CD14−CD3+ CD4+ or CD8+) were sorted from tumor single cell suspensions or malignant ascites using a BD FACSAria II SORP cell sorter at Flow Cytometry Core Facility in Weill Cornell Medicine. Dead cells were excluded using the LIVE/DEAD Fixable Yellow Dead Cell Stain Kit (Life Technologies). All OvCa specimens used and analyzed in this study are described in Supplementary Table 1.
Transgenic mice and experimental OvCa models
Mice devoid of XBP1 or IRE1α selectively in T cells were generated by breeding Xbp1f/f or Ern1f/f transgenic mice with the Cd4-Cre strain31,32. All mouse strains are on a full C57BL/6 background and female mice were used at 6–8 weeks of age. Mice were housed in specific pathogen-free animal facilities at Weill Cornell Medical College and Memorial Sloan Kettering Cancer Center. Mice were handled in compliance with Weill Cornell Institutional Animal Care and Use Committees procedures and guidelines. Gene-deficient mice were housed separately from wild-type littermate controls after genotyping at 3–4 weeks of age. Functional and survival experiments were conducted using age-matched, littermate controls. In vivo experiments included three to six mice per group, based on transgenic genotype and sex availability. No randomization or blinding method was used for animal studies. Wild type C57BL/6 mice were purchased from Jackson Laboratories.
Double transgenic LSL-K-rasG12D/+p53loxp/loxp (p53/K-ras) mice were generated as previously reported27. p53/K-ras mice were irradiated two consecutive days with 650 rads followed by bone marrow transplantation from either Xbp1f/f or Xbp1f/f Cd4cre mice. At 8 weeks post bone marrow reconstitution, ovarian tumors were initiated by injecting Cre recombinase-expressing adenovirus into the ovarian bursa. Tumor size was measured and volume was estimated using the formula V = 0.5 (Length × Width2). Mice were sacrificed 9 weeks after tumor initiation and tumors were resected. Specimens were minced, digested for 1h at 37°C in RPMI containing 2mg/ml collagenase D and 1mg/ml DNAse I and then passed through a 70μm strainer to obtain single cell suspensions. Red blood cells were eliminated using ACK lysis buffer (Gibco), and cell suspensions of 5–10 × 107 cells/ml were stored in freezing media (FBS containing 10% DMSO) at −80°C.
Parental ID8 cells expressing luciferase (ID8-Luc) or ovalbumin protein (ID8-Ova), and aggressive ID8-Defb29/Vegf-A cancer cell-lines were generated as previously described28,30. Briefly, 1.5 × 10⁶ tumor cells were injected into the peritoneal cavity or right flank using Matrigel (Corning) of WT or transgenic mice described above. For live bioluminescent imaging, mice were given a single intraperitoneal injection of VivoGlo luciferin (Promega) and imaged with an IVIS Spectrum In Vivo imaging system at the Weill Cornell Research Animal Resource Center. To assess antigen-specific anti-tumor responses, Xbp1f/f or Xbp1f/f Cd4cre female mice were independently challenged with ID8-Luc or ID8-Ova. Tumor-associated CD4+ T cells were simultaneously isolated from the peritoneal cavity of all mice 35 days after tumor challenge. Then, 5 × 10⁵ T cells were co-cultured for 3 days with 1 × 10⁵ BMDCs previously pulsed with OVA323–339 peptide (1μg/ml, InvivoGen). Cell culture supernatants were collected and IFN-γ concentration was determined by ELISA using the Ready-SET-Go kit (eBioscience).
To generate bone marrow chimeras, recipient CD45.1+ C57BL/6 mice were fed with a Sulfatrim diet during 7 days prior to irradiation. Animals were then exposed to a single lethal dose of irradiation (1,000rads). 24 h later, 5 × 10⁶ total bone marrow cells from a 1:1 mixture of wild-type CD45.1+ C57BL/6 and CD45.2+ Xbp1f/f or Xbp1f/f Vav1cre bone marrow cells were injected intravenously into the irradiated recipient hosts. Mice were maintained on a Sulfatrim-based diet until analyzing the donor-derived cells in bone marrow and spleen by flow cytometry.
CD4+ T cell isolation and in vitro cell culture
Peripheral blood mononuclear cells (PBMCs) from cancer-free female donors (New York Blood Center) were isolated by density gradient centrifugation using Ficoll (GE Healthcare). CD4+ T cells were then enriched by negative selection using the human CD4+ T cell isolation kit (Miltenyi Biotech). Unless noted otherwise, CD4+ T cells were stimulated with Dynabeads human T-activator CD3/CD28 (Thermo Fisher Scientific) at a 1:1 ratio for 16 h in the presence or absence of OvCa ascites supernatants at the indicated concentrations. Depending on sample availability, all functional assays involving glucose uptake, IRE1α-XBP1 activation, bioenergetics and INF-γ secretion were performed using at least 3 distinct donor CD4+ T cells independently exposed to ascites supernatants obtained from 2–7 different OvCa patients.
Mouse tumor-infiltrating T cells (CD45+CD3+CD4+ or CD8+) were sorted from various sources including single-cell suspension of p53/K-ras-driven ovarian tumors, spleen, draining lymph nodes, and peritoneal wash, malignant ascites and spleen from mice bearing aggressive ID8-Defb29/Vegf-A ovarian cancer. Mouse splenic naïve CD4+ T cells were isolated by negative selection (Miltenyi Biotech) and then activated with plate-bound anti-CD3ε (145–2C11, 5μg/ml) and soluble anti-CD28 (37.51, 1μg/ml; BD Pharmingen) for 48 h. All CD4+ T cells were cultured in complete RPMI, which is glucose-rich RPMI-1640 medium (Corning) further supplemented with 10% heat-inactivated FBS (Atlanta Biologicals), 2mM L-glutamine (Corning), 25mM HEPES, pH 7.2–7.6 (Corning), non-essential amino acids (Corning), 1mM sodium pyruvate (Gibco), 100 IU penicillin and 100 μg/ml streptomycin (Corning) and 55μM 2-mercaptoethanol (Gibco).
RNA extraction, RT-PCR, quantitative RT-PCR and XBP1 splicing assays
Total RNA was isolated using RNeasy Mini kit or QIAzol lysis reagent (Qiagen) according to the manufacturer’s instructions. 0.1–1 μg of RNA was reverse-transcribed to generate cDNA using the qScript cDNA synthesis kit (Quantabio). Quantitative RT-PCR was performed using PerfeCTa SYBR green fastmix (Quantabio) and TaqMan Universal PCR master mix (Life Technologies) on a QuantStudio 6 Flex real-time PCR system (Applied Biosystems). Normalized gene expression was calculated by comparative threshold cycle method using ACTB, GAPDH or Actb as a control.
XBP1 splicing assay was performed as previously described33. The PCR products were separated by electrophoresis through a 2.5% agarose gel and visualized by ethidium bromide staining. The ImageJ software via densitometry was used for calculating the frequency of XBP1 mRNA splicing (%) as follows: intensity of XBP1s band/[intensity of XBP1s + XBP1u band] × 100.
All primers and Taqman probes used in this study are described in Supplementary Table 3.
Flow cytometry-based analyses
Flow cytometry was conducted using fluorochrome-conjugated antibodies purchased from BioLegend, unless stated otherwise. For staining of mouse cells we used: anti-CD45 (30-F11), anti-CD4 (RM4–5), anti-CD8 (53–6.7), anti-CD3 (145–2C11), anti-TCRβ (H57–597), anti-CD44 (IM7), anti-CD62L (MEL-14), anti-CD11b (M1/70), anti-CD11c (N418), anti-CD19 (6D5), anti-F4/80 (BM8), anti-Ly6C (HK1.4), anti-Ly6G (1A8), anti-I-A/I-E (M5/114.15.2), anti-IFN-γ (XMG1.2), anti-IL-17A (TC11–18H10.1), anti-FoxP3 (150D), anti-PD-1 (29F.1A12), anti-CTLA4 (UC10–4B9), anti-TIM3 (B8.2C12), TruStain fcX CD16/32 (93); anti-Perforin (17–9392-80, eBioscience). To stain human cells we utilized: anti-CD45 (HI30), anti-CD3 (HIT3), anti-CD4 (A161A1), anti-CD8 (HIT8a), anti-CD20 (2H7), anti-CD14 (63D3), anti-IFN-γ (4S.B3), anti-T-bet (4B10), TruStain FcX solution (422302); anti-XBP1s (Q3–695; BD Pharmingen); anti-RORγt (AFKJS-9, eBioscience). Staining of transcription factors XBP1s and FoxP3 and cytokines was carried out using FoxP3/Transcription factor staining buffer set (eBioscience) according to manufacturer’s instructions. For in vitro glucose uptake experiments, 2 × 10⁵ human CD4+ T cells were incubated with 20μM 2-NBDG (Thermo Fisher Scientific) in glucose-free media for 30 min at 37°C. To measure intracellular ROS levels, cells were stained with 20μM DCFDA (Abcam) for 30 min at 37°C. The surface expression of GLUT1 in T cells residing in human OvCa ascites was analyzed using GLUT1.RBD.GFP (Metafora Biosystems) according to manufacturer’s instructions. Briefly, 2 × 10⁵ cells were labeled with 5μl GLUT1.RBD.GFP in 100μl of complete RPMI containing 0.09% NaN3 and 1mM EDTA and incubated for 30 min at 37°C. Then cells were washed with PBS followed by cell surface staining. To characterize OvCa-infiltrating CD4+ T cells, peritoneal wash samples from Xbp1f/f or Xbp1f/f Cd4cre female mice bearing metastatic ID8-Defb29/Vegf-A ovarian cancer for 20–23 days were used. For intracellular cytokine staining, 5 × 10⁶ cells from peritoneal wash samples were stimulated for 6 h in complete RPMI containing cell activation cocktail with brefeldin A (Biolegend). For 2-NBDG uptake in vivo, tumor-bearing mice were injected intraperitoneally with 100μg 2-NBDG per mouse diluted in PBS and then, mice were humanely euthanized 30 min after injection for collecting peritoneal cells. To measure mitochondrial membrane potential, peritoneal wash cells were stained with 200nM TMRE (Thermo Fisher Scientific) dye for 30 min at 37°C followed by cell surface staining. To visualize proliferation assays, T cells were labeled with 5 μM CellTrace Violet (Thermo Fisher Scientific) at 37°C for 30 min. Cell cycle of preactivated CD4+ T cells were analyzed by staining DNA with 50 μg/ml propidium iodide solution containing 0.5 μg/ml RNase I after fixing the cells in cold 70% ethanol for 1 h at 4°C. Preactivated CD4+ T cells for 48 h were loaded with MitoTracker (20 nM, Thermo Fisher Scientific) to measure mitochondrial mass. All events were acquired on an LSRII (BD Biosciences) and data were analyzed with FlowJo software (TreeStar).
Immunoblot analysis
T cells were washed twice in 1X cold PBS and cell pellets were lysed using RIPA lysis and extraction buffer (Thermo Fisher Scientific) supplemented with a protease and phosphatase inhibitor tablet (Roche). Homogenates were centrifuged at 14,000 rpm for 30 min at 4°C, and the supernatants were collected. Protein concentrations were determined using a BCA protein assay kit (Thermo Fisher Scientific). Equivalent amounts of protein were separated via SDS-PAGE and transferred onto PVDF membranes following the standard protocol. Following antibodies were used: anti-GLUT1 (D3J3A), anti-β-ACTIN (4967S), anti-ASCT2 (V501), and anti-SNAT1/SLC38A1 (D9L2P) (Cell Signaling Technologies); anti-PGC-1α (H-300) and anti-SNAT2 (C-6) (Santa Cruz Biotechnology); and goat anti-rabbit and mouse secondary antibodies conjugated with HRP (Thermo Fisher Scientific). SuperSignal West Pico and Femto chemiluminescent substrates (Thermo Fisher Scientific) were used to image blots in a FluorChemE instrument (ProteinSimple). The proteasomal inhibitor MG132 (10 μM, Sigma) and translation inhibitor cycloheximide (CHX, 50 μg/ml, Sigma) were used to assess protein abundance and stability. Densitometric quantification was performed using Image J software (NIH).
Seahorse analyses
Purified CD4+ T cells from cancer-free female donors were stimulated with human T-activator CD3/CD28 Dynabeads (Life Technologies) in complete RPMI media containing 10% fetal bovine serum in the presence or absence of OvCa ascites supernatants for 16 h. The effect of IRE1α inhibition using 4μ8C (10 μM, EMD Millipore) or GlcNAc supplementation (10 mM, Sigma) was examined by pre-treating T cells 1–2 h before addition of human OvCa ascites. DMKG (5 mM, Sigma) was added in the cell culture during the last 4 h incubation. After incubation, T cells were harvested, thoroughly washed and then subjected to Seahorse analyses using non-buffered XF base media containing 25mM glucose (Sigma), 2mM L-glutamine, and 1mM sodium pyruvate, but lacking serum or ascites. XF96 cell culture microplates were coated with CellTak (Corning) prior to the analysis according to the manufacturer’s instructions and washed twice with distilled water. Unless stated otherwise, 1.5 × 10⁵ T cells were plated and oxygen consumption rates (OCR) and extracellular acidification rates (ECAR) were analyzed on an XFe96 Extracellular Flux Analyzer (Agilent). After basal OCR and ECAR measurements were obtained, OCR trace was recorded in response to oligomycin (1 μM), Carbonyl cyanide-p-(trifluoromethoxy) phenylhydrazone (FCCP, 1 μM), and rotenone/antimycin (0.5 μM each) following the XF Cell Mito Stress test kit (Agilent). To evaluate mitochondrial fuel usage, T cells were seeded in the Seahorse media containing 2mM L-glutamine +/− 25mM glucose. After recording basal OCR and ECAR measurements, cells were injected with corresponding base media (control), UK5099 (2 μM), BPTES (3 μM), and etomoxir (4 μM) using the XF Mito Fuel Flex test kit (Agilent) followed by oligomycin, FCCP and rotenone/antimycin injection. Metabolic parameters were calculated as follow: [Basal OCR] = [last rate measurement before Oligo injection] – [minimum rate measurement after R+A injection]; [Maximal OCR] = [maximum rate measurement after FCCP injection] – [minimum rate measurement after R+A injection]. Typically, 3–6 technical replicates per each sample were examined. After analysis, the cell numbers of each well were determined by nuclear DNA staining with Hoechst 33342 (Sigma) and OCR and ECAR values were normalized accordingly.
Glutamine tracing experiments
For stable isotope tracer experiments, naïve splenic CD4+ T cells isolated from WT or XBP1-deficient mice were activated via CD3/CD28 stimulation for 48 h, followed by culture in the presence or absence of glucose for 4.5 h, and then pulsed with [U-13C]-glutamine (Sigma) for an additional 1.5 h in the same culture condition. After washing twice with cold PBS, metabolites were extracted from the cells by methanol extraction method34. Briefly, pre-cooled 80% methanol (1 mL) was added to each sample and kept in −80 °C for 20 minutes. Samples were then centrifuged at 4 °C for 5 minutes at 14,000 rpm. The supernatants were extracted and normalized based on cell amount. Targeted LC-MS analyses were performed on a Q Exactive Orbitrap mass spectrometer (Thermo Fisher Scientific) coupled to a Vanquish UPLC system (Thermo Fisher Scientific). The Q Exactive operated in polarity-switching mode. A Sequant ZIC-HILIC column (2.1 mm i.d. × 150 mm, Merck) was used for separation of metabolites. Flow rate was set at 150 μL/min. Buffers consisted of 100% acetonitrile for mobile A, and 0.1% NH4OH/20 mM CH3COONH4 in water for mobile B. Gradient ran from 85% to 30% A in 20 min followed by a wash with 30% A and re-equilibration at 85% A. Metabolites were identified on the basis of exact mass within 5 ppm and standard retention times. Relative metabolite quantitation was performed based on peak area for each metabolite. Tracing experiments were performed at the Proteomics and Metabolomics Core Facility of Weill Cornell Medicine.
Immunofluorescence and confocal microscopy
Cells were transferred onto poly-L-lysine pre-coated glass coverslips (Neuvitro) and incubated at 37 °C for 30 min. The coverslips were washed with cold PBS three times between each step. Cells were immediately fixed with ice-cold acetone for 10 min at room temperature. Then, the coverslips were blocked for 1 h in PBS containing 0.25 % Triton X-100 and 5 % FBS at 4 °C, followed by incubation at 4 °C overnight with primary antibodies rabbit anti-ASCT2 (V501, Cell Signaling Technologies, 1:200) and mouse anti-SNAT2 (C-6) (Santa Cruz Biotechnology, 1:200) in PBS containing 5% FBS, protected from light. Then, secondary antibodies Alexa Fluor 488-conjugated goat anti-rabbit IgG and Alexa Fluor 594-conjugated goat anti-mouse IgG (Molecular Probes, 1:400) were added for 1 h at room temperature in the dark. Cells were counterstained with 4’,6-diamidino-2-phenylindole (DAPI, Thermo Fisher Scientific, 0.5 μg/ml) for 5 min at room temperature in the dark. After washing and removing excess solution, the flipped coverslips were placed on the mounting medium (Southern Biotechnology). Slides were allowed to dry in the dark for 1 h in a humid chamber at room temperature. Slides were then sealed with fingernail polish before examination. Digital confocal images were captured on a Zeiss LSM 880 Confocal Microscope with the Airy Scan high resolution detector at the Weill Cornell CLC Imaging Core Facility. Image J software was used to determine the average pixel intensity of 16-bit greyscale images from each channel, individually. A region of interest (ROI) was drawn around an individual cell that was not in contact with other cells, and the mean intensity was recorded. Approximately 50 cells in a field, from three independent slides, were quantified to calculate average fluorescence intensity (n = 150 total cells)
Retroviral transduction
The coding region of SLC38A1 (NM_001278387.1), the gene encoding human SNAT1, was amplified using cDNA originated from healthy PBMCs as a template and the following PCR primers: 5’-GAATTCGCCACCATGATGCATTTCAAAAGTGGACTCGA-3’ (forward); 5’-GCGGCCGCTCAGTGGCCTTCGTCACTACTCG-3’ (reverse). The PCR product was cloned into the pBMN-I-GFP retroviral expressing vector (Addgene) and subsequently transfected into Phoenix-AMPHO (ATCC) retrovirus producer cell line using Lipofectamine 3000 (Invitrogen) to generate retroviruses. Cell culture supernatants containing virus were collected at 48 h and 72 h post-transfection. Virus was then bound to 24 well non-tissue culture treated plates previously coated with RetroNectin (70 μg/ml, Takara Bio) by centrifugation at 2,000 g for 2 h at 37 °C. Human CD4+ T cells were stimulated with anti-CD3/CD28 Dynabeads (Life Technologies) in the presence of recombinant human IL-2 (50 units/ml, PeproTech) for 36 h before viral transduction. Typically, 1 × 10⁶ T cells were added to each virus-coated well by brief centrifugation at a final concentration of 2× 10⁶ cells/ml containing 50 units/ml of IL-2 and second transduction was followed 24 h later as the same strategy. GFP+ cells were sorted 48 h post-transfection and expanded with anti-CD3/CD28 stimulation in the presence of IL-2 for additional 48 h, for downstream assays.
ELISA
8 × 10⁴ human CD4+ T cells were activated for 12 h and subsequently incubated for additional 36 h in the presence of 25% ascites. To test the impact of IRE1α inhibition on IFN-γ secretion, T cells were activated for 36 h, treated with 4μ8C at 10 μM (or DMSO control) 2 h prior to adding 25% human OvCa ascites, and incubated for additional 10 h. The concentration of IFN-γ in culture supernatants was determined by ELISA using the Ready-SET-Go kit (eBioscience). Importantly, IFN-γ was undetectable in ascites supernatants when used at 25%. Cell viability and counts were comparable in all cases.
RNA-seq and transcriptional profiling
Tumor infiltrating CD4+ T cells (CD45+CD3+CD4+) were sorted from peritoneal wash samples of Xbp1f/f or Xbp1f/f Cd4cre female mice bearing aggressive ID8-Defb29/Vegf-A ovarian cancer for 20 days. CD44hi CD62Llo CD4+ T cells were sorted from the spleen of naïve Xbp1f/f or Xbp1f/f Cd4cre female mice. miRVana miRNA isolation kit (Ambion) and RNeasy MinElute kit (Qiagen) were used for total RNA isolation and concentration. All samples were passed RNA quality controls examined by Agilent Bioanalyzer 2100, and mRNA libraries were generated and sequenced at the Weill Cornell Epigenomics Core Facility.
Reads produced from 51bp single end sequencing runs were aligned against mouse genome (mm9) using Bowtie v0.12.8 algorithm35. Mouse mm9 transcriptome information was obtained from UCSC Genome Browser36 and the RSEM algorithm37 was used to calculate number of aligned tags for each gene. Differential expression between two groups were tested by EdgeR38 and genes that had at least 50 raw counts and passed False Discovery Rate (FDR) cutoff of 15% with at least 1.5 fold difference were considered significant. Official symbol and gene description information was obtained from NCBI Entrez information39. Normalized expression RPKM (Reads Per Kilobase of transcript per Million mapped reads) values were generated by EdgeR and used to demonstrate gene expression across samples as color-coded fold change of expression in a sample versus average expression across all samples. Functional enrichment analysis was done using Ingenuity Pathway Analysis (Qiagen).
Transmission electron microscopy
Pre-activated mouse CD4+ T cells were fixed, dehydrated, embedded and sectioned for electron microscopy analysis following standard protocol at Weill Cornell CLC Imaging Core Facility. Sections were viewed on a JEM 1400 Transmission Electron Microscope (JEOL) operated at 120 kV and digital images were acquired with a Veleta 2K × 2K charge-coupled device camera (Olympus-SIS).
Protein glycosylation assessment via LC-MS/MS
LC-MS grade formic acid (FA), acetonitrile (ACN) and water were purchased from Fisher Chemical. Trifluoroacetic acid (TFA) was acquired from Fluka. Dithiothreitol (DTT) and iodoacetomide (IAM) was purchased from Roche and Acros Organics, respectively.
Protein extraction, digestion and glyco-peptide enrichment
Samples were individually prepared for future peptide and protein identification and comparison. Human CD4+ T cells were activated with anti-CD3/CD28 beads +/− 50% ascites supernatants for 16 h. Cells were lysed using RIPA buffer and protein quantification was performed using the Pierce BCA Protein Assay kit (Thermo Fisher Scientific). 0.8 mg of cell lysates were enriched for glycoproteins using the Con A-based Pierce Glycoprotein Isolation kit (Thermo Fisher Scientific). Then, enriched fractions were concentrated by centrifugation and buffer exchange using the Amicon Ultra-0.5 Centrifugal Filter Unit with Ultracel-3 membrane (Millipore) according to manufacturer protocol with the exchange buffer consisting of 4 M Urea, 1 M Thiourea and 50 mM TEAB at pH 8.5. Proteins were reduced with 10 mM DTT, incubated at 34 ºC for 1 hour, then alkylated with 58 mM iodoacetamide for 45 minutes in the dark at room temperature and then quenched by final 36 mM DTT. The solutions were then diluted with 50mM Ammonium Bicarbonate (pH 8.0) to a final buffer concentration of 1M Urea prior to trypsin digestion. Each sample was digested with 0.8 μg of trypsin for 18 h at 37 °C. The digestion was stopped by addition of TFA to a final pH 2.2–2.5. The samples were then desalted with SOLA HRP SPE Cartridge (Thermo Fisher Scientific). First, the cartridges were conditioned with 1 × 0.5 mL 90% methanol, 0.1% trifluoroacetic acid (TFA) and equilibrated with 2 × 0.5 mL 0.1% TFA. The samples were diluted 1:1 with 0.2% TFA and ran slowly through cartridges. After washing with 2 × 0.5 mL of equilibration solution, peptides were eluted by 1 × 0.5 mL of 50% acetonitrile (ACN), 0.1 % TFA and dried in a speed vacuum centrifuge. Glycosylated peptides were enriched on SOLA SAX SPE Cartridge (Thermo Fisher Scientific). Cartridges were conditioned with 1 × 1.0 mL of 100% ACN followed by 3 × 1.0 mL of 0.1 M triethylammonium acetate buffer (pH 7.0), washed with 1 × 1.0 mL ddH2O and equilibrated with 1 × 1.0 mL 95% ACN, 1.0% TFA. Samples were reconstituted in 60 µL of 50% ACN, 0.1% TFA and loaded onto columns right after the equilibration step allowing slow flow through. Cartridges were washed three times with 1.0 mL of equilibration solution and peptides were eluted twice with 0.6 mL of 50% ACN, 0.1% TFA, after which they were dried down in a speed vacuum centrifuge for further use.
Nano-scale reverse phase chromatography and tandem mass spectrometry (nanoLC-MS/MS)
The nanoLC-MS/MS analysis was carried out using UltiMate3000 RSLCnano (Dionex) coupled to an Orbitrap Fusion (Thermo-Fisher Scientific) mass spectrometer equipped with a nanospray Flex Ion Source. Each sample was reconstituted in 22 µL of 0.5% FA and 10 μL was loaded onto a Acclaim PepMap 100 C18 trap column (5 µm, 100 µm × 20 mm, 100 Å, Thermo Fisher Scientific) with nanoViper Fittings at 20 μL/min of 0.5% FA for on-line desalting. After 2 minutes, the valve switched to allow peptides to be separated on a Acclaim PepMap C18 nano column (3 µm, 75µm x 25cm, Thermo Fisher Scientific). Mobile phase A consisted of 2% ACN, 0.1% FA in water, Mobile phase B was 95% ACN, 0.1% FA in water and the 120 min gradient was as follows: 5% to 23% to 35% B at 300 nL/min (3 to 83 to 123 minutes, respectively), followed by a 9-min ramping to 90% B, a 9-min hold at 90% B and quick switch to 7% B in 1 minute. The column was re-equilibrated with 5% B for 20 min prior to the next run. A 10 fmol injection of standard BSA digest mixture with a short 30 minutes gradient was run between every sample for quality control purposes.
The Orbitrap Fusion was operating in positive ion mode with nano spray voltage set at 1.7 kV and source temperature at 275 °C. External calibration for FT, IT and quadrupole mass analyzers was performed prior to the analysis. The Orbitrap full MS survey scan (m/z 400–1800) was followed by Top 3 second data-dependent Higher Collision Dissociation product dependent ETD (HCD-pd-ETD) MS/MS scans for precursor peptides with 2–8 charges above a threshold ion count of 50,000 with normalized collision energy of 32%. MS survey scans were acquired at a resolving power of 120,000 (FWHM at m/z 200), with Automatic Gin Control (AGC) = 2e5 and maximum injection time (Max IT) = 50 ms, and HCD MS/MS scans at resolution 30,000 with AGC=5e4, Max IT = 60 ms and with Q isolation window (m/z) at 3 for the mass range m/z 105–2000. Dynamic exclusion parameters were set at 1 within 60s exclusion duration with ±10 ppm exclusion mass width. Product ion trigger list consisted of peaks at 204.0867 Da (HexNAc oxonium ion), 138.0545 Da (HexNAc fragment), 366.1396 Da (HexHexNAc oxonium ions) and 274.0927 Da (dehydrated N-Acetylneuraminic acid). If one of the HCD product ions in the list was detected, two charge dependent ETD MS/MS scans with HCD supplemental activation (SA for EThcD scan) on the same precursor ion were triggered and collected in a linear ion trap. For doubly charged precursors, the ETD reaction time as set 150 ms and the SA energy was set at 25%, while the same parameters at 125 ms and 20% respectively were used for higher charged precursors. For both ion triggered scans, fluoranthene ETD reagent target was set at 2e5, AGC target at 1e4, Max IT at 105 ms and isolation window at 3. All data were acquired under Xcalibur 3.0 operation software and Orbitrap Fusion Tune Application v. 2.1 (Thermo-Fisher Scientific).
Data processing, protein identification and analysis
All MS and MS/MS raw spectra from each sample were searched using Byonics v. 2.8.2 (Protein Metrics) using Homo sapience protein database containing 133,840 sequences and downloaded from Uniprot TrEMLB on January 4, 2016. The peptide search parameters were as follow: two missed cleavage for full trypsin digestion with fixed carbamidomethyl modification of cysteine, variable modifications of methionine oxidation and deamidation on asparagine/glutamine residues. The peptide mass tolerance was 10 ppm and fragment mass tolerance values for HCD and EThcD spectra were 0.05 Da and 0.6 Da, respectively. Both, the maximum number of common and rare modifications were set at two. The glycan search was performed against a list of 309 mammalian N-linked glycans. Identified peptides were filtered for maximum 2% FDR or 50 hits to the reverse database.
Statistical analyses
All statistical analyses were performed using GraphPad Prism 6 software. Significance for pair-wise correlation analysis was calculated using the Spearman’s correlation coefficient (r). Comparisons between two groups were assessed using unpaired or paired (for matched comparisons) two-tailed Student’s t-test, or non-parametric Mann-Whitney test. Multiple comparisons were assessed by one-way ANOVA including Tukey’s or Bonferroni’s multiple comparisons tests. Survival rates were compared using the log-rank test. Data are presented as mean ± SEM. P-values of <0.05 were considered to be statistically significant.
DATA AVAILABILITY
Source data for the main figures and extended data figures are provided. The NCBI GEO (Gene Expression Omnibus) accession number for RNA seq data reported in this paper is GSE118430. The datasets generated during the current study are available from the corresponding author upon reasonable request.
Extended Data
Extended Data Figure 1. Reduced glucose uptake and defective N-linked protein glycosylation promotes IRE1α-XBP1 activation in ascites-exposed human CD4+ T cells.

a, Human CD4+ T cells were activated via CD3/CD28 stimulation for 16 h in the absence or presence of OvCa ascites supernatants at the indicated concentrations. XBP1 expression was determined by qRT-PCR (10%, n = 58; 50%, n = 25; 100%, n = 30). Data were normalized to endogenous expression of ACTB in each sample. Results are presented as percent increase in expression compared with untreated controls. b, Histograms for FACS-based XBP1s staining in CD4+ T cells treated as indicated. Tm, tunicamycin; 4μ8C, inhibitor of the IRE1α RNase domain. Data were validated by three independent experiments. c-d, CD4+ T cells were treated with Vitamin E (VitE, 50μM) or vehicle (Ethanol 0.1%) for 1h and then stimulated with anti-CD3/CD28 beads for 16 h in the presence of ascites. Intracellular ROS staining by DCFDA (c) and XBP1 expression (d) (n = 10). Data are expressed as percent response change compared with untreated controls. e, Glucose concentration in regular culture media (cRPMI) and in seven independent OvCa ascites samples. Each dot represents the mean of two measurements. f, XBP1 expression in the samples described in panel a are displayed based on the final glucose concentration in the culture after addition of ascites. Three independent ascites samples were used: A10 (triangles), A15 (circles), A17 (squares) at three different concentrations (10, 50, and 100%). g, GLUT1 surface expression on the indicated cell types present in OvCa ascites from 6 independent patients was determined by GLUT1.RBD staining (n = 6). Quantitative analysis (left) and representative histograms (right). h, Glucose uptake and XBP1s protein expression in activated CD4+ T cells exposed to three different ascites samples at 10 and 100% for 16 h (n = 14). Results are presented as relative to untreated controls. i, CD4+ T cells were activated with anti-CD3/CD28 beads in the presence or absence of ascites for 16 h. Cells were lysed and the enriched glycoprotein fractions were analyzed for N-linked glycosylation events by LC-MS/MS. Total ion chromatograms for N-glycosylation at amino acid 315 in DPP2 are shown. Numbers in blue indicate abundance of each glycan via quantification of the corresponding peak area. Data are representative of two independent experiments with similar results. j, CD4+ T cells were treated with 10mM GlcNAc (N-Acetylglucosamine) for 1 h and stimulated via CD3/CD28 for 16 h in the presence of 10% ascites. Quantitative analyses for XBP1s protein by FACS (left, n = 6) and XBP1 gene expression by qRT-PCR (right, n = 15) are presented as percent response change compared with untreated controls. k. Relative basal and maximal OCR for CD4+ T cells exposed to 10% ascites analyzed in Fig. 2h (n = 16 total from five independent experiments). Data are expressed as percent response change compared with untreated controls. l-m, CD4+ T cells were activated via CD3/CD28 stimulation for 16 h in the absence or presence of Tm (tunicamycin) at the indicated concentrations (n = 3). l, XBP1 expression was determined via qRT-PCR. m, OCR profile of Tm-treated CD4+ T cells are shown as relative to the untreated control. n-o, Relative quantification of basal (left) and maximal (right) OCR (n), and ECAR measurements (o) in all independent samples analyzed in Fig. 2j (n = 9 total from three independent experiments). p-q, Relative quantification of basal (left) and maximal (right) OCR (p), and ECAR measurements (q) for the specimens described in panel Fig. 2k. (n = 5 total from two independent experiments). Data are presented as relative expression compared with matching controls that were not exposed to ascites. Data are shown as mean ± s.e.m (a, c-d, f-g, k-m). n values represent biologically independent samples (a, c-h, j-q). One-way ANOVA with Bonferroni’s multiple comparisons test (a, l); Two-tailed Student’s t-test (c, k); One-way ANOVA with Tukey’s multiple comparisons test (d, g); Two-tailed paired Student’s t-test (j, n-q); Nonparametric Spearman’s rank correlation test Spearman coefficient (r) with p-value (two-tailed); 95% Confidence Interval (CI) −0.8811 to −0.1626 (h). *P < 0.05, **P < 0.01, ***P < 0.001, ****P < 0.0001. NS, not significant; MFI, Mean fluorescence intensity; gMFI, Geometric mean fluorescence intensity.
Extended Data Figure 2. Characterization of mice devoid of XBP1 in T cells.

a, Deletion efficiency was analyzed by qRT-PCR using a primer set that specifically detects the exon 2 region of Xbp1. Data were normalized to endogenous expression of Actb and presented as relative expression compared with WT (n = 8). b, Absolute cell numbers in the thymus, spleen and lymph nodes. c, FACS-based phenotyping of double negative (CD4-CD8-), double positive (CD4+CD8+), or single positive (CD4+ or CD8+) thymocytes. d-g, Frequency of TCRβ+ cells (d, f) and CD4+ or CD8+ cells (gated on TCRβ+ cells) (e, g) in lymph nodes or spleen. h-i, Expression of CD44 and CD62L on both CD4+ (h) and CD8+ (i) TCRβ+ subsets in the spleen. j, Frequency of splenic TCRβ+ CD4+ FoxP3+ T cells. k-l, Frequency of non-T cell populations among total live cells in spleen (k) and lymph nodes (l). b-g, n = 5; h-j, n = 3; k-l, Xbp1f/f (n = 4), Xbp1f/f Cd4cre (n = 5). m, Reconstitution efficiency of CD4+ and CD8+ T cells in bone marrow and spleen from mixed bone marrow chimeras (n = 3 per chimera type). Chimeras were generated with a mixture of wild-type bone marrow (CD45.1+) plus either Xbp1f/f or Xbp1f/f Vav1cre bone marrow (CD45.2+). n, Flow cytometry assessing cell proliferation of CD4+ T cells stained with the division-tracking dye (Cell Trace Violet). Cells were left unstimulated or stimulated for 72 and 96 h with plate-bound anti-CD3 (5μg/ml) and soluble anti-CD28 (1μg/ml). Histograms (left) and proliferation index (right) are shown (n = 4). o, Cell cycle analysis of CD4+ T cells activated for 72 h by staining with propidium iodide. Representative plots from two experiments. p, Transmission electron microscopy of in vitro activated WT versus XBP1-deficient CD4+ T cells. Naïve CD4+ T cells isolated from three biologically independent mice were activated with plate-bound anti-CD3 and soluble anti-CD28 antibodies for 48 h. White arrowheads indicate the endoplasmic reticulum (ER); M, Mitochondria; 12000× (left); 50000× (right). Average mitochondrial area of independent cells was estimated using image J software. Xbp1f/f (n = 19); Xbp1f/f Cd4cre (n = 29). q, Histogram (left) and quantification (right) for mitochondrial staining (Mitotracker) in in vitro activated CD4+ T cells (n = 2 from two independent experiments). r, Activated WT versus XBP1-deficient CD4+ T cells were incubated in glucose-containing, -depleted or 2-deoxyglucose (2-DG, 10mM)-treated media for 6 h and PGC1α expression was analyzed by immunoblot. β-ACTIN was used as loading control. Representative plots from two independent experiments. Data are shown as mean ± s.e.m. (a-n, p). n values represent biologically independent samples (a-n, p-q). Two-tailed Student’s t-tests (b-l, n, p); *P < 0.05; NS, not significant.
Extended Data Figure 3. XBP1 inhibits glutamine influx in response to glucose deprivation.

a-b, Naïve splenic CD4+ T cells isolated from WT mice were activated via CD3/CD28 stimulation for 48 h and then incubated for 6 h in the indicated media. a, Expression of ER stress-related gene markers (n = 4 from two independent experiments). Data are shown as percent response change compared with control in the presence of glucose- and glutamine-containing media. b, Maximal OCR was measured in CD4+ T cells in the presence or absence of glucose, and treated with corresponding media (untreated, n = 5) or inhibitors blocking pyruvate (UK5099, n = 5), glutamine (BPTES, n = 4) or fatty acid (Etomoxir, n = 4) oxidation. Data are presented as percent response change compared with untreated control in the presence of glucose. c-i, Naïve splenic CD4+ T cells isolated from WT (solid bars) or XBP1-deficient (hatched bars) mice were activated via CD3/CD28 stimulation for 48 h, followed by culture in the presence or absence of glucose for 4.5 h, and then pulsed with [U-13C]-glutamine for an additional 1.5 h in the same culture condition. Relative abundance of 13C-labeled metabolites and TCA intermediates including glutamine (c), glutamate (d), α-ketoglutarate (e), succinate (f), malate (g), citrate (h) and aspartate (i) was determined by LC-MS/MS. Data were normalized to cell number in all cases and are representative of two independent experiments with n = 2 biologically distinct samples per group. Data are shown as mean ± s.e.m. n values represent biologically independent samples (a, b). One-way ANOVA with Bonferroni’s multiple comparisons test (a); One-way ANOVA with Tukey’s multiple comparisons test (b); *P < 0.05, **P < 0.01, ***P < 0.001, ****P < 0.0001.
Extended Data Figure 4. XBP1 controls the abundance of glutamine transporters in glucose-deprived T cells.
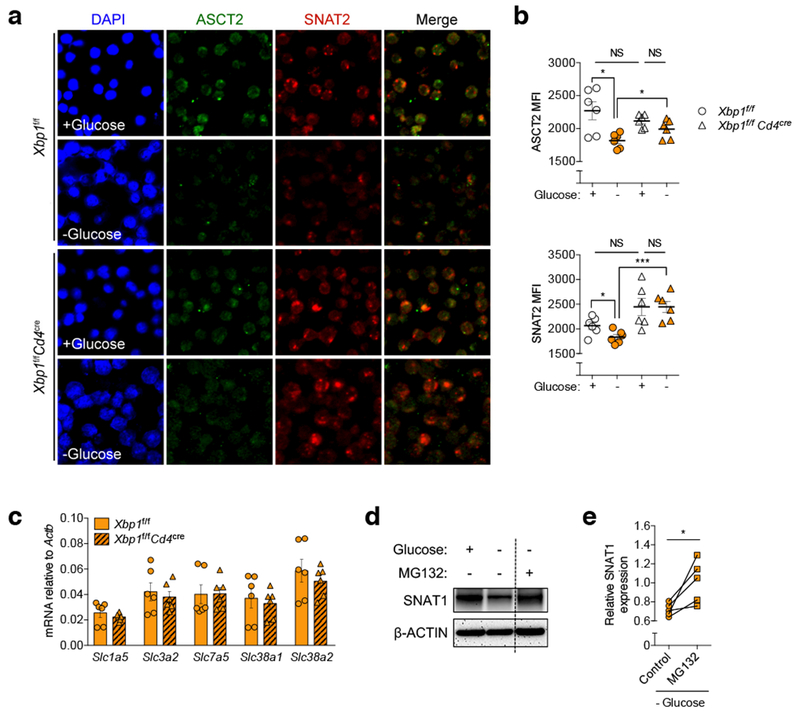
a-b, Pre-activated WT or XBP1-deficient CD4+ T cells were incubated in the indicated media for 6 h and then stained on poly-l-lysine coated discs using antibodies specific for ASCT2 (green) or SNAT2 (red). Nuclei are depicted in blue (DAPI staining). a, Representative confocal images of the indicated T cells from three experiments. b, The mean fluorescence intensity (MFI) of each glutamine transporter on ~50 individual cells from three independent slides (n = 150) was computationally quantified using the Image J software by two independent investigators in a blinded manner. Individual dots depict the average MFI of each independent analysis (n = 6). c, Naïve splenic CD4+ T cells isolated from WT or XBP1-deficient mice were activated via CD3/CD28 stimulation for 48 h and then incubated in media lacking glucose for 6 h. mRNA expression of genes encoding glutamine transporters was determined by qRT-PCR (n = 6 from three experiments). Data were normalized to endogenous expression of Actb in each case. d-e, Pre-activated mouse CD4+ T cells were incubated in the indicated media for 6 h in the presence or absence of proteasome inhibitor MG132 (10 μM). d, Protein levels of the glutamine transporter SNAT1 were determined by immunoblot analysis where β-ACTIN was used as loading control. Representative image from five independent experiments. e, Densitometric quantification of SNAT1 (n = 5). Results are presented as relative expression compared with untreated control T cells incubated in glucose-containing media. Data are shown as mean ± s.e.m (b, c). n values represent biologically independent samples (c, e). Two-tailed Student’s t-tests (b); Two-tailed paired Student’s t-tests (e); *P < 0.05, ***P < 0.001; NS, not significant.
Extended Data Figure 5. Restoring glutamine influx enhances mitochondrial function in ascites-exposed CD4+ T cells.

a-b, Immunoblot (a) and densitometric quantification (b) for ASCT2 and SNAT1 protein levels in human CD4+ T cells exposed to OvCa ascites at the indicated concentrations for 16 h. β-ACTIN was used as loading control. Data are shown as the relative expression compared with untreated (0%) controls. n = 4 for 10% ascites; n = 4 for 50% ascites; n = 2 for 100% ascites. Data were generated from two independent experiments. c-d, Human CD4+ T cells were activated via CD3/CD28 stimulation for 16 h in the absence or presence of 25% OvCa ascites supernatants, and DMKG (5 mM) was added to the cell culture during the last 4 h of incubation. OCR profile (c) and quantification of maximal OCR (d). Data are presented as relative expression compared with untreated controls incubated in the absence of ascites (n = 17 total from two independent experiments). e-f, Human CD4+ T cells activated via CD3/CD28 stimulation and IL-2 (50 U/ml) for 36 h were transduced with GFP-expressing retroviruses harboring no insert (control) or the gene encoding human SNAT1. GFP+ cells were sorted 3 days post-transduction and expanded for an additional 48 h in the presence of CD3/CD28 stimulation and IL-2 (50 U/ml). After 20 h of resting, cells were restimulated with CD3/CD28 antibodies in the absence or presence of OvCa ascites supernatants for 16 h. e, Sorting plots showing GFP expression by CD4+ T cells that were left untreated or transduced with either control or SNAT1-expressing viruses. Representative plots from two experiments. f, Relative SLC38A1 expression levels in sorted cells after transduction (n = 6 total from two independent experiments). n values represent biologically independent samples (b, d, f). Data are shown as mean ± s.e.m (b, c, f). One-way ANOVA with Bonferroni’s multiple comparisons test (b); Two-tailed paired Student’s t-test (d); Two-tailed Student’s t-test (f). *P < 0.05, **P < 0.01, ***P < 0.001, ****P < 0.0001.
Extended Data Figure 6. IRE1α-XBP1 activation and ER stress responses in OvCa-associated T cells isolated from mouse models of disease.

a-b, Expression of ER stress marker genes Xbp1, Xbp1s, Hspa5, and Ddit3 was determined by qRT-PCR. Circles, CD4+ T cells; squares, CD8+ T cells. a, CD45+ TCRβ+ CD4+ and CD8+ cells were sorted from tumors (n = 8), spleens (n = 4) and lymph nodes (n = 4) of mice bearing advanced p53/K-ras-driven ovarian tumors. b, CD45+ TCRβ+ CD4+ and CD8+ cells were isolated from malignant ascites (n = 6), spleens (n = 8) and lymph nodes (n = 8) of mice bearing aggressive ID8-Def29/Vegf-A OvCa, and from spleens (n = 6) of naïve mice as control. c-d, Expression of canonical regulated IRE1α-dependent decay (RIDD) target genes Bloc1s1 and Gm2a in CD4+ and CD8+ T cells isolated from different tissues of OvCa-bearing mice was analyzed by qRT-PCR. c, T cells were sorted from tumors (CD4+ T cells, n = 5; CD8+ T cells, n = 4), spleens (n = 2) and lymph nodes (n = 2) of mice bearing advanced p53/K-ras-driven ovarian tumors. d, T cells were isolated from malignant ascites (CD4+ T cells, n = 8; CD8+ T cells, n = 6), spleens (n = 13) and lymph nodes (n = 8) of mice bearing aggressive ID8-Def29/Vegf-A OvCa. Data were normalized to Actb. Data are shown as mean ± s.e.m (a-d). n values represent biologically independent samples (a-d). One-way ANOVA with Tukey’s multiple comparisons test (a, b); *P < 0.05, **P < 0.01, ***P < 0.001, ****P < 0.0001
Extended Data Figure 7. IRE1α-XBP1 signaling alters OvCa-associated T cell function and promotes malignant progression.

a, Transcriptional profiling of splenic CD44hi CD62Llo CD4+ T cells sorted from naïve WT versus XBP1-deficient mice. Expression of the differentially regulated genes identified in Fig. 4a is shown (n = 3 per group). b-c and e-f, Analysis of WT versus XBP1-deficient CD4+ T cells isolated from mice bearing metastatic OvCa (n = 4 per group). b, Expression of previously reported RIDD target genes. c, Relative gene expression of master transcription factors controlling helper T cell differentiation. d, Intracellular staining for FoxP3 (left) and proportion of FoxP3+ CD4+ T cells from WT (n = 5) and XBP1-deficient (n = 6) mice bearing metastatic OvCa for 21 days. e, Predicted upstream regulators associated with the transcriptional changes observed. f, Enriched cellular functions in XBP1-deficient CD4+ T cells at tumor sites. Z-scores greater than 2 indicate functions predicted to be significantly increased in XBP1-deficient CD4+ T cells. g, Intracellular staining for IFN-γ in CD45+CD3+CD8+ T cells from WT and conditional XBP1-deficient mice bearing metastatic OvCa for 20–23 days. Representative plots from three independent experiments. h-i, Intracellular staining for IFN-γ in CD45+CD3+CD4+ T cells (h) and for perforin in CD45+CD3+CD8+ T cells (i) from WT and conditional XBP1-deficient mice bearing metastatic OvCa for 29 days (late stage). Representative plots from two independent experiments. j, In vivo glucose uptake by CD44hi CD4+ TILs in Xbp1f/f (n = 6) or Xbp1f/f Cd4cre (n = 7) female mice bearing metastatic OvCa. k, Representative TMRE staining for OvCa-associated CD45+TCRβ+CD44+CD4+ T cells from tumor-bearing Xbp1f/f (n = 3) or Xbp1f/f Cd4cre (n = 4) mice. l, Peritoneal wash samples were collected from mice at 24 days after tumor challenge and the proportion of OvCa-associated CD4+ T cells expressing PD-1, CTLA4, and TIM3 in WT (n = 9) or XBP1-deficient (n = 8) mice was determined. m, Female mice (n = 4 per group) were implanted with ID8-Def29/Vegf-A OvCa cells in the flank and tumor growth was monitored over time (left). Tumors were resected at day 34 and final size was confirmed ex vivo (right). n, Ascites accumulation (left) in Ern1f/f (n = 5) or Ern1f/f Cd4cre (n = 6) mice bearing ID8-Def29/Vegf-A OvCa and overall survival (right, n = 6 per group). Ern1 is the gene encoding IRE1α. Data are shown as mean ± s.e.m. (c-d, j-l). Boxes represent median ± interquartile range and whiskers indicate minimum and maximum (m, n). n values represent biologically independent mice (a-d, j-n). Two-tailed Student’s t-tests (d, j-l, m-n); Log-rank test for survival (m-n). *P < 0.05, NS, not significant; gMFI, Geometric mean fluorescence intensity.
Extended Data Figure 8. IRE1α-XBP1 regulates IFN-γ production in ascites-exposed human CD4+ T cells.

a, IFNG expression in CD4+ T cells receiving CD3/CD28 activation for 16 h under increasing concentrations of OvCa ascites supernatants. 10% (n = 12); 50% (n = 3); 100% (n = 3). b, CD4+ T cells were activated for 12 h, incubated for additional 36 h in the presence of 25% ascites, and IFN-γ in culture supernatants was determined by ELISA. Data were normalized to final viable cell counts in each case. n = 11 independent responder CD4+ T cells in all cases with the exception of A14 (n = 9), A15 (n = 10) and A17 (n = 3). c-h, Pre-activated CD4+ T cells were treated with 4μ8C for 2 h, and 25% ascites was subsequently added to the culture for additional 12 h. c, IFN-γ in culture supernatants was quantified by ELISA (n = 14). Data are presented as relative expression compared with matching controls that were not exposed to ascites. d, FACS histogram (left) and quantitative analysis (right) for intracellular IFN-γ in CD4+ T cells (n = 16). e, Maximal OCR presented as percent response change compared with untreated controls (n = 7). f, The frequency of viable cells among total cells was determined by staining with dead cell exclusion dye (n = 12). The frequency of T-bet+ (g) and RORγt+ (h) populations among CD4+ T cells was determined by intracellular staining and presented as relative expression compared with ascites-untreated controls (n = 12). i, IFNG expression by SNAT1-overexpressing human CD4+ T cells exposed to 10% OvCa ascites (n = 6 from two independent experiments) or incubated in glucose-free media (n = 3 from two independent experiments). Data were normalized to endogenous expression of GAPDH in each sample. Data are presented as relative expression compared with control virus-transduced T cells that were not exposed to ascites or glucose deprived. Data are shown as mean ± s.e.m. (a-c, f-i). n values represent biologically independent samples (a-i). One-way ANOVA with Bonferroni’s multiple comparisons test (a, b); One-way ANOVA with Tukey’s multiple comparisons test (c, f, g, h); Two-tailed paired Student’s t-tests (d, e); Two-tailed Student’s t-tests (i); *P < 0.05, **P < 0.01, ***P < 0.001, ****P < 0.0001; gMFI, Geometric mean fluorescence intensity.
Extended Data Figure 9. Proposed model.

Under normal (glucose-rich) conditions (a), T cells can effectively glycosylate proteins in the ER while fueling mitochondrial respiration through glycolysis. These processes endow T cells with competent effector function and anti-cancer capacity. In the tumor microenvironment (b), glucose availability could be limited and T cells may also express low levels of glucose transporters such as GLUT1. Glucose restriction not only dampens glycolysis, but also impairs optimal N-linked protein glycosylation in T cells, leading to ER stress and IRE1α-XBP1 activation. XBP1 controls the abundance of glutamine transporters in ER-stressed T cells and consequently limits the influx of glutamine necessary to sustain mitochondrial respiration under glucose deprivation. Therefore, T cells become dysfunctional and incapable of controlling malignant progression. Disabling IRE1α-XBP1 signaling may be useful to enhance T cell mitochondrial function and anti-cancer capacity in a harsh tumor microenvironment.
Extended Data Table 1. Defective N-linked protein glycosylation in ascites-exposed CD4+ T cells.
CD4+ T cells were activated with anti-CD3/CD28 beads in the presence or absence of ascites for 16 h. Cells were lysed and the enriched glycoprotein fractions were analyzed for N-linked glycosylation events by LC-MS/MS. Representative glycoproteins recovered from both control and ascites-exposed CD4+ T cells. The table shows each site for N-linked glycosylation on the identified protein, the glycan type on that site, and the number of glycosylation events identified in each glycoform. The percent decrease in glycosylation upon ascites exposure was calculated using the following equation. [% decrease in glycosylation] = 100 − ([number of total glycosylation events]Ascites/[number of total glycosylation events]Control) × 100. *, altered event.
| Protein name | N-linked Gtycosylation | Number of glycosylation events | %decrease in glycosylation | ||
|---|---|---|---|---|---|
| Site | Glucan | Control | Ascites | ||
| CD48 | 207 | HexNAc(2)Hex(5) | 1 | 1 | 25 |
| HexNAc(2)Hex(6) | 2 | 1 | |||
| HexNAc(3)Hex(6)NeuAe(1) | 1 | 1 | |||
| DPP2 (Dipeptidyl peptidase 2) | 315 | HexNAc(2)Hex(2) | 1 | 0 | 18.2 |
| HexNAc(2)Hex(3) | 2 | 2 (*) | |||
| HexNAc(2)Hex(4) | 1 | 2 | |||
| HexNAc(2)Hex(5) | 1 | 2 (*) | |||
| HexNAc(2)Hex(6) | 1 | 0 | |||
| 428 | HexNAc(2)Hex(5) | 3 | 1 | ||
| HexNAc(2)Hex(6) | 2 | 2(*) | |||
| HexB (β-hexosaminidase B) | 84 | HexNAc(2)Hex(5) | 2 | 0 | 75 |
| HexNAc(2)Hex(6) | 2 | 1 | |||
| MPO (Myeloperoxidase) | 323 | HexNAc(2)Hex(3) | 4 | 0 | 79.5 |
| HexNAc(2)Hex(4) | 5 | 0 | |||
| HexNAc(2)Hex(5) | 2 | 0 | |||
| HexNAc(2)Hex(6) | 4 | 0 | |||
| HexNAc(2)Hex(7) | 2 | 0 | |||
| HexNAc(2)Hex(2)Fuc(1) | 3 | 0 | |||
| HexNAc(4)Hex(3)NeuGc(1) | 1 | 0 | |||
| 355 | HexNAc(2)Hex(4) | 2 | 0 | ||
| HexNAc(2)Hex(5) | 4 | 3 (*) | |||
| HexNAc(2)Hex(6) | 7 | 3 | |||
| HexNAc(2)Hex(7) | 3 | 2 | |||
| 391 | HexNAc(2)Hex(3) | 1 | 0 | ||
| HexNAc(2)Hex(4) | 3 | 0 | |||
| HexNAc(2)Hex(5) | 2 | 0 | |||
| HexNAc(2)Hex(6) | 1 | 1 | |||
Supplementary Material
ACKNOWLEDGMENTS:
Our research was supported by the Ann Schreiber Mentored Investigator Award of the Ovarian Cancer Research Fund Alliance (J.R.C-R.), the Ovarian Cancer Academy-Early-Career Investigator Award W81XWH-16–1-0438 of the Department of Defense (J.R.C-R.), the Stand Up to Cancer Innovative Research Grant SU2C-AACR-IRG-03–16 (J.R.C-R.), the Jacquie Liggett Fellowship Award of Hearing the Ovarian Cancer Whisper (J.R.C-R.), Weill Cornell Medicine Funds (J.R.C-R. and L.H.G.), and NIH grant R01CA112663 (L.H.G.). We thank J. McCormick for expert assistance with cell sorting; L. Cohen-Gould and J. Jimenez for electron microscopy analysis; G. Zhang, Z. Cheng, and T. Su for metabolic tracing experiments; all members of the Weill Cornell Epigenomics Facility for assistance with RNA sequencing, T. Walther for help collecting patient samples; J. M. Pérez-Sáez and J. Trillo-Tinoco for assistance with some experimental analyses and helpful suggestions; and L. Cantley and M. Goncalves for sharing valuable instruments and resources. We also thank all members of the Cubillos-Ruiz, Morales and Glimcher laboratories for helpful suggestions and critical reading of this manuscript.
Footnotes
COMPETING INTERESTS: J.R.C.-R. and L.H.G. are co-founders of and scientific advisors for Quentis Therapeutics, Inc. S.E.B. is co-founder and employee of Quentis Therapeutics, Inc. L.H.G. also serves on the board of directors of and holds equity in GlaxonSmithKline Pharmaceuticals.
REFERENCES
- 1.Chang CH et al. Metabolic Competition in the Tumor Microenvironment Is a Driver of Cancer Progression. Cell 162, 1229–1241, doi:10.1016/j.cell.2015.08.016 (2015). [DOI] [PMC free article] [PubMed] [Google Scholar]
- 2.Ho PC et al. Phosphoenolpyruvate Is a Metabolic Checkpoint of Anti-tumor T Cell Responses. Cell 162, 1217–1228, doi:10.1016/j.cell.2015.08.012 (2015). [DOI] [PMC free article] [PubMed] [Google Scholar]
- 3.Scharping NE et al. The Tumor Microenvironment Represses T Cell Mitochondrial Biogenesis to Drive Intratumoral T Cell Metabolic Insufficiency and Dysfunction. Immunity 45, 374–388, doi:10.1016/j.immuni.2016.07.009 (2016). [DOI] [PMC free article] [PubMed] [Google Scholar]
- 4.Anderson KG, Stromnes IM & Greenberg PD Obstacles Posed by the Tumor Microenvironment to T cell Activity: A Case for Synergistic Therapies. Cancer Cell 31, 311–325, doi:10.1016/j.ccell.2017.02.008 (2017). [DOI] [PMC free article] [PubMed] [Google Scholar]
- 5.Chae CS, Teran-Cabanillas E & Cubillos-Ruiz JR Dendritic cell rehab: new strategies to unleash therapeutic immunity in ovarian cancer. Cancer immunology, immunotherapy : CII, doi:10.1007/s00262-017-1958-2 (2017). [DOI] [PMC free article] [PubMed] [Google Scholar]
- 6.Matulonis UA et al. Ovarian cancer. Nature reviews. Disease primers 2, 16061, doi:10.1038/nrdp.2016.61 (2016). [DOI] [PMC free article] [PubMed] [Google Scholar]
- 7.Hamanishi J et al. Safety and Antitumor Activity of Anti-PD-1 Antibody, Nivolumab, in Patients With Platinum-Resistant Ovarian Cancer. J Clin Oncol 33, 4015–4022, doi:10.1200/JCO.2015.62.3397 (2015). [DOI] [PubMed] [Google Scholar]
- 8.Kershaw MH et al. A phase I study on adoptive immunotherapy using gene-modified T cells for ovarian cancer. Clin Cancer Res 12, 6106–6115, doi:10.1158/1078-0432.CCR-06-1183 (2006). [DOI] [PMC free article] [PubMed] [Google Scholar]
- 9.Yoshida H, Matsui T, Yamamoto A, Okada T & Mori K XBP1 mRNA is induced by ATF6 and spliced by IRE1 in response to ER stress to produce a highly active transcription factor. Cell 107, 881–891, doi:S0092-8674(01)00611-0 [pii] (2001). [DOI] [PubMed] [Google Scholar]
- 10.Lee AH, Iwakoshi NN & Glimcher LH XBP-1 regulates a subset of endoplasmic reticulum resident chaperone genes in the unfolded protein response. Mol Cell Biol 23, 7448–7459 (2003). [DOI] [PMC free article] [PubMed] [Google Scholar]
- 11.Cubillos-Ruiz JR, Bettigole SE & Glimcher LH Tumorigenic and Immunosuppressive Effects of Endoplasmic Reticulum Stress in Cancer. Cell 168, 692–706, doi:10.1016/j.cell.2016.12.004 (2017). [DOI] [PMC free article] [PubMed] [Google Scholar]
- 12.Cubillos-Ruiz JR et al. ER Stress Sensor XBP1 Controls Anti-tumor Immunity by Disrupting Dendritic Cell Homeostasis. Cell 161, 1527–1538, doi:10.1016/j.cell.2015.05.025 (2015). [DOI] [PMC free article] [PubMed] [Google Scholar]
- 13.Yan D, Wang HW, Bowman RL & Joyce JA STAT3 and STAT6 Signaling Pathways Synergize to Promote Cathepsin Secretion from Macrophages via IRE1alpha Activation. Cell reports 16, 2914–2927, doi:10.1016/j.celrep.2016.08.035 (2016). [DOI] [PMC free article] [PubMed] [Google Scholar]
- 14.Condamine T et al. Lectin-type oxidized LDL receptor-1 distinguishes population of human polymorphonuclear myeloid-derived suppressor cells in cancer patients. Science immunology 1, doi:10.1126/sciimmunol.aaf8943 (2016). [DOI] [PMC free article] [PubMed] [Google Scholar]
- 15.Kipps E, Tan DS & Kaye SB Meeting the challenge of ascites in ovarian cancer: new avenues for therapy and research. Nat Rev Cancer 13, 273–282, doi:10.1038/nrc3432 (2013). [DOI] [PMC free article] [PubMed] [Google Scholar]
- 16.Bamias A et al. Significant differences of lymphocytes isolated from ascites of patients with ovarian cancer compared to blood and tumor lymphocytes. Association of CD3+CD56+ cells with platinum resistance. Gynecologic oncology 106, 75–81, doi:10.1016/j.ygyno.2007.02.029 (2007). [DOI] [PubMed] [Google Scholar]
- 17.Curiel TJ et al. Specific recruitment of regulatory T cells in ovarian carcinoma fosters immune privilege and predicts reduced survival. Nat Med 10, 942–949, doi:10.1038/nm1093 (2004). [DOI] [PubMed] [Google Scholar]
- 18.Lukesova S et al. Comparative study of various subpopulations of cytotoxic cells in blood and ascites from patients with ovarian carcinoma. Contemporary oncology 19, 290–299, doi:10.5114/wo.2015.54388 (2015). [DOI] [PMC free article] [PubMed] [Google Scholar]
- 19.Knutson KL et al. Regulatory T cells, inherited variation, and clinical outcome in epithelial ovarian cancer. Cancer immunology, immunotherapy: CII 64, 1495–1504, doi:10.1007/s00262-015-1753-x (2015). [DOI] [PMC free article] [PubMed] [Google Scholar]
- 20.Kim KS et al. Hypoxia enhances lysophosphatidic acid responsiveness in ovarian cancer cells and lysophosphatidic acid induces ovarian tumor metastasis in vivo. Cancer Res 66, 7983–7990, doi:10.1158/0008-5472.CAN-05-4381 (2006). [DOI] [PubMed] [Google Scholar]
- 21.Denzel MS & Antebi A Hexosamine pathway and (ER) protein quality control. Current opinion in cell biology 33, 14–18, doi:10.1016/j.ceb.2014.10.001 (2015). [DOI] [PubMed] [Google Scholar]
- 22.Yang C et al. Glutamine oxidation maintains the TCA cycle and cell survival during impaired mitochondrial pyruvate transport. Mol Cell 56, 414–424, doi:10.1016/j.molcel.2014.09.025 (2014). [DOI] [PMC free article] [PubMed] [Google Scholar]
- 23.Wellen KE et al. The hexosamine biosynthetic pathway couples growth factor-induced glutamine uptake to glucose metabolism. Genes Dev 24, 2784–2799, doi:10.1101/gad.1985910 (2010). [DOI] [PMC free article] [PubMed] [Google Scholar]
- 24.Wang H et al. Endoplasmic reticulum stress up-regulates Nedd4–2 to induce autophagy. FASEB J 30, 2549–2556, doi:10.1096/fj.201500119 (2016). [DOI] [PubMed] [Google Scholar]
- 25.Jeon YJ et al. Regulation of glutamine carrier proteins by RNF5 determines breast cancer response to ER stress-inducing chemotherapies. Cancer Cell 27, 354–369, doi:10.1016/j.ccell.2015.02.006 (2015). [DOI] [PMC free article] [PubMed] [Google Scholar]
- 26.Hatanaka T, Hatanaka Y & Setou M Regulation of amino acid transporter ATA2 by ubiquitin ligase Nedd4–2. J Biol Chem 281, 35922–35930, doi:10.1074/jbc.M606577200 (2006). [DOI] [PubMed] [Google Scholar]
- 27.Scarlett UK et al. Ovarian cancer progression is controlled by phenotypic changes in dendritic cells. J Exp Med 209, 495–506, doi:10.1084/jem.20111413 (2012). [DOI] [PMC free article] [PubMed] [Google Scholar]
- 28.Conejo-Garcia JR et al. Tumor-infiltrating dendritic cell precursors recruited by a beta-defensin contribute to vasculogenesis under the influence of Vegf-A. Nat Med 10, 950–958 (2004). [DOI] [PubMed] [Google Scholar]
- 29.So JS et al. Silencing of lipid metabolism genes through IRE1alpha-mediated mRNA decay lowers plasma lipids in mice. Cell Metab 16, 487–499, doi:10.1016/j.cmet.2012.09.004 (2012). [DOI] [PMC free article] [PubMed] [Google Scholar]
- 30.Roby KF et al. Development of a syngeneic mouse model for events related to ovarian cancer. Carcinogenesis 21, 585–591 (2000). [DOI] [PubMed] [Google Scholar]
REFERENCES (PART TWO)
- 31.Lee AH, Scapa EF, Cohen DE & Glimcher LH Regulation of hepatic lipogenesis by the transcription factor XBP1. Science 320, 1492–1496, doi:10.1126/science.1158042 (2008). [DOI] [PMC free article] [PubMed] [Google Scholar]
- 32.Iwawaki T, Akai R, Yamanaka S & Kohno K Function of IRE1 alpha in the placenta is essential for placental development and embryonic viability. Proc Natl Acad Sci U S A 106, 16657–16662, doi:10.1073/pnas.0903775106 (2009). [DOI] [PMC free article] [PubMed] [Google Scholar]
- 33.Lee AH, Iwakoshi NN, Anderson KC & Glimcher LH Proteasome inhibitors disrupt the unfolded protein response in myeloma cells. Proc Natl Acad Sci U S A 100, 9946–9951, doi:10.1073/pnas.1334037100 (2003). [DOI] [PMC free article] [PubMed] [Google Scholar]
- 34.Yuan M, Breitkopf SB, Yang X & Asara JM A positive/negative ion-switching, targeted mass spectrometry-based metabolomics platform for bodily fluids, cells, and fresh and fixed tissue. Nature protocols 7, 872–881, doi:10.1038/nprot.2012.024 (2012). [DOI] [PMC free article] [PubMed] [Google Scholar]
- 35.Langmead B, Trapnell C, Pop M & Salzberg SL Ultrafast and memory-efficient alignment of short DNA sequences to the human genome. Genome biology 10, R25, doi:10.1186/gb-2009-10-3-r25 (2009). [DOI] [PMC free article] [PubMed] [Google Scholar]
- 36.Kent WJ et al. The human genome browser at UCSC. Genome Res 12, 996–1006, doi:10.1101/gr.229102. Article published online before print in May 2002 (2002). [DOI] [PMC free article] [PubMed] [Google Scholar]
- 37.Li B & Dewey CN RSEM: accurate transcript quantification from RNA-Seq data with or without a reference genome. BMC bioinformatics 12, 323, doi:10.1186/1471-2105-12-323 (2011). [DOI] [PMC free article] [PubMed] [Google Scholar]
- 38.Robinson MD & Oshlack A A scaling normalization method for differential expression analysis of RNA-seq data. Genome biology 11, R25, doi:10.1186/gb-2010-11-3-r25 (2010). [DOI] [PMC free article] [PubMed] [Google Scholar]
- 39.Maglott D, Ostell J, Pruitt KD & Tatusova T Entrez Gene: gene-centered information at NCBI. Nucleic Acids Res 39, D52–57, doi:10.1093/nar/gkq1237 (2011). [DOI] [PMC free article] [PubMed] [Google Scholar]
Associated Data
This section collects any data citations, data availability statements, or supplementary materials included in this article.
Supplementary Materials
Data Availability Statement
Source data for the main figures and extended data figures are provided. The NCBI GEO (Gene Expression Omnibus) accession number for RNA seq data reported in this paper is GSE118430. The datasets generated during the current study are available from the corresponding author upon reasonable request.