ABSTRACT
p27 plays critical roles in cell proliferation, differentiation, and apoptosis, which have been well studied in mammals and Drosophila. However, the mechanisms underlying p27 regulation of the cell cycle have not been thoroughly researched. In this study, Genevestigator, Kaplan–Meier Plotter, and the Human Protein Atlas databases were used to analyze the expression of p27, cell division protein kinase 6 (CDK6), and cyclin D1 (CCND1), as well as its prognostic value in different tumor tissues and corresponding normal tissues. Quantitative PCR and immunohistochemistry were used to detect the expression of p27, CDK6, and CCND1 in the tissues of cancer patients. The effects of p27, CDK6, and CCND1 on the proliferation of lung cancer cells were examined by the MTT assay, and flow cytometry was used to investigate the mechanism by which p27 affected cell proliferation. Immunofluorescence, co-immunoprecipitation, and Western blotting were used to determine if p27 interacted with CDK and CCND1 to regulate the cell cycle. The results showed that p27, CDK6, and CCND1 played different roles in tumorigenesis and development, which are in accordance with CDK6 and CCND1 in affecting the cell cycle and cell proliferation. p27 regulated the cell cycle and inhibited cell proliferation by affecting formation of the cell cycle-dependent complex CDK6/CCND1, but did not directly affect the expression of CDK6 and CCND1. Moreover, CCND1 did not regulate the cell cycle alone, but rather, functioned together with CDK6. This study provides insights into the effects of p27 on tumor formation and development, and the underlying regulatory mechanisms.
KEYWORDS: Cancer, cell proliferation, cell cycle, p27, CDK6, CCND1
Introduction
If the cell cycle is not constrained by homeostatic mechanisms, abnormalities in tissues and organs, and even cancer lesions can occur [1]. Cell cycle regulation is very complex and involves a variety of mechanisms which keep the organism in a steady state [2]. Cyclin-dependent kinase inhibitors (CKIs) play important roles in regulating the cell cycle, and genes that encode CKIs are highly conserved among all eukaryotes. Progression through the cell cycle is regulated by the coordinated activities of cyclin/cyclin-dependent kinase (CDK) complexes [3]. One level of regulation of these complexes is provided by their binding to CKIs [4].
p27 is a CKI [5] and cell cycle regulator which is involved in both cell fate determination and tissue growth [6]. Because CKIs can inhibit cell proliferation, they play essential roles as tumor suppressor genes [7]. The expression of p27 is associated with the occurrence and development of most tumors. p27 encodes an inhibitor of CCNE/CDK2 complexes in Drosophila similar to vertebrate Cip/Kip inhibitors [8], which accumulate in the G1 phase and are gradually degraded in the S and G2 phases of the cell cycle (Figure 9(a)) [9,10]. In the nucleus, p27 acts as an inhibitor of cyclin/CDK2 complexes in the G0 and early G1 phases, and CCNE/CDK2 phosphorylates and binds to p27 before the S phase. Subsequently p27 is ubiquitylated by SCF and degraded in the cell [9] or translocated to the cytoplasm, and then phosphorylated at S10 by the KPC complex. Finally, it is degraded by the ubiquitin pathway [10].
Figure 9.
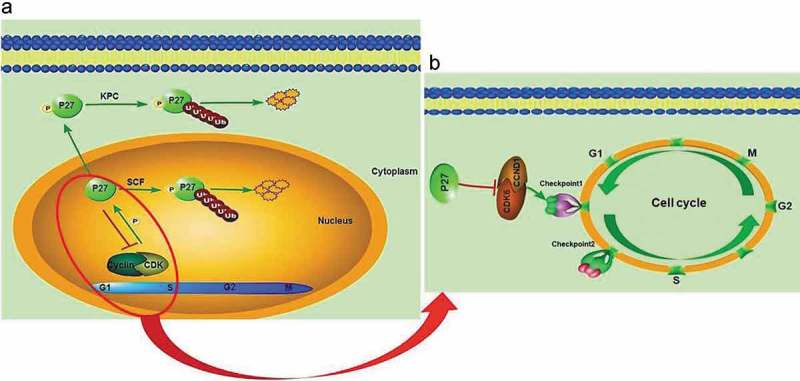
The roles of p27 in cell cycle regulation and tumor development. (a) The mechanism of p27 in cell cycle. P27 is ubiquitylated and degraded in late G1, S and G2 phases by SCFSkp2 in the nucleus. P27 phosphorylated at S10 is ubiquitylated by the KPC complex when exported to the cytoplasm. (b) Contributions of the study of cell cycle regulation by P27. The mechanism of p27 in cell cycle. P27 induces cell cycle arrest in the G1 phase by inhibiting the formation of cell cycle-dependent complexes CDK6/CCND1.
p27 affects formation of the cell cycle checkpoint complex (CCNE/CDK2); however, there has been less research on its effects on the CCND1/CDK6 cell cycle checkpoint complex. This study provides insights into the effects of p27 on the CCND1/CDK6 complex, cell proliferation, and tumor formation.
Results
Expression of p27, CDK6, and CCND1 in drosophila, mice, and humans
We extracted data on the transcript expression of p27, CDK6, and CCND1 from the Genevestigator database (https://genevestigator.com/gv/doc/tools.jsp) for Drosophila, mice, and humans (Figure 1). During the growth process of mice and Drosophila, the expression of p27, CDK6, and CCND1 generally remained the same, which proved that these three genes are closely associated with the growth and development of mice and Drosophila (Figure 1(a,b)). With analyzing expression in human tissue, high levels of p27, CDK6, and CCND1 were found in the lung, stomach, heart, and other tissues, indicating that they play more important roles in humans than mice and Drosophila (Figure 1(c)). Functional clustering analysis of these three genes showed that their main functions were regulation of the cell cycle (Figure 1(d)). Cell cycle regulation involves cyclin-dependent protein serine/threonine activity, CDK activity, and G/S transition of the mitotic cell cycle (Figure 1(d)). Based on the results mentioned above, we presumed that the close interaction among p27, CDK6, and CCND1 affect the growth and development of mice, Drosophila, and humans by regulating the cell cycle. Cancer is a disorder caused by dysfunction of the cell cycle, so our subsequent experiments focused on the impact of these three genes in cancer development.
Figure 1.
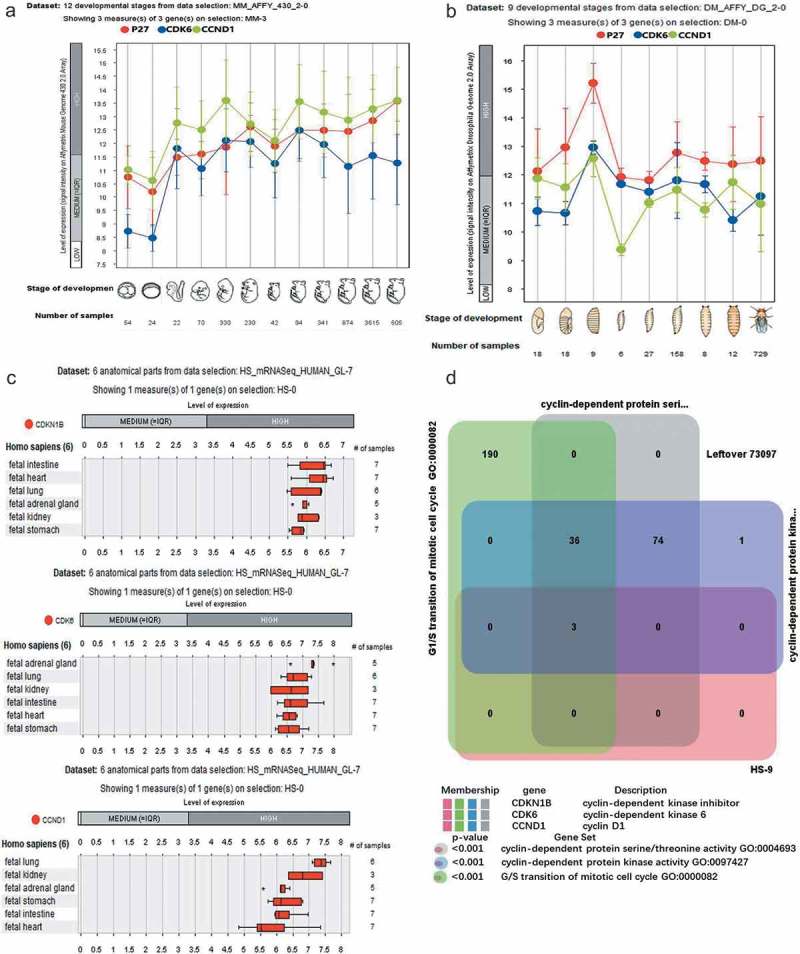
Expression of p27, CDK6, and CCND1 in Drosophila, mice, and humans. (a) Twelve developmental stages from data selections: MM-AFFY-430 −2–0 Showing three measures of P27, CDK6, and CCND1 in mice. The 12 stages were: prenatal_0–1, prenatal_2–4, prenatal_7–8.5, prenatal_9–11, prenatal_11.5–15, prenatal_16-18, postnatal_0, postnatal_1–3, postnatal_4–15, postnatal_16–63, adult_64-255, adult_256-9999. (b) Nine developmental stages from data selections: DM-AFFY-DG −2–0 Showing three measures of P27, CDK6 and CCND1 in Drosophila. The nine stages are: germ band elongation stage embryo, germ band retraction stage embryo, late stage embryo, first instar larval stage, second instar larval stage, third instar larval stage, prepupal development, pupal development, and adult development. (c) Detection of mRNA expression of p27, CDK6, CCND1 in six human organs. The organs included the stomach, lung, heart, kidney, adrenal gland, and intestine. (d) Analysis of p27, CDK6, CCND1 functions in humans. The functions of three genes involved in the regulation including cyclin-dependent protein serine/threonine activity, cyclin-dependent protein kinase activity, and G/S transition of mitotic cell cycle.
Functions of p27, CDK6, and CCND1 in tumors
In our mutational gene analysis of tumors (www.cbioportal.org/), we found that mutations in p27 were associated with changes in CDK6 and CCND1 in gastric, lung, and breast cancers (Figure 2(a)). The results were in accordance with those shown in Figure 1. P27, CDK6, and CCND1 were closely associated with regulation of the growth and development of mice, Drosophila, and humans as well as cancer development. The expression of these three genes in lung, gastric, and breast cancers was analyzed using data from Proteinatas (www.proteinatlas.org). The results showed that p27 was highly expressed in normal tissues and that CDK6 was more expressed in tumor tissues; the difference in CCND1 expression between normal and cancer tissues was not clear (Figure 2(b)). Next, we focused our analyzes on the effects of p27, CDK6, and CCND1 expression on the survival of cancer patients (lung, gastric, and breast cancers) (http://www.kmplot.com/). The results showed a correlation between p27 expression and overall survival (OS) (Figure 2(c)). When we restricted our analysis to tumor type, a positive influence on OS was observed with the expression of p27. At the same time, analyzes of CDK6 and CCND1 showed a correlation between their gene expression and OS rates (Figure 2(d,e)). Specifically, high CDK6 expression was correlated with decreased OS and a poor prognosis (Figure 2(d)). However, high CCND1 expression was correlated with increased OS and a favorable prognosis (Figure 2(e)). These results were in accordance with the difference in gene expression observed between cancer patients and healthy controls (Figure 2(b)).
Figure 2.
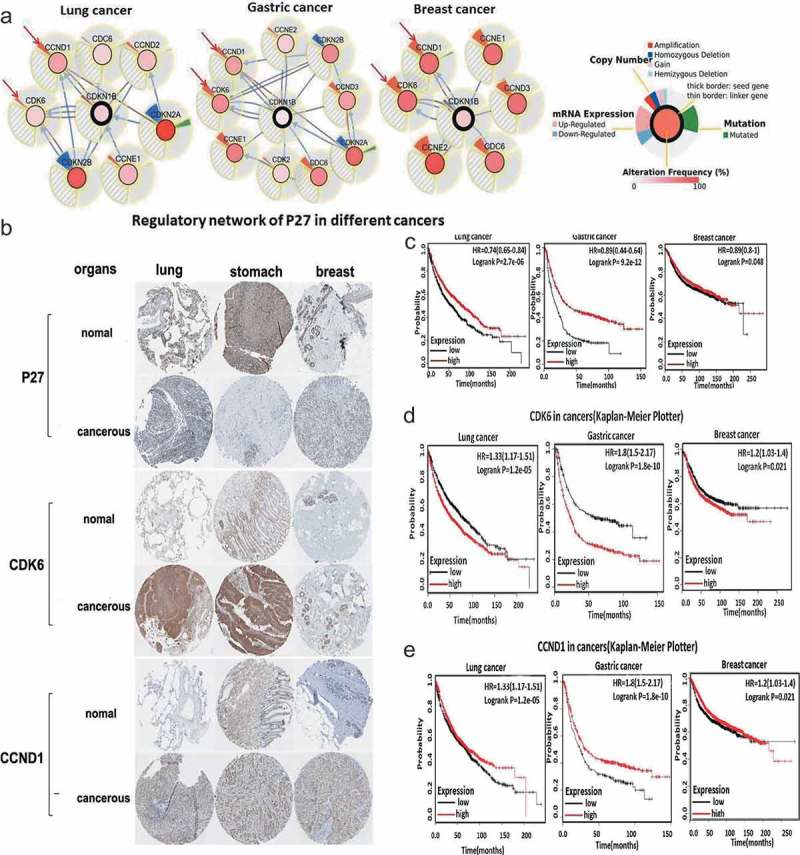
Functions of p27, CDK6, and CCND1 in tumors. (a) Analysis of Mutations in Other Genes in p27-mutated tumors (www.cbioportal.org/), the marked genes were significant changes in the range, the outer circle showed the result of genes copy number analysis, expression change analysis, mutation analysis. The inner ring belongs to P27 mutation frequency analysis. (b) Analysis of the expression of p27, CDK6, and CCND1 in tumors and corresponding normal tissues. Tumors including lung cancer, gastric cancer and breast cancer. The analysis data were derived from the immunohistochemical results of the database of Proteinatas (www.proteinatlas.org). (c) P27 in gastric, lung, and breast cancer (Kaplan–Meier Plotter). Kaplan–Meier plots showing OS in adenocarcinomas. In red: patients with expression above the median and in black, patients with expressions below the median. Kaplan–Meier plots revealed the correlation between gene expression and OS rate. (d) CDK6 in gastric, lung, and breast cancers (Kaplan–Meier Plotter). Kaplan–Meier plots showing OS in adenocarcinomas. In red: patients with expression above the median and in black, patients with expressions below the median. Kaplan–Meier plots revealed the correlation between gene expression and OS rate. (e) CCND1 in gastric, lung, and breast cancers (Kaplan–Meier Plotter). Kaplan–Meier plots showing OS in adenocarcinomas. In red: patients with expression above the median and in black, patients with expressions below the median. Kaplan–Meier plots revealed the correlation between gene expression and OS rate.
Expression of p27, CDK6, and CCND1 in lung cancer patients
In the data analysis mentioned above, p27 had reduced expression in cancer tissues. To verify these results, we detected changes in p27 mRNA expression in cancer tissues and corresponding paracancerous tissues from five patients with lung squamous cell carcinoma (Figure 3(a)). There was significant downregulation of p27 in four patients compared with the corresponding adjacent tissues, with accompanying changes in CDK6 and CCND1 expression (Figure 2(a)). The expression of these two genes influenced the survival of cancer patients (Figure 2(d,e)). Therefore, we also detected changes in the expression of CDK6 and CCND1 in the tissues from these five patients (Figure 3(b,c)). CDK6 was significantly upregulated in the tumor tissues of four cancer patients, but the expression of CCND1 did not show a stable trend. At the same time, the expression of p27 was detected in the cancer and paracancerous tissues of four lung squamous cell carcinoma patients and lung adenocarcinoma patients, as determined by immunohistochemistry (IHC) (Figure 3(d,e)). The downregulated expression of p27 was found in the cancer tissues of most patients with lung cancer.
Figure 3.
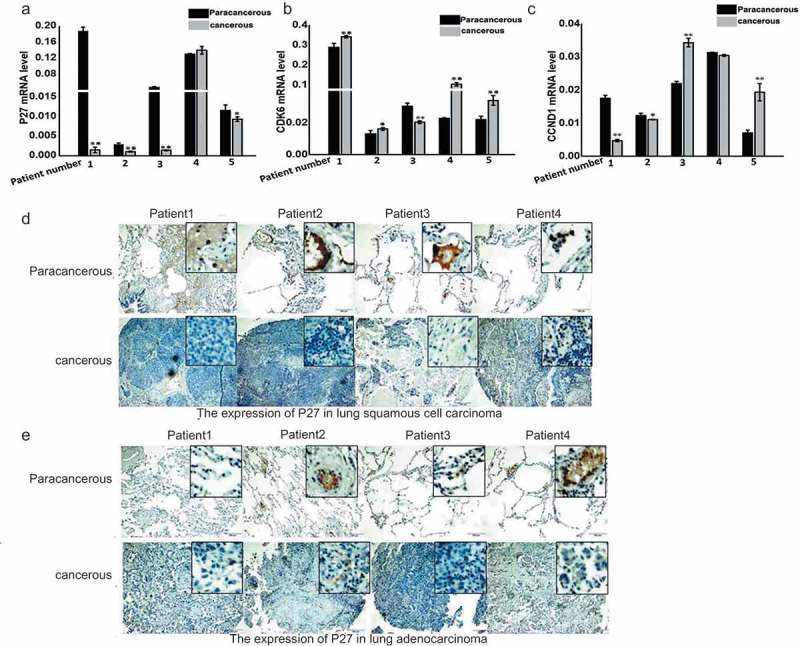
Expression of p27, CDK6, and CCND1 in lung cancer patients. (a) Expression of p27 in cancer tissues and the corresponding adjacent tissues of five lung cancer patients. (b) Expression of CDK6 in cancer tissues and the corresponding adjacent tissues of five lung cancer patients. (c) Expression of CCND1 in cancer tissues and the corresponding adjacent tissues of five lung cancer patients. (d) Expression of p27 was detected in cancer tissues and paracancerous tissues of four lung squamous cell carcinoma patients by IHC. (e) Expression of p27 was detected in cancer tissues and paracancerous tissues of four lung adenocarcinoma patients by IHC.
p27, CDK6, and CCND1 affected the proliferation of A549 lung cancer cells and HTB182 lung cancer cells
Quantitative PCR (qPCR) was used to detect the expression of p27, CDK6, and CCND1 after changing the expression levels of related genes in A549 cells (Figures 4(a) and 5(a)). Meanwhile, we detected cell proliferation at four time points (0, 24, 36, and 48 h) with flow cytometry and the MTT assay [11]. At 24, 36, and 48 h, there were many more cells with high p27 expression than low expression (Figures 4(b) and 5(b)). The same result was obtained for the optical density (OD) value of cells. P27 significantly decreased the OD value of cells in the same period (Figures 4(c) and 5(c)). P27 inhibited cell proliferation while CDK6 effectively increased the number of cells and the OD value of cells compared with cells during the same period. However, CCND1 had no obvious effects on cell proliferation (Figures 4(b,c) and 5(b,c)). When CDK6 and CCND1 were simultaneously upregulated, the rate of cell proliferation increased (Figures 4(d) and 5(d)). However, when p27 was upregulated, the positive effects of their simultaneous upregulation on cell proliferation were reduced (Figure 4(d)). The inhibitory effects on cell proliferation were relieved while p27 expression was downregulated (Figures 4(d) and 5(d)).
Figure 4.
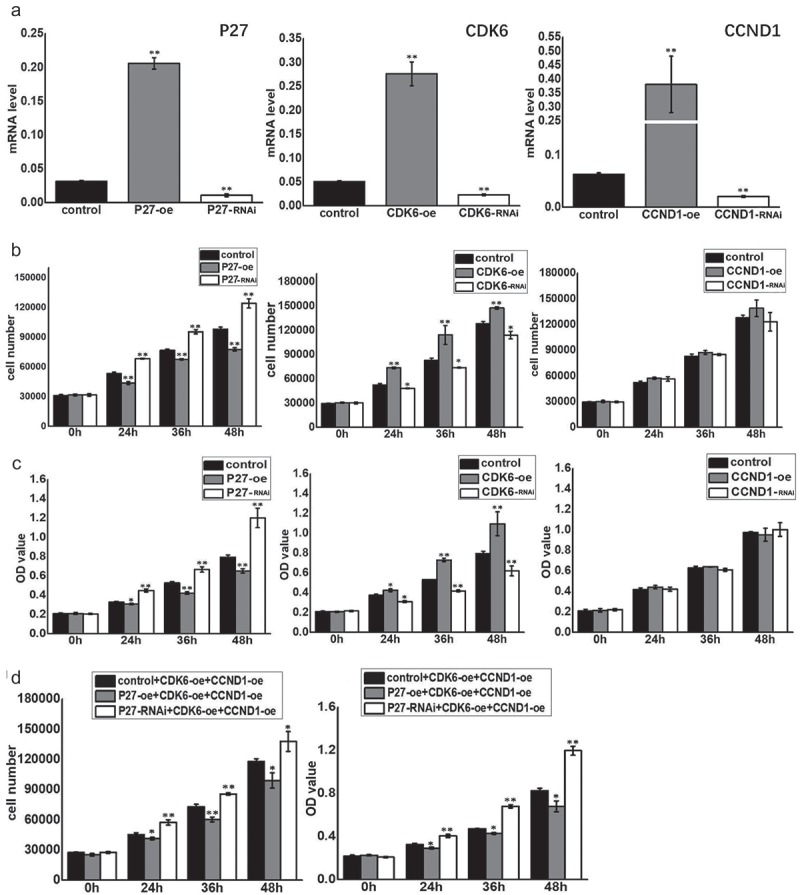
P27, CDK6 and CCND1 affected cell proliferation in A549 cells. (a) qPCR was used to detect the expression of p27, CDK6 and CCND1 after changing the expression levels of these genes. (b) The number of cells was detected by flow cytometry at 0, 24, 36, and 48 h after changing the expression of the related genes. Control: blank load transfection group as control group; P27-oe: over-expressed P27 in A549; P27-RNAi: Short Hairpin RNA on Expression of P27 in A549; CDK6-oe: over-expressed CDK6 in A549; CDK6-RNAi: Short Hairpin RNA on Expression of CDK6 in A549; CCND1-oe: over-expressed CCND1 in A549; CCND1-RNAi: Short Hairpin RNA on Expression of CCND1 in A549. Horizontal axis represents the hours after cell transfection. The vertical axis represents the cell number. (c) MTT reduction assay was used to reflect the proliferation at 0, 24, 36, and 48 h after changing the expression of related genes. Horizontal axis represents the hours after cell transfection. The vertical axis represents the OD value of cell proliferation. (d) Flow cytometry and MTT methods were used to detect cell proliferation at 0, 24, 36, and 48 h after changing the expression of related genes.
Figure 5.
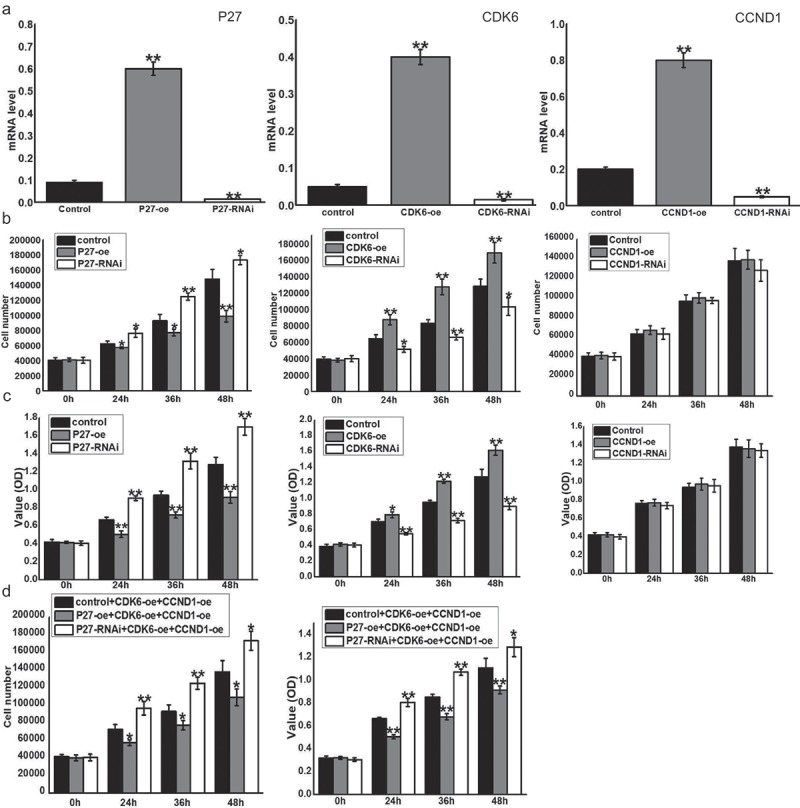
P27, CDK6 and CCND1 affected the proliferation of HTB182 cells. (a) qPCR was used to detect the expression of p27, CDK6 and CCND1 after changing the expression levels of these genes. (b) The number of cells was detected by flow cytometry at 0, 24, 36, and 48 h after changing the expression of related genes. Control: blank load transfection group as control group; P27-oe: over-expressed P27 in HTB182; P27-RNAi: Short Hairpin RNA on Expression of P27 in HTB182; CDK6-oe: over-expressed CDK6 in HTB182; CDK6-RNAi: Short Hairpin RNA on Expression of CDK6 in HTB182; CCND1-oe: over-expressed CCND1 in HTB182; CCND1-RNAi: Short Hairpin RNA on Expression of CCND1 in HTB182. Horizontal axis represents the hours after cell transfection. The vertical axis represents the cell number. (c) MTT reduction assay was used to reflect cell proliferation at 0, 24, 36, and 48 h after changing the expression of related genes. Horizontal axis represents the hours after cell transfection. The vertical axis represents the OD value of cell proliferation. (d) Flow cytometry and MTT methods were used to detect cell proliferation at 0, 24, 36, and 48 h after changing the expression of related genes.
P27, CDK6, and CCND1 affected the cell cycle in A549 cells and HTB182 cells
To determine the mechanism by which p27, CDK6, and CCND1 regulated cell proliferation, we monitored changes in the cell cycle by flow cytometry when the expression levels of these genes were changed. When p27 was overexpressed, cell proliferation was negatively regulated, the number of cells in the G1 phase increased, and the number of cells in the S and G2 phases decreased. When p27 was knocked down, the opposite results were observed (Figures 6(a) and 7(a)). The high expression of p27 increased the proportion of cells in the G1 phase and blocked cells from entering the S and G2 phases, thereby inhibiting cell proliferation. We also examined the effects of CDK6 and CCND1, which form the cell cycle-dependent complex, on cell cycle changes. High CDK6 expression promoted the cell transition from the G1 phase to the S phase (Figures 6(b) and 7(b)). However, CCND1 had no apparent effects on cell cycle switching (Figures 6(c) and 7(c)). When both CDK6 and CCND1 were overexpressed at the same time, cells entered the S phase more rapidly from the G1 phase (Figures 6(d) and 7(d)). However, when p27 was upregulated in addition to CDK6 and CCND1 upregulation, cell cycle progression from the G1 phase to S phase slowed down and underwent cell cycle arrest in the G1 phase. When the expression of p27 was downregulated, cell cycle arrest was significantly relieved (Figures 6(d) and 7(d)). These data confirmed that p27 affects the cell cycle transition via CDK6 and CCND1.
Figure 6.
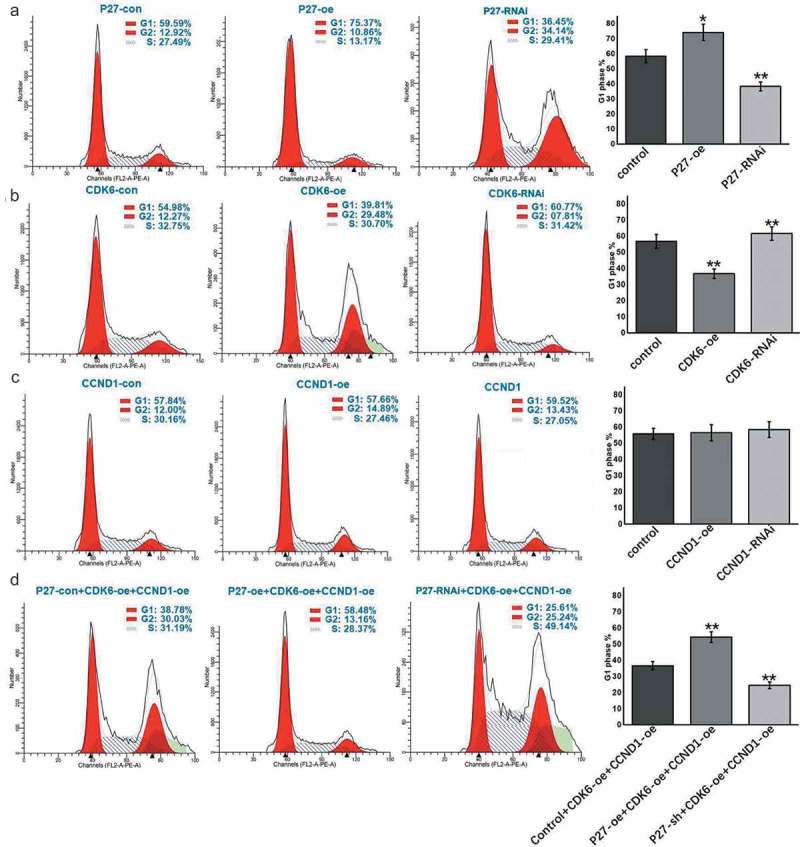
P27, CDK6 and CCND1 regulate the cell cycle in A549 cells. (a) Flow detection of cell cycle after changes to p27 expression. (b) Flow detection of cell cycle after changes to CDK6 expression. (c) Flow detection of cell cycle after changes to CCND1 expression. (d) Flow detection of cell cycle after changes to p27, CDK6, CCND1 expression
Figure 7.
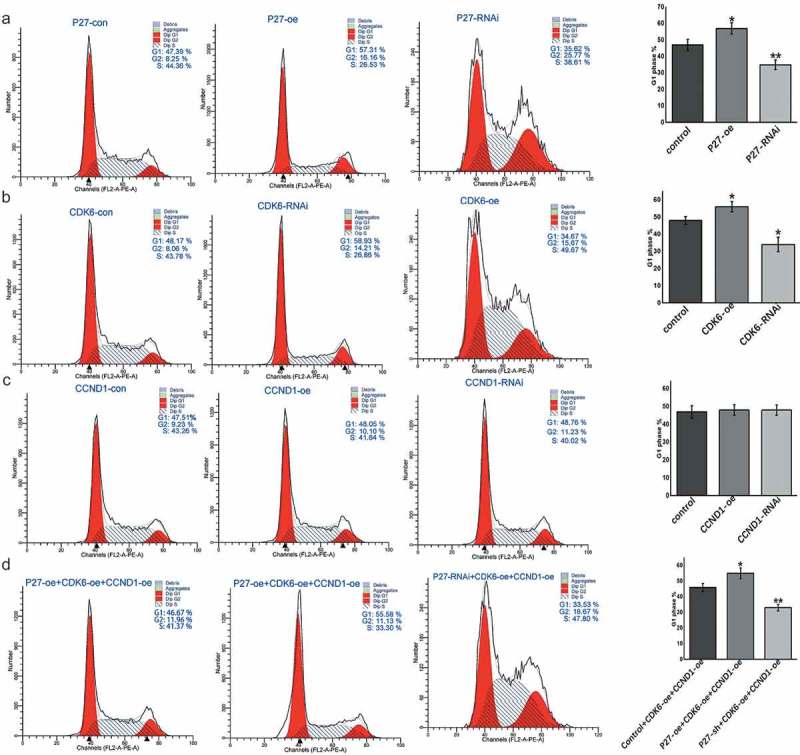
P27, CDK6 and CCND1 regulate the cell cycle in HTB182 cells. (a) Flow detection of cell cycle after changes to P27 expression. (b) Flow detection of cell cycle after changes to CDK6 expression. (c) Flow detection of cell cycle after changes to CCND1 expression. (d) Flow detection of cell cycle after changes to P27, CDK6, CCND1 expression.
P27 affected formation of the CDK6/CCND1 complex
The expression of CDK6 and CCND1 was detected after p27 was upregulated or downregulated, respectively (Figure 8(a)). The results showed that p27 did not inhibit the expression of CDK6 and CCND1. According to the experimental results mentioned above (Figures 4(b,c), 5(b,c), 6(c) and 7(c)), upregulation of CCND1 did not have a significant effect on cell cycle progression and cell proliferation. However, the upregulation of CDK6 and CCND1 accelerated cell cycle progression from the G1 phase to S phase, and cell proliferation was also faster than that of CDK6 alone (Figures 4(d), 5(d), 6(d) and 7(d)). The effects of p27 on the protein expression of CDK and CCND1 was detected by co-immunoprecipitation and Western blotting experiments, which were also used to detect the role of p27 on formation of the CDK6/CCND1 cell cycle complex (Figure 8(b)). Changes in p27 expression did not cause changes in CDK or CCND1 protein expression; however, the binding efficiency between CDK and CCND1 changed, indicating the varies in formation of the cell cycle complex. Furthermore, p27 impacted formation of the CDK6/CCND1 cell cycle-dependent complex, as determined by immunofluorescence (Figure 8(c)). Specifically, p27 inhibited the formation of cell cycle-dependent complexes in the nucleus. Retinoblastoma protein (Rb) is a downstream target gene of the CDK6/CCND1 complex [12]. Formation of the CDK6/CCND1 complex can induce Rb phosphorylation and promote the transition from the G1 phase to S phase [13], thereby promoting cell proliferation. P27 inhibited formation of the CDK6/CCND1 cell cycle-dependent complex. Phosphorylation of Rb was detected when p27 expression changed (Figure 8(d)). Together, the experimental results showed that upregulation of P27 can suppress the phosphorylation of Rb by blocking formation of the CDK6/CCND1 cell cycle-dependent complex in A549 and HTB182 cells.
Figure 8.
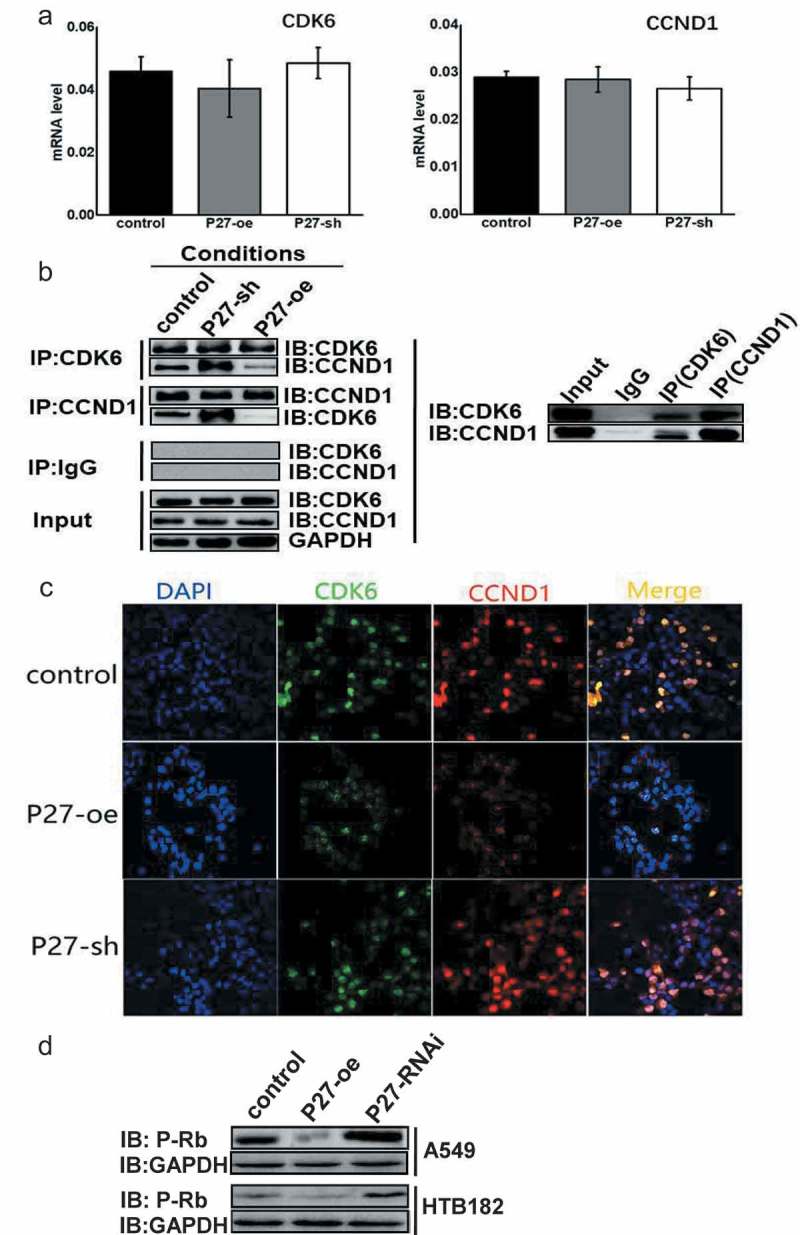
P27 affects the formation of CDK6/CCND1 complex. (a) qPCR was used to detect the expression of CDK6 and CCND1 after regulating the expression of P27 in A549 cells. (b) Co-immunoprecipitation and Western blotting were combined to examine the effects of p27 on formation of the CDK6/CCND1 complex after regulating the expression of P27 in A549 cells. (c) The distribution of CDK6 and CCND1 was detected by immunofluorescence after regulating the expression of p27 in A549 cells. (d) Phosphorylation of Rb was detected when the expression of p27 was changed in A549 and HTB182 cells.
Discussion
The results of this study clearly showed that p27 has conservative functions in regulating the cell cycle (Figure 9); we detail how this occurs (Figure 9(b)). P27 did not affect the expression of genes associated with cell cycle-dependent complexes, but the binding efficiency. P27 has been identified as an important regulator of cell cycle [14]. Mutations in p27 result in changes in cell cycle regulation [15], leading to a defective cell cycle and uncontrolled cell proliferation which can induce tumors [16,17]. Here, we showed that p27 is also involved in regulation of CDK6/CCND1 complex formation. However, p27 did not change the expression levels of CDK6 or CCND1. The goal of our future studies may be to determine the mechanisms that affect complex formation.
P27 is regarded as an important target for anti-cancer therapy [18]. In this study, positive effects on OS were observed with upregulation of p27. In addition, the cycle-dependent complex-associated gene CDK6 promoted cell proliferation and negatively affected the survival rate of cancer patients. However, another gene, CCND1, showed the opposite effect.
In summary, the results of this study demonstrated the effects of p27 on the regulation of the cell cycle and cell proliferation. In addition, the mechanisms underlying regulation of the cell cycle by p27 were discussed in depth, and the regulatory relationship between p27 and the cell cycle-dependent complex genes CDK6 and CCND1 was explored. This study provides fundamental knowledge and information which can be used as a basis to further explore the cell cycle.
Material and methods
Cells and treatment
The A549 human lung cancer cells were supplied by the Cell Bank of Chinese Academy of Sciences (Shanghai, China). For qPCR, fresh cells were frozen by immersion in liquid nitrogen and stored at −80 °C. Each experiment was performed in triplicate.
RNA extraction and cDNA synthesis
Total RNA was extracted from eggs using the MicroElute Total RNA Kit (Omega Bio-Tek, Norcross, GA, USA). Total RNA from A549 cells was extracted using Trizol Reagent (Invitrogen, Carlsbad, CA, USA) according to the manufacturer’s instructions. RNA quality was verified spectrophotometrically with an A260/A280 ratio between 1.8 and 2.0. cDNA was synthesized from 2 μg DNase-treated total RNA samples with oligo (dT) primers and PrimeScript™ Reverse Transcriptase (TaKaRa, Tokyo, Japan) according to the manufacturer’s instructions. cDNA was diluted 10-fold and used in the qPCR experiments.
Fluorescence qPCR
Fluorescence qPCR experiments were performed using a qPCR system (CFX96; Bio-Rad, Hercules, CA, USA) with the SYBR Premix EX Taq Kit (Takara, Dalian, China), according to the manufacturer’s recommendations. β-actin was used as an internal control to eliminate variation in cDNA quality. Transcript abundance was calculated based on the mean of three replicates.
Cell transfection
When the cells were more than 70% confluent, they were transfected using PolyJet TM DNA Transfection Reagent (SignaGen Laboratories, Rockville, MD, USA) with the following plasmids: empty vector, p27 overexpression vector (p27-oe), p27 interference vector (p27-RNAi), CDK6 overexpression vector (CDK6-oe), CDK6 interference vector (CDK6-RNAi), CCND1 overexpression vector (CCND1-oe), and CCND1 interference vector (CCND1-RNAi). Experiments were conducted 48 h post-transfection. Related gene sequences are listed in Supplement 1.
Analysis of cell proliferation and the cell cycle
After transfection for 0, 24, 48, and 72 h, the changes in cell number and the cell cycle were detected by flow cytometry. The MTT cell viability assay was used to evaluate cell proliferation at 48 h post-transfection [19]. Briefly, the cells were placed into 96-well plates and then 10 µL MTT Reagent (Beyotime Biotechnology, Beijing, China) was added to each well, followed by a 4 h incubation in the cell culture incubator. Finally the absorbance in each well was measured at 570 nm using a microtiter plate reader. In the cell proliferation and cell cycle assays, three replicates were used for each treatment group.
Immunoprecipitation
After cells were harvested using cell lysis buffer (containing protease inhibitors), they were incubated for 30 min at 4 °C, and centrifuged at 12,000 xg for 30 min. A small amount of lysate was used for Western blot analysis, and the remaining lysate was used for immunoprecipitation with 1 mg antibody and 10–50 uL protein A/G beads. After overnight incubation at 4 °C with shaking, the lysate was centrifuged at 3,000 xg for 5 min, and the protein A/G beads were washed three times with 1 mL lysis buffer. Finally 2x sodium dodecyl sulfate (SDS) sample buffer was added to the beads followed by SDS-polyacrylamide gel electrophoresis. The proteins were analyzed by either Western blotting or mass spectrometry.
Immunofluorescence
Changes in the distribution of CDK6 and CCND1 were detected by the immunofluorescence assay. The following primary antibodies were used: rabbit anti-CDK6 and rat anti-CCND1 (Cell Signaling Technology [CST], Danvers, MA, USA). The nucleus was stained with DAPI (Beyotime Biotechnology). Fluorescent-conjugated secondary antibodies were also obtained from Beyotime Biotechnology. Confocal microscopy was performed using the Olympus TCS SP5 confocal microscope (Olympus, Tokyo, Japan) with a 40x/1.25 oil objective.
Gene expression analysis
We used Firebrowse (http://www.firebrowse.org/) to detect p27 expression in different tumor tissues and their corresponding normal tissues, and to compare changes in expression levels of p27 [20]. Firebrowse allows scientists to gain access to terabytes of data and close to 1,000 reports. To systematize analyzes from The Cancer Genome Atlas (TCGA) pilot and to scale their execution to the dozens of remaining diseases to be studied, Firebrowse now sits atop ~ 40 terabytes of TCGA data and reliably executes more than 6,000 pipelines per month.
Kaplan–Meier plotter analysis
The prognostic value of p27 in lung, gastric, and breast cancers have been analyzed using the Kaplan–Meier Plotter (http://kmplot.com/analysis/) [21], a database that integrates gene expression data and clinical data [22]. To date, the Kaplan–Meier Plotter contains information on 22,277 genes and their effects on the survival of 2,977 breast, 1,065 gastric, and 1,715 lung cancer patients. We focused our analysis on OS. To this end, the patient samples were divided into two groups: high and low p27 expression, and compared using the Kaplan–Meier survival plot. The hazard ratio with 95% confidence intervals and log rank p value were calculated. We analyzed the best specific probes (JetSet probes) that recognized p27 to reduce our false discovery rate, and selected p < 0.05 as the threshold.
Immunohistochemistry
All specimens were fixed in 4% formalin and embedded in paraffin, and cut into 4 μm thick sections, followed by immunohistochemistry using antibodies against p27 (CST).
Funding Statement
The research was supported by the National Natural Science Foundation of China (Nos. 31472153 and 31372379), the Hi-Tech Research and Development 863 Program of China Grant (No. 2013AA102507), and Funds of China Agriculture Research System (No. CARS-18-ZJ0102); No. 31472153, No. 31372379 [No. 31472153, No. 31372379]; No. CARS-18-ZJ0102 [No. CARS-18-ZJ0102]; No. 2013AA102507 [No. 2013AA102507].
Highlights
p27, CDK6, and CCND1 affect growth and development.
p27 regulates the cell cycle by affecting CDK6/CCND1 complex formation.
Upregulation of CCND1 alone is unable to effectively promote cell proliferation.
Acknowledgments
We thank Dr. Songzhen He for grammatical assistance, Dr. Yuyun Wu for providing the vectors, and Dr. Kunpeng Lu and Shubo Liang for technical assistance.
Disclosure statement
No potential conflict of interest was reported by the authors.
Author contributions
Experiments were conceived and designed by Fangyin Dai, Niannian Li and Jie Zeng. Experiments were performed by Niannian Li, Jie Zeng, Fuze Sun, Xiaoling Tong, and Gang Meng. Data were analyzed by Jie Zeng, Niannian Li, Chunman Wu, Xin Ding, and Lanlan Liu. Reagents, materials, and tools were prepared by Jie Zeng. The manuscript was prepared by Niannian Li. Xiaoling Tong, Minjin Han, Cheng Lu, and FangyinDai revised the manuscript.
Supplementary material
Supplemental data can be accessed here
References
- [1].Hartwell L. Defects in a cell cycle checkpoint may be responsible for the genomic instability of cancer cells. Cell. 1992;71:543–546. [DOI] [PubMed] [Google Scholar]
- [2].Berton S, Pellizzari I, Fabris L, et al. Genetic characterization of p27(kip1) and stathmin in controlling cell proliferation in vivo. Cell Cycle. 2014;13:3100–3111. [DOI] [PMC free article] [PubMed] [Google Scholar]
- [3].Kohoutek J, Dvorak P, Hampl A.. Temporal distribution of CDK4, CDK6, D-type cyclins, and p27 in developing mouse oocytes. Biol Reprod. 2004;70:139–145. [DOI] [PubMed] [Google Scholar]
- [4].Sangfelt O, Erickson S, Castro J, et al. Molecular mechanisms underlying interferon-alpha-induced G0/G1 arrest: CKI-mediated regulation of G1 Cdk-complexes and activation of pocket proteins. Oncogene. 1999;18:2798–2810. [DOI] [PubMed] [Google Scholar]
- [5].Donjerkovic D, Mueller CM, Scott DW. Steroid- and retinoid-mediated growth arrest and apoptosis in WEHI-231 cells: role of NF-kappaB, c-Myc and CKI p27(Kip1). Eur J Immunol. 2000;30:1154–1161. [DOI] [PubMed] [Google Scholar]
- [6].Aktas H, Cai H, Cooper GM. Ras links growth factor signaling to the cell cycle machinery via regulation of cyclin D1 and the Cdk inhibitor p27KIP1. Mol Cell Biol. 1997;17:3850–3857. [DOI] [PMC free article] [PubMed] [Google Scholar]
- [7].Chen TC, Ng KF, Lien JM, et al. Mutational analysis of the p27(kip1) gene in hepatocellular carcinoma. Cancer Lett. 2000;153:169–173. [DOI] [PubMed] [Google Scholar]
- [8].Yin MB, Guo B, Panadero A, et al. Cyclin E-cdk2 activation is associated with cell cycle arrest and inhibition of DNA replication induced by the thymidylate synthase inhibitor Tomudex. Exp Cell Res. 1999;247:189–199. [DOI] [PubMed] [Google Scholar]
- [9].Egozi D, Shapira M, Paor G, et al. Regulation of the cell cycle inhibitor p27 and its ubiquitin ligase Skp2 in differentiation of human embryonic stem cells. FASEB J. 2007;21:2807–2817. [DOI] [PubMed] [Google Scholar]
- [10].Kamura T, Hara T, Matsumoto M, et al. Cytoplasmic ubiquitin ligase KPC regulates proteolysis of p27(Kip1) at G1 phase. Nat Cell Biol. 2004;6:1229–1235. [DOI] [PubMed] [Google Scholar]
- [11].Zohrabian VM, Forzani B, Chau Z, et al. Rho/ROCK and MAPK signaling pathways are involved in glioblastoma cell migration and proliferation. Anticancer Res. 2009;29:119–123. [PubMed] [Google Scholar]
- [12].Komori T. Regulation of Rb family proteins by Cdk6/Ccnd1 in growth plates. Cell Cycle. 2013;12:2161–2162. [DOI] [PMC free article] [PubMed] [Google Scholar]
- [13].Arbogast A, Boutet S, Phelouzat MA, et al. Failure of T lymphocytes from elderly humans to enter the cell cycle is associated with low Cdk6 activity and impaired phosphorylation of Rb protein. Cell Immunol. 1999;197:46–54. [DOI] [PubMed] [Google Scholar]
- [14].Roy A, Banerjee S. p27 and leukemia: cell cycle and beyond. J Cell Physiol. 2015;230:504–509. [DOI] [PubMed] [Google Scholar]
- [15].Markaki EA, Stiakaki E, Zafiropoulos A, et al. Mutational analysis of the cell cycle inhibitor Kip1/p27 in childhood leukemia. Pediatr Blood Cancer. 2006;47:14–21. [DOI] [PubMed] [Google Scholar]
- [16].Kudo Y, Kitajima S, Sato S, et al. Transfection of p27(Kip1) threonine residue 187 mutant type gene, which is not influenced by ubiquitin-mediated degradation, induces cell cycle arrest in oral squamous cell carcinoma cells. Oncology. 2002;63:398–404. [DOI] [PubMed] [Google Scholar]
- [17].Zolota V, Sirinian C, Melachrinou M, et al. Expression of the regulatory cell cycle proteins p21, p27, p14, p16, p53, mdm2, and cyclin E in bone marrow biopsies with acute myeloid leukemia Correllation with Patients’ Survival. Pathol Res Pract. 2007;203:199–207. [DOI] [PubMed] [Google Scholar]
- [18].Roy S, Gu M, Ramasamy K, et al. p21/Cip1 and p27/Kip1 Are essential molecular targets of inositol hexaphosphate for its antitumor efficacy against prostate cancer. Cancer Res. 2009;69:1166–1173. [DOI] [PMC free article] [PubMed] [Google Scholar]
- [19].Aziz DM. Assessment of bovine sperm viability by MTT reduction assay. Anim Reprod Sci. 2006;92:1–8. [DOI] [PubMed] [Google Scholar]
- [20].Rajendran BK, Deng CX. A comprehensive genomic meta-analysis identifies confirmatory role of OBSCN gene in breast tumorigenesis. Oncotarget. 2017;8:102263–102276. [DOI] [PMC free article] [PubMed] [Google Scholar]
- [21].Hou GX, Liu P, Yang J, et al. Mining expression and prognosis of topoisomerase isoforms in non-small-cell lung cancer by using Oncomine and Kaplan-Meier plotter. PLoS One. 2017;12:e0174515. [DOI] [PMC free article] [PubMed] [Google Scholar]
- [22].Szasz AM, Lanczky A, Nagy A, et al. Cross-validation of survival associated biomarkers in gastric cancer using transcriptomic data of 1,065 patients. Oncotarget. 2016. [DOI] [PMC free article] [PubMed] [Google Scholar]
Associated Data
This section collects any data citations, data availability statements, or supplementary materials included in this article.


