Abstract
Stauntonia chinensis DC. has been utilised as a traditional herbal medicine for its anti‐hyperglycemic characteristic, which has been associated with triterpene saponins. The goal of the current evaluation was to examine hypoglycemic activity and affiliated mechanism of total saponins from S. chinensis. The chemical composition was analysed by HPLC‐ESI‐MS/MS. The fasting blood glucose, oral glucose tolerance test, insulin tolerance test, insulin and glycogen levels of type 2 diabetic db/db mice administered total saponins were quantified to determine the hypoglycemic effects. The serum lipid profiles were assessed to determine the hypolipidemic effects. Western blotting was used to quantify the protein levels of insulin receptor substrates (IRS)‐1/PI3K/AKT, AMPK/ACC and GLUT4. Twenty triterpene saponins were identified from the total saponins, which exhibited hypoglycemic activities and modulated hyperlipidemia that was associated with type 2 diabetes. The hypoglycemic effects were partly due to the activation of GLUT4, which is regulated by IRS‐1/PI3K/AKT. The activation of the AMPK/ACC signalling pathway may be responsible for the hypolipidemic activity. This study revealed that total saponins from S. chinensis have significant hypoglycemic and hypolipidemic activity in diabetic db/db mice, indicating that these may be utilised in the development of saponins based on S. chinensis for the treatment of type 2 diabetes.
Keywords: AMPK/ACC signalling pathway, hypoglycemic effect, hypolipidemic effect, IRS‐1/PI3K/Akt signalling pathway, Stauntonia chinensis, triterpene saponins
1. INTRODUCTION
Type 2 diabetes mellitus (T2DM) is a persistent metabolic disorder that is distinguished by postprandial and fasting hyperglycemia due to insulin resistance.1 According to the World Health Organization (WHO), nearly 415 million people had diabetes in 2016, with T2DM responsible for >90% of these cases.2, 3 Further, the majority of T2DM cases are connected with high blood lipid profiles, which can result in metabolic syndrome and later cause other medical issues, including cardiovascular diseases.4
The contemporary strategy to treat T2DM primarily involves oral anti‐hyperglycemic drugs, including sulfonylureas, biguanides α‐glucosidase inhibitors and thiazolidinedione. Nevertheless, these synthetic therapeutics cannot entirely regulate the glycemic levels and have unfavorable side effects, such as flatulence, nausea, meteorism and potentially diarrhea.5, 6 Natural compounds obtained from plant and agricultural crop resources have been utilised for diabetes because of their limited side effects.7
Saponins are plant secondary metabolites with wide pharmacological and industrial applications. Plant species containing saponins (Panax ginseng, Quillaja saponaria and Aesculus hippocas‐tanum) as well as isolated compounds (asiaticoside and aescin) have been widely used in the pharmaceutical and cosmetic industries.8 Pharmacological studies have revealed that saponins exhibit properties that reduce elevated plasma blood glucose, regulate lipid metabolism and reduce body fat without the occurrence of significant adverse health effects.9 It has been reported that saponins exert an anti‐hyperglycemic function by increasing plasma insulin levels,10 restoring insulin response,11 activating glycogen synthesis,12 and inhibiting α‐glucosidase activity.13 Saponins have also lowered increased triglyceride and serum cholesterolmodulates linked to T2DM by regulating the expression of numerous genes connected to lipid metabolism.9 These capabilities make saponins an outstanding drug candidate for the treatment of T2DM.
Stauntonia chinensis DC., frequently referred to as “Ye Mu Gua,” is an evergreen herb that grows throughout Southern China and is a part of the Lardizabalaceae family. S. chinensis has been utilised as a traditional herbal medicine due to its anti‐inflammatory, anti‐hyperglycemic and analgesic characteristics.14 The previous phytochemical study on S. chinensis indicated that it is a rich source of saponins, which may be responsible for the pharmacological activities of this plant.15, 16 The results of our previous study showed that triterpene saponins from S. chinensis improved glucose uptake and insulin sensitivity in hepatic cells.17 However, the hypoglycemic effect in vivo and the underlying mechanism remained unclear. For the development of the saponins based on S. chinensis for medicinal use, we investigated the triterpene saponin structures, hypoglycemic and hypolidemic effects and underlying mechanism of the total saponins from S. chinensis (TSS) in type 2 diabetic db/db mice.
2. MATERIALS AND METHODS
2.1. Chemicals and reagents
Each of the chemical reagents and the HP‐20 micro resin were of analytical grade and purchased from Sinopharm (Shanghai, China). Glycine, bovine insulin, sodium dodecyl sulfate, sodium salt (SDS), glycerine, tween‐20, ammonium persulfate and skimmed milk powder and dimethyl sulfoxide were purchased from BioSharp (Hefei, Anhui, China). Trypsogen, acrylamide, Tris‐base and tetramethyl ethylene diamine were purchased from Sigma (St. Louis, MO, USA). Glucose and a glycogen assay kit were purchased from Jiancheng (Nanjing, Jiangsu, China). Protein lysis buffer and the molecular weight marker were obtained from Thermo Fisher Scientific (Waltham, MA, USA). All of the antibodies were purchased from Santa Cruz Biotechnology (Santa Cruz, CA, USA).
2.2. Plant materials
The stems of S. chinensis were gathered from Nanning, Guangxi Zhuang Autonomous Region, P. R. China and discerned by Jin‐Wei Huang, an associate chief pharmacist of Guangxi Institute of Minority Medicine. The voucher specimen (20090801) was submitted to the Herbarium of College of Pharmacy, South‐Central University for Nationalities.
2.3. Preparation of TSS
The stems of S. chinensis (2.5 kg) were removed with 60% ethanol (EtOH) three times and then consecutively separated with EtOAc and n‐BuOH. The extract of n‐BuOH (109 g) was subjected to HP‐20 micro resin and eluted with water, 30% aqueous ethanol, 50% aqueous ethanol and 70% aqueous ethanol to produce five fractions. The TSS was acquired from the 50% and 70% ethanol fractions and saponin content of up to 90.48% was quantified using the colorimetric method.18
2.4. HPLC conditions
Chromatography was conducted on a Thermo Scientific Dionex UltiMate 3000 UHPLC+ Focused LC system (Thermo Fisher Scientific). The columns were kept at 30°C. The separation was performed on a Thermo Scientific Hypersil ODS C18 column (2.1 mm × 150 mm, i.d., 3 μm; Thermo Fisher Scientific). The mobile phase used water with 0.1% (v/v) formic acid (A) and acetonitrile with 0.1% (v/v) formic acid (B). A gradient program was utilised as follows: 0‐40 minutes, 20%‐40% B; 40‐60 minutes, 40%‐60% B; 60‐70 minutes, 60%‐85% B; the composition then remained at 85% B for 3 minutes and returned to the initial conditions and was kept at 10 minutes for equilibration. The flow rate was 0.2 mL/min.
2.5. Mass spectrometry conditions
MS was conducted with an LCQ Fleet ion trap mass spectrometer (Thermo Fisher Scientific) through an ESI interface, which was operated in the positive and negative ion modes. The conditions of the ESI source were as follows: ispray voltage 5 kV; spray current 10 μA; sheath gas flow rate 35 arbitrary units; Aux gas flow rate 10 arbitrary units; sweep gas flow rate 1 arbitrary units; capillary temperature 350°C; capillary voltage 10 V; tube lens 90 V; and the mass range was recorded m/z 100‐2000. The chemicals were draw by software “Chemdraw.”
2.6. Animals
Six‐week‐old C57 db/db male mice were obtained from the Model Animal Research Center of Nanjing University (Nanjing, Jiangsu, China). Each mouse was kept at a regulated room temperature (25 ± 2°C), humidity (55 ± 5%) and a 12 hour/12 hour light/dark cycle and the mice were provided with water and typical laboratory feed ad libitum. Each mouse was taken care of in accordance with the Animal Experimental Ethics Committee of South‐Central University for Nationalities (Approval no. 2016‐SCUEC‐AEC‐0037). All efforts were made to limit the animals’ suffering.
2.7. Acute toxicity study
Kunming mice (n = 50) of either sex weighing 18‐22 g were subjected to an acute toxicity study. The doses of TSS for the study were 0.5, 1, 1.5 and 2 g/kg bodyweight (BW). After food and water deprivation for 12 hours, the mice were treated orally with 0.9% saline or TSS dissolved in 0.9% saline. The mice were examined at 0 minute, 15 minutes, 30 minutes, 60 minutes, 120 minutes, 180 minutes and 24 hours following the TSS treatment for behavioural, neurological and autonomic profiles and lethality.
2.8. Treatment protocol
After 2 weeks of adaptive breeding, the mice were randomly assigned to six groups. C57 male mice (n = 6) were set as the standard chow control group (Normal), and C57 db/db male mice were divided into five groups containing six mice each: the T2DM model db/db group (Model), the 200 mg/kg metformin positive control group (Met), the 30 mg/kg TSS group (TSS‐30 mg/kg), the 60 mg/kg TSS group (TSS‐60 mg/kg), and the 120 mg/kg TSS group (TSS‐120 mg/kg). All of the mice were dosed by gavage once a day for three consecutive weeks and weighed every 3 days throughout the experiment.
2.9. Preparation and biochemical analysis of serum samples
The mice were fasted for 12 hours and blood samples were obtained from the tail vein. The fasting blood glucose (FBG) was quantified with a OneTouch Ultra glucose monitor (Johnson, TX, USA) prior to the beginning of the treatment (day 0) and every 7 days throughout the experiment. The serum was divided by centrifugation and subjected to the quantification of various biochemical parameters: total cholesterol (TC), triglyceride (TG), high/low‐density lipoprotein‐cholesterol (H/LDL‐C), and insulin. The Cholesterol, LDL‐C and HDL‐C were evaluated by using an automatic biochemical analyser (Hitachi 7180+ISE, Tokyo, Japan). Serum insulin levels were determined by Elisa kits (Mercodia, Uppsala, Sweden).
On day 15 of the treatment, an oral glucose tolerance test (OGTT) was conducted following an overnight fast. The blood glucose concentration before glucose administration was set as baseline (0 minute). After that, the mice were orally administered 2 g glucose/kg of BW, and the blood glucose level was established at 30, 60 and 120 minutes following oral glucose administration.
An insulin tolerance test (ITT) was conducted on day 18 of the treatment after overnight fasting. The blood glucose levels were quantified prior to injecting insulin (0 minute) and at 30, 60 and 120 minutes following the inter‐peritoneal injection of insulin (0.2 U/kg BW).
2.10. Determination of liver and skeletal glycogen levels
At the end of the treatment, the mice were killed with an overdose of intraperitoneal anaesthesia. Tissue samples from the liver and skeletal muscles were removed, rinsed with 0.9% saline, weighed and kept at −80°C for additional analysis. The glycogen contents of the liver and skeletal muscle were quantified with a typical glycogen kit (Jiancheng, Nanjing, Jiangsu Province, China) following the manufacturer's recommendations. The amount of glycogen in every tissue sample was expressed as milligrams of glucose per gram of tissue.
2.11. Histopathological examination
The liver tissues were excised and washed with normal saline. The washed tissues were immediately fixed in 10% neutral‐buffered formalin solution and processed via the paraffin wax embedding method. The paraffin‐embedded tissues were cut into 5 μm thickness section followed by hematoxylin‐eosin staining (HE) for histopathological examination.
2.12. Western blot analysis
Total proteins from the liver and skeletal muscle were extracted and quantified using a BCA protein assay kit (Beyotime, Shanghai, China). The proteins were divided with 10% sodium dodecyl sulfate‐polyacrylamide gel electrophoresis (SDS‐PAGE) and moved to polyvinylidene difluoride membranes (Millipore, Shanghai, China). The membranes were halted by 5% skimmed milk/BSA for 2 hours at room temperature and incubated with monoclonal antibodies overnight at 4°C. After that, the membranes were rinsed and incubated with secondary antibodies for 2 hours at room temperature. The protein bands were examined with a UVP detection system and quantified with LABWORKS 4.6. β‐Actin protein was set as the internal control.
2.13. Statistical analysis
The data were expressed as mean ± SEM. Statistical analysis was performed via one‐way ANOVA and then using a Student's t test (SPSS Program, version 11.5; SPSS Inc., Chicago, IL, USA). Differences amongst groups were considered to be significant at P < 0.05.
3. RESULTS
3.1. Identification of triterpenoid saponins in the TSS by HPLC‐ESI‐MS/MS
Under the current chromatographic and MS conditions, almost 36 peaks were identified from the TSS. Twenty of these major peaks were established via contrasting the molecular formulae and fragmentation patterns with documented data in the literature. The information related to the detected compounds is condensed and revealed in Table 1 and the chemical structures are shown in Figure 1. Based on their sapogenins, the distinguished triterpene saponins can be separated into two basic types: 30‐nor‐oleanane‐type oligoglycosides (type A) or oleanane‐type oligoglycosides (type B). Compound 7 was used an example to discuss the structure elucidation in detail. Compound 7, detected at an RT of 16.3 minutes in TSS, displayed an 1397 [M+HCOO]− ion at m/z 1397 and [M+Na]+ ion at 1375, indicating a molecular formula of C64H104O30. The MS2 spectrum of the ion at m/z 1375 [M+Na]+gave positive fragments at m/z 905 [M+Na‐470]+, 861 [M+Na‐470‐44]+ and 493 [470+Na]+, suggesting that there was a sugar chain rhamnopyranosyl‐(1→4)‐glucopyranosyl‐(1→6)‐glucopyranosyl connected to 7 by an ester bond. Other fragment ions at 729 [(M+Na‐470‐44)‐132]+, 583 [(M+Na‐470‐44)‐132‐146]+ and 451 [(M+Na‐470‐44)‐132‐146‐132]+ suggested the presence of another sugar chain ether‐linked in 7 comprising two pentoses and one deoxyhexose, in which two pentoses were at the terminal and inner position. The aglycone was determined to be 30‐norhederagenin. Therefore, the structure of 7 was tentatively assigned as yemuoside YM32 by comparison of the fragmentation patterns with a previous report.15 In the same way, the structures of the other triterpene saponins were determined as depicted in Figure 1.
Table 1.
Triterpene saponins identified in the TSS by HPLC‐ESI‐MS/MS
| No. | t R (min) | Molecular formula | ESI‐MS | Identification | Refs. |
|---|---|---|---|---|---|
| 1 | 7.7 | C58H90O28 | 1257 [M + Na]+ | Stauntoside K | 39 |
| 2 | 9.2 | C63H100O30 | 1359 [M + Na]+ | Yemuoside YM28 | 15 |
| 3 | 9.8 | C58H92O26 |
1249 [M+HCOO]−
1227 [M + Na]+ |
Glycoside L‐H3 | 39 |
| 4 | 10.2 | C52H82O22 |
1103 [M+HCOO]−
1081 [M + Na]+ |
Glycoside L‐G1 | 40 |
| 5 | 12.3 | C52H82O22 |
1103 [M+HCOO]−
1081 [M + Na]+ |
New | NF |
| 6 | 13.6 | C59H94O28 |
1249 [M ‐ H]−
1273 [M + Na]+ |
Stauntoside L | 39 |
| 7 | 16.3 | C64H104O30 |
1397 [M+HCOO]−
1375 [M + Na]+ |
Yemuoside YM32 | 15 |
| 8 | 17.9 | C59H96O26 |
1265 [M+HCOO]−
1243 [M + Na]+ |
Hederasaponin C | 39 |
| 9 | 19.3 | C53H86O22 |
1119 [M+HCOO]−
1097 [M + Na]+ |
Hederasaponin D | 39 |
| 10 | 22.7 | C58H94O26 |
1251 [M+HCOO]−
1229 [M + Na]+ |
Yemuoside YM35 | 15 |
| 11 | 23.9 | C53H86O22 |
1119 [M+HCOO]−
1097 [M + Na]+ |
Dipsacoside B | 41 |
| 12 | 27.4 | C63H100O29 |
1365 [M+HCOO]−
1343 [M + Na]+ |
Yemuoside YM21 | 42 |
| 13 | 31.1 | C58H92O25 |
1233 [M+HCOO]−
1211 [M + Na]+ |
Yemuoside YM10 | 42 |
| 14 | 33.2 | C57H90O25 |
1219 [M+HCOO]−
1197 [M + Na]+ |
Yemuoside YM24 | 42 |
| 15 | 45.0 | C45H70O16 |
911 [M+HCOO]−
889 [M + Na]+ |
Yemuoside YM37 | 43 |
| 16 | 48.9 | C51H82O20 |
1059 [M+HCOO]−
1037 [M + Na]+ |
New | NF |
| 17 | 50.4 | C47H74O18 |
925 [M‐H]−
949 [M + Na]+ |
New | NF |
| 18 | 53.7 | C41H66O12 |
795 [M+HCOO]−
751 [M + H]+ |
3‐O‐α‐l‐rhamnopyranosyl‐(1→2)‐α‐l‐arabinopyranosyl‐hederagenin | 43 |
| 19 | 55.7 | C45H70O15 |
849 [M‐H]−
873 [M + Na]+ |
3‐O‐α‐l‐arabinopyranosyl‐(1→3)‐α‐l‐rhamnopyranosyl‐(1→2)‐α‐l‐arabinopyranosyl‐akebonic acid | 43 |
| 20 | 60.0 | C47H74O17 |
909 [M‐H]−
933 [M + Na]+ |
3β‐[(O‐β‐d‐glucuronopyranosyl‐(1→3)‐O‐[α‐l‐rhamnopyranosyl‐(1→2)]‐α‐l‐arabinopyranosyl)oxy]olean‐12‐en‐28‐oic acid | 44 |
NF: not found.
Figure 1.
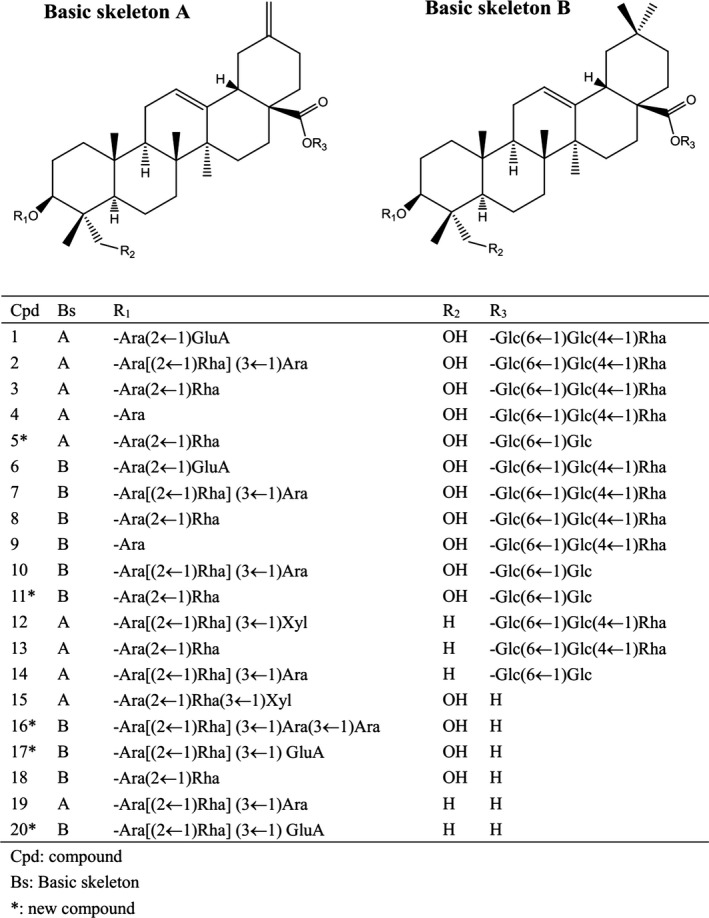
Chemical structures of triterpene saponins identified in TSS
3.2. Acute toxicity study
Toxicological evaluation is a crucial constituent part of the drug development procedure.19 In the acute toxicity study, no deaths or bad clinical signs, such as no appetite, agitation, or uneasiness, was observed with the maximum dose of 2000 mg/kg. The results of the acute toxicity study indicated that the TSS was safe up to a single dose of 2000 mg/kg BW. Coupled with the fact that the type 2 diabetic rats showed an anti‐diabetic effect at the dose of saponins at 50‐200 mg/kg,20 the concentration of TSS for further analysis was fixed as 30, 60 and 120 mg/kg.
3.3. Effect on BW
Obesity is a critical risk factor for T2DM, and the regulation of BW has a large impact on improving insulin sensitivity.21 At the end of the study, the type 2 diabetes db/db mice showed a 12.75% increase in BW compared to the first day. Treatment with metformin resulted in a 9.82% increase in BW. Following 21 days of TSS treatment at 30, 60 and 120 mg/kg, BW was increased by 3.10%, 7.66% and 3.67%, respectively (Figure 2). TSS reduced the rate of weight increase in contrast to the db/db group.
Figure 2.
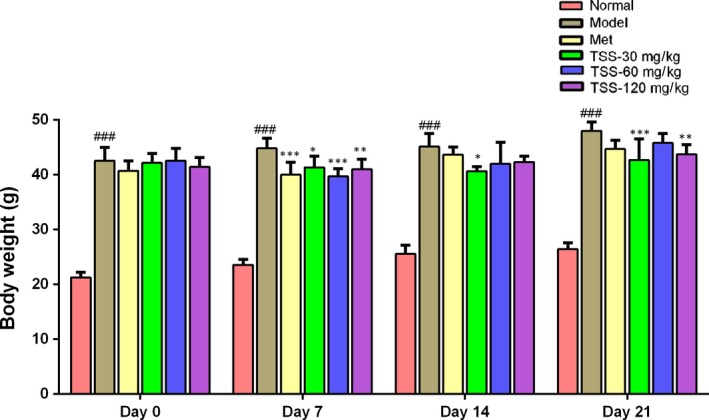
Effects of total saponins on body weight in type 2 diabetic db/db mice (n = 6). ### P < 0.001 in contrast to the normal group; *P < 0.05 in contrast to the model group; **P < 0.01 in contrast to the model group; and ***P < 0.001 in contrast to the model group
3.4. Effects on FBG, OGTT, ITT and serum insulin levels
The alterations in the FBG level of the mice are shown in Figure 3A. FBG levels of the db/db mice were significantly elevated, which was in contrast to the normal control group (P < 0.001). Metformin (200 mg/kg) caused a significant reduction in FBG levels in contrast to the db/db mice (P < 0.001). Each of the three doses of TSS significantly inhibited the increase in FBG levels in db/db mice throughout the entire experiment (P < 0.001) and showed dose‐dependent manners. Following the TSS treatment at 120, 60 and 30 mg/kg for 7 days, the FBG level was reduced by 36.33%, 32.20% and 22.37%, respectively. The model and metformin‐treated (200 mg/kg) mice showed a 24.05% increase and a 47.54% decrease in FBG, respectively. On day 14, the FBG values of the three TSS groups only increased slightly compared to day 7. Upon the conclusion of the experiment (day 21), the FBG levels of the three TSS groups 30, 60 and 120 mg/kg were reduced by 2.18%, 22.74% and 29.72%, respectively, in contrast with the FBG levels at day 0, whilst the FBG levels of the model group were elevated by 44.31%. The FBG levels of two TSS groups 60 and 120 mg/kg were similar to the metformin (200 mg/kg) group (P > 0.05).
Figure 3.
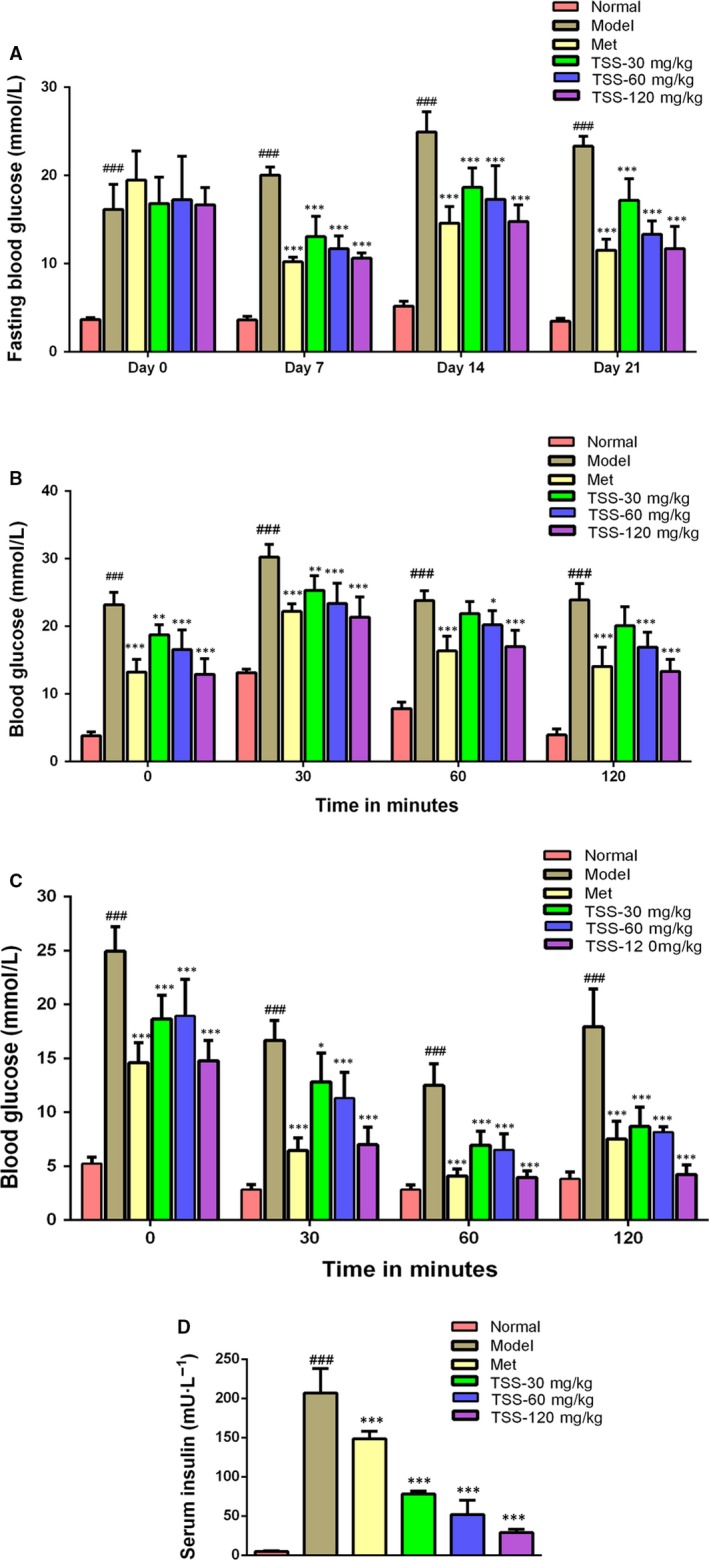
Effects of total saponins on fasting blood glucose levels (A), oral glucose tolerance (OGTT) (B), insulin tolerance (ITT) (C) and serum insulin content (D) in type 2 diabetic db/db mice (n = 6). ### P < 0.001 in contrast to the normal group; *P < 0.05 in contrast to the model group; **P < 0.01 in contrast to the model group and ***P < 0.001 in contrast to the model group
The OGTT results are shown in Figure 3B. The TSS treatment at 30, 60, 120 mg/kg revealed a highly significant lowering of plasma glucose levels. At 30 minutes following glucose administration, the blood glucose levels were reduced at 120 mg/kg compared with the metformin group. The ITT results are shown in Figure 3C. At 30 minutes following an insulin injection, the diabetic model, the metformin‐treated mice, and the 120 mg/kg TSS‐treated showed a 33.09%, 55.83% and 52.64% reduction in plasma glucose, respectively. At 60 minutes following an insulin injection, the diabetic model, the metformin‐treated mice and the 120 mg/kg TSS‐treated mice showed a 49.87%, 73.17% and 71.92% reduction in plasma glucose levels, respectively. TSS treatment at a dose of 120 mg/kg significantly enhanced the insulin‐induced decrease in plasma glucose levels.
As revealed in Figure 3D, the serum insulin levels in the db/db mice were significantly elevated compared to the normal mice (P < 0.001). Following 3 weeks of treatment with 30, 60, 120 mg/kg TSS and 200 mg/kg metformin, the serum insulin levels were decreased by 62.22%, 74.88%, 86.08% and 28.20% in contrast to those of the db/db model mice.
3.5. Effects on liver and skeletal muscle glycogen levels
The liver glycogen levels in the diabetic model mice were noticeably reduced compared to that of the normal mice (P < 0.001, Figure 4A). In contrast to the model mice, TSS treatments at doses of 60 and 120 mg/kg led to a significant increase in liver glycogen levels (P < 0.001, Figure 6A). Metformin could increase the liver glycogen level but this effect was not statistically significant. The muscle glycogen levels were also down‐regulated in the model mice when compared to the normal mice (P < 0.01, Figure 4B). Treatments using metformin and 120 mg/kg TSS, resulted in a significant increase in muscle glycogen levels compared to the model mice (P < 0.001, Figure 4B). The muscle glycogen levels of the 120 mg/kg TSS group (5.263 ± 0.812 mg/g tissue) were higher than that of the metformin group (2.631 ± 0.406 mg/g tissue).
Figure 4.
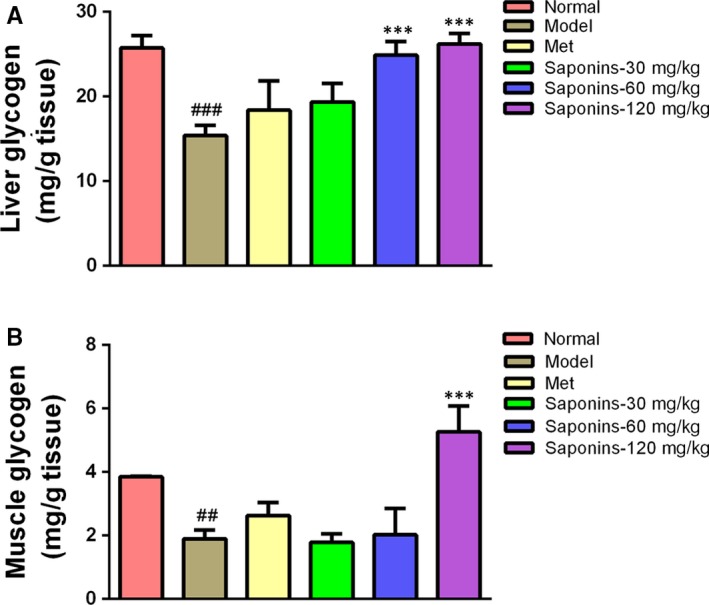
Effects of total saponins on liver glycogen levels (A) and muscle glycogen levels (B) in type 2 diabetic db/db mice (n = 6). ## P < 0.01 in contrast to the normal group; ### P < 0.001 in contrast to the normal group; and ***P < 0.001 in contrast to the model group
Figure 6.
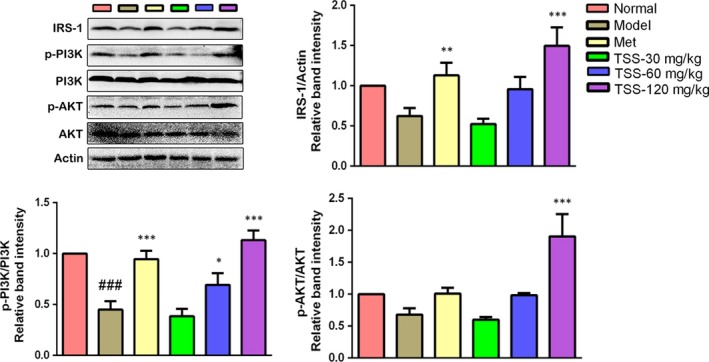
Effects of total saponins on the IRS‐1/PI3K/AKT pathway in liver tissues of type 2 diabetic db/db mice (n = 3). The protein expressions are shown as the mean grey scale of the matching bands in the bar graph. ### P < 0.001 in contrast to the normal group; *P < 0.05 in contrast to the model group; **P < 0.01 in contrast to the model group; and ***P < 0.001 in contrast to the model group
3.6. Effects on serum lipid profile
The TC, TG, HDL‐C and LDL‐C of the db/db model mice were all upregulated significantly when compared to the normal mice (P < 0.001, Table 2). Compared with the db/db model mice, the serum TG levels were significantly reduced with the treatment of 30, 60, 120 mg/kg TSS and 200 mg/kg metformin (P < 0.001), respectively. The LDL‐C levels were reduced significantly with 120 mg/kg TSS (P < 0.01) and metformin (P < 0.001), respectively. The HDL‐C levels were elevated with 30, 60 and 120 mg/kg TSS and metformin, respectively. However, the increase in HDL‐C levels with the treatment of 30 and 60 mg/kg TSS and metformin were not statistically significant.
Table 2.
Effect of TSS on serum lipid levels in T2DM db/db mice (n = 6)
| Group | TC (mmol/L) | TG (mmol/L) | HDL‐C (mmol/L) | LDL‐C (mmol/L) |
|---|---|---|---|---|
| Normal | 2.506 ± 0.154 | 0.874 ± 0.112 | 1.503 ± 0.051 | 0.229 ± 0.023 |
| Model | 4.203 ± 0.326### | 2.512 ± 0.674### | 2.205 ± 0.078### | 0.306 ± 0.030## |
| Met | 3.847 ± 0.414 | 1.165 ± 0.135*** | 2.608 ± 0.330 | 0.190 ± 0.045*** |
| Saponins‐30 mg/kg | 3.467 ± 0.366* | 1.467 ± 0.106*** | 2.108 ± 0.166 | 0.265 ± 0.051 |
| Saponins‐60 mg/kg | 3.737 ± 0.633 | 1.363 ± 0.127*** | 2.260 ± 0.402 | 0.253 ± 0.035 |
| Saponins‐120 mg/kg | 3.832 ± 0.257 | 1.056 ± 0.156*** | 2.680 ± 0.160* | 0.223 ± 0.020** |
Values are mean ± SEM, n = 6. ## P < 0.01 in contrast to the normal group; ### P < 0.001 in contrast to the normal group; *P < 0.05 in contrast to the model group; **P < 0.01 in contrast to the model group; ***P < 0.001 in contrast to the model group.
3.7. Effects on pathological changes of the liver
The pathological changes in the liver were shown in Figure 5. The livers of db/db model mice showed macrovesicular cell, sinusoid dilation and hepatocellular degeneration, reflecting the hepatic steatosis. The TSS treatments decreased the hepatic steatosis in a dose‐dependent manner.
Figure 5.
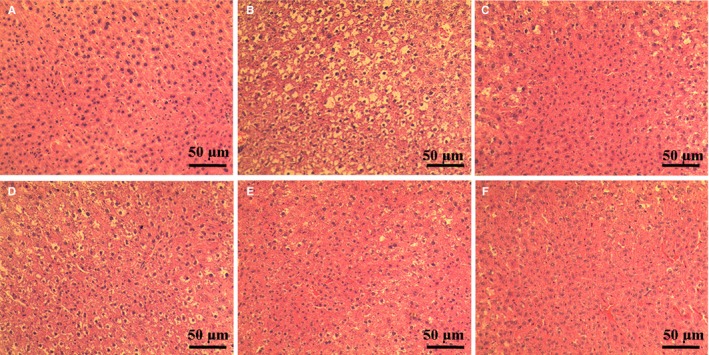
Effects of total saponins on pathological changes in the liver of type 2 diabtetic db/db mice (n = 3) (HE staining, magnification: ×200). (A) The normal mice; (B) type 2 diabetes model db/db group; (C) 200 mg/kg metformin group; (D) 30 mg/kg TSS group; (E) 60 mg/kg TSS group; (F) 120 mg/kg TSS group
3.8. Effects on the insulin receptor substrates‐1/PI3K/AKT pathway in liver tissues
To examine the mechanism in charge of the saponin‐stimulated glucose uptake, the effects of TSS on the insulin receptor substrates (IRS)‐1/PI3K/AKT pathway were evaluated. The Western blotting revealed that TSS elevated the expression of IRS‐1 and stimulated the phosphorylation of PI3K and AKT in a dose‐dependent manner. The administration of 120 mg/kg TSS to the db/db mice resulted in a significant increase in the levels of IRS‐1, p‐PI3K ‐p85α Tyr508 and p‐AKT Ser473 levels in the liver tissue in contrast to those in the db/db mice (P < 0.001) (Figure 6).
3.9. Effects on glucose transporter 4 levels in skeletal muscles
In skeletal muscle, glucose uptake is primarily credited with improved translocation and expression of glucose transporter 4 (GLUT4),22 so GLUT4 expression in skeletal muscle was determined by Western blotting analysis. GLUT4 levels decreased significantly in the db/db mice compared to the normal mice (P < 0.01). Metformin also induced an increase in GLUT4 expression; however, this was not statistically significant. TSS caused a dose‐dependent increase in the expression levels of GLUT4. The 60 mg/kg (P < 0.05) and 120 mg/kg (P < 0.001) TSS treatments could significantly upregulate the expression of GLUT4 protein, respectively (Figure 7).
Figure 7.
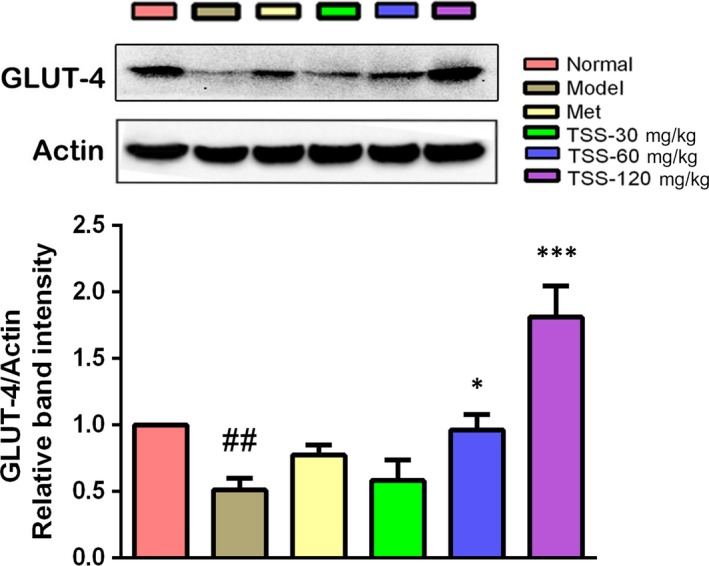
Effects of total saponins on GLUT4 protein levels in muscle tissues of type 2 diabetic db/db mice (n = 3). The protein expressions are shown as the mean grey scale of the matching bands in the bar graph. ## P < 0.01 in contrast to the normal group; *P < 0.05 in contrast to the model group; and ***P < 0.001 in contrast to the model group
3.10. Effects on the AMPK and ACC in liver tissues
Due to the importance of phosphorylated AMPK and ACC in lipid metabolism and the anti‐hyperlipidemia effects of TSS, protein levels of phosphorylated AMPK and ACC were examined by western blotting. Metformin treatment in the db/db mice resulted in a significant increase in p‐AMPK Thr172 levels (P < 0.05). The administration of TSS elevated the p‐AMPK Thr172 levels in a dose‐dependent manner in the db/db mice. Treatments with 120 mg/kg TSS significantly activated the phosphorylation of AMPK Thr172 (P < 0.01). Meanwhile, metformin and 120 mg/kg TSS increased the phosphorylation of ACC Ser79 in the db/db mice, respectively (P < 0.05) (Figure 8).
Figure 8.
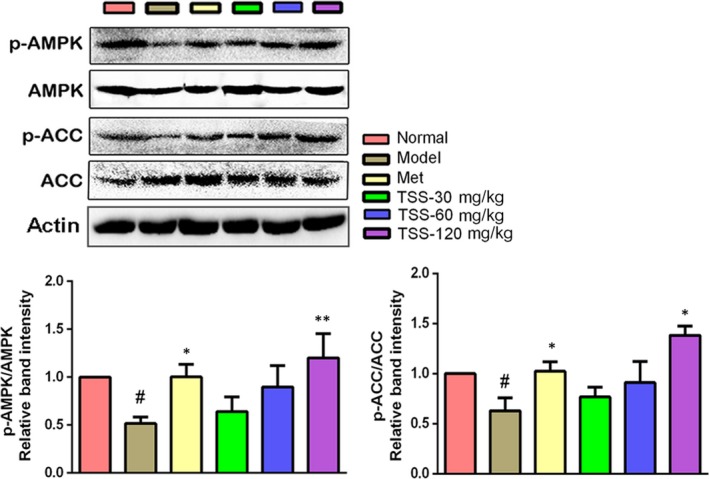
Effects of total saponins on phosphorylated AMPK and ACC in liver tissues of type 2 diabetic db/db mice (n = 3). The protein expressions are shown as the mean grey scale of the matching bands in the bar graph. # P < 0.05 in contrast to the normal group; *P < 0.05 in contrast to the model group; and **P < 0.01 in contrast to the model group
4. DISCUSSION
T2DM is distinguished by hyperglycemia, which is very dangerous for diabetics.23 Hyperglycemia damages the prooxidant/antioxidant balance, lowers antioxidant levels and elevates the levels of free radicals, which then destroy pancreatic β‐cells and induce insulin resistance.24 Our investigation revealed that the TSS significantly decreases FBG, OGTT and ITT levels in the db/db mice (Figure 3), which is in agreement with the results of saponins from other plants. Saponins from the seed of Entada phaseoloides significantly lowered FBG, serum insulin levels and reduced hyperglycemia in T2DM rats.11 In addition, the saponins from the root of Panax notoginseng lowered FBG levels and revealed anti‐hyperglycemic effects on KK‐Ay mice.20, 25 These results demonstrated that saponins could improve glucose homeostasis and insulin resistance. The ability of TSS to reducing hyperglycemia makes TSS an excellent candidate for the treatment of T2DM.
Glucose homeostasis is primarily controlled by the liver and skeletal muscles, where the majority of glucose is desposited as glycogen. The liver is central to glucose homeostasis by the conversion of glucose into glycogen in the postprandial state and by the conversion of glycogenolysis into glucose in the fasting state.26 The glycogen levels in the muscles and liver are an immediate reflection of insulin sensitivity because insulin encourages intracellular glycogen deposition via a coordinated elevation in glucose movement and glycogen synthesis.12 Insulin resistance is distinguished by damage in muscle glucose uptake and the overproduction of glucose in the liver. The liver and muscle glycogen content is significantly lower in diabetic animals,27 which is in proportion to insulin deficiency.28 TSS raised the glycogen levels in the liver and muscles of the db/db mice to a normal level, which could be because of elevated sensitivity to insulin.
PI3K/AKT pathway activation is required to modulate IRS. Of the IRS, IRS‐1 is closely connected to glucose homeostasis in the liver.4 The phosphorylation of IRS‐1 activates PI3K, which causes the production of phosphatidylinositol 3,4,5‐trisphosphate, leading to the activation of AKT.29 AKT is a one of the most critical and flexible protein kinases and it modulates nutrient uptake and metabolism in a cell‐intrinsic fashion via various downstream targets. One of the most pivotal physiological functions of AKT is to precisely control the biological actions of insulin in glucose metabolism.30 AKT activation can prompt glycogen synthesis and improve the rate of glycolysis.31 Western blotting analysis revealed that TSS activated the proteins in the IRS‐1/PI3K/AKT signal pathway in the db/db mice (Figure 6). These findings suggested that the activation of the IRS‐1/PI3K/AKT insulin signalling cascade is in charge of the pharmacological activity of TSS on hepatic glycogen synthesis.
GLUT4, a 12 transmembrane domain protein, plays a pivotal part in glucose homeostasis through its translocation and expression in muscle.22 Insulin induces GLUT4 into the plasma membrane, and this translocation from the intracellular areas seems to fail because of the insulin resistance in T2DM.32 GLUT4 overexpression exclusively in the skeletal muscle increases whole‐body insulin activity and glucose homeostasis.33 Therefore, raising GLUT4 expression in skeletal muscles may be an efficient therapy for T2DM.34 Western blotting analysis revealed that the GLUT4 expression levels in the skeletal muscles of db/db mice was significantly raised by TSS. The activation of AKT causes GLUT4 translocation to the plasma membrane, which in turn enhances elevate glucose uptake.35 The present study has revealed that TSS stimulates the AKT signalling pathway, we concluded that TSS could have a hypoglycemic impact in part because of AKT‐dependent stimulation of glucose uptake into skeletal muscles via GLUT4 expression.
Lipid metabolism disorder is always connected to the development of insulin resistance and T2DM, and hyperlipidemia is the main factor that causes cardiovascular diseases.22 Hypertriglyceridemia, hypercholesterolemia and reduced levels of high‐density lipoprotein are the most frequently diagnosed lipid abnormalities in T2DM.36 Following TSS treatment, the TG and LDL‐C levels in the db/db mice decreased, whilst HDL‐C levels increased (Table 2), suggesting that TSS could control hyperlipidemia and may substantially lower the risk of cardiovascular disease in T2DM patients. TSS‐regulated hyperlipidemia could be related to the regulation of the expression of various genes that are relevant to in lipid metabolism and transport.9
AMPK plays pivotal part in regulating lipid metabolism by controlling downstream ACC.4 The phosphorylation of Thr‐172, the primary stimulatory phosphorylation site of the α subunit, is necessary for AMPK activity. It has been documented that metformin enhances AMPK phosphorylation at Thr‐172,37 which agrees with the results of the present study (Figure 8). Meanwhile, high‐dose TSS induced AMPKα phosphorylation at Thr‐172 and this effect was more intensive than that of metformin (Figure 8). ACC, a required downstream effector in the AMPK signalling pathway, has a crucial part in hepatic lipid metabolism via catalysing the biosynthesis of malonyl‐CoA, which acts as the first substrate for fatty acid biosynthesis and as a strong inhibitor of carnitine palmitoyltransferase I, the rate‐limiting step for mitochondrial fatty acid oxidation.38 AMPK halts ACC via phosphorylation of Ser‐79, which is in agreement with the elevation in ACC phosphorylation at Ser‐79 induced by metformin.37 ACC phosphorylation was also increased by TSS, suggesting a saponin‐activated AMPK signalling pathway.
In conclusion, TSS was obtained by HP‐20 microresin column chromatography and their chemical composition was analysed by LC‐ESI‐MS/MS. A total of 36 triterpene saponins were identified in TSS. Of these, 20 triterpene saponins were determined by contrasting the molecular formulae and fragmentation patterns with documented data in previous reports. All of the identified triterpene saponins belonged to the oleanane‐type. TSS exhibited hypoglycemic activity by lowering blood glucose levels, reducing plasma insulin levels, restoration of insulin response, and stimulating glycogen synthesis in the db/db mice. Additionally, TSS could modulate hyperlipidemia associated with diabetes. The mechanism of the hypoglycemic activity of TSS was established via the regulation of the IRS‐1/PI3K/AKT signalling pathway and GLUT4 expression. The activation of the AMPK/ACC signalling pathway might be responsible for the hypolipidemia activity of TSS (Figure 9). This investigation provides the foundation for the development of saponins based on S. chinensis for the treatment of T2DM.
Figure 9.
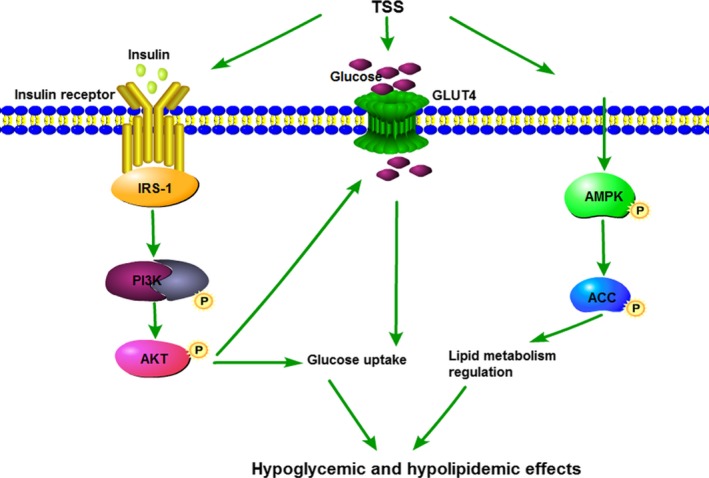
Proposed mechanism of TSS in the improvement in glycaemic and lipid metabolism in db/db mice. TSS stimulates the IRS‐1/PI3K/AKT and AMPK/ACC pathways and GLUT4 protein expression. The arrows indicate the possible targets of TSS
CONFLICT OF INTEREST
The authors confirm that there are no conflicts of interest.
Supporting information
ACKNOWLEDGEMENTS
This work was supported by grants from the National Natural Science Foundation of China (31370379), the National Major New Drugs Innovation and Development program (2017ZX09301060006), and the Special Fund for Basic Scientific Research of Central Colleges, South‐Central University for Nationalities (CZP18004 and CZY18038).
Xu J, Wang S, Feng T, Chen Y, Yang G. Hypoglycemic and hypolipidemic effects of total saponins from Stauntonia chinensis in diabetic db/db mice. J Cell Mol Med. 2018;22:6026–6038. 10.1111/jcmm.13876
Contributor Information
Yu Chen, Email: chenyuwh888@126.com.
Guangzhong Yang, Email: yanggz888@126.com, Email: 1411057263@qq.com.
REFERENCES
- 1. Ali H, Houghton PJ, Soumyanath A. [alpha]‐Amylase inhibitory activity of some Malaysian plants used to treat diabetes; with particular reference to Phyllanthus amarus . J Ethnopharmacol. 2006;107:449‐455. [DOI] [PubMed] [Google Scholar]
- 2. International Diabetes Federation . IDF Diabetes Atlas, 7th edn, 2017. http://www.diabetesatlas.org/. Accessed March 15, 2017. [Google Scholar]
- 3. World Health Organization . The Global Burden of Chronic Diseases, 2016. http://www.who.int/nutrition/topics/2background/en/. Accessed January 11, 2016.
- 4. Nie X, Chen H, Zhang J, et al. Rutaecarpine ameliorates hyperlipidemia and hyperglycemia in fat‐fed, streptozotocin‐treated rats via regulating the IRS‐1/PI3K/Akt and AMPK/ACC2 signalling pathways. Acta Pharmacol Sin. 2016;37:483‐496. [DOI] [PMC free article] [PubMed] [Google Scholar]
- 5. Hung HY, Qian K, Morris‐Natschke SL, et al. Recent discovery of plant‐derived anti‐diabetic natural products. Nat Prod Rep. 2012;29:580‐606. [DOI] [PubMed] [Google Scholar]
- 6. Kwon YI, Apostolidis E, Shetty K, et al. In vitro studies of eggplant (Solanum melongena) phenolics as inhibitors of key enzymes relevant for type 2 diabetes and hypertension. Bioresour Technol. 2008;99:2981‐2988. [DOI] [PubMed] [Google Scholar]
- 7. Ramakrishna R, Sarkar D, Schwarz P, et al. Phenolic linked anti‐hyperglycemic bioactives of barley (Hordeum vulgare L.) cultivars as nutraceuticals targeting type 2 diabetes. Ind Crops Prod. 2017;107:509‐517. [Google Scholar]
- 8. Grabowska K, Podolak I, Galanty A, et al. Two new triterpenoid saponins from the leaves of Impatiens parviflora DC. and their cytotoxic activity. Ind Crops Prod. 2017;96:71‐79. [Google Scholar]
- 9. Elekofehinti OO. Saponins: anti‐diabetic principles from medicinal plants‐A review. Pathophysiology. 2015;22:95‐103. [DOI] [PubMed] [Google Scholar]
- 10. Metwally NS, Mohamed AM, ELSharabasy FS. Chemical constituents of the Egyptian Plant Anabasis articulata (Forssk) Moq and its antidiabetic effects on rats with streptozotocin‐induced diabetic hepatopathy. J Appl Pharm Sci. 2012;2:54‐65. [Google Scholar]
- 11. Zheng T, Shu G, Yang Z, et al. Antidiabetic effect of total saponins from Entada phaseoloides (L.) Merr. in type 2 diabetic rats. J Ethnopharmacol. 2012;139:814‐821. [DOI] [PubMed] [Google Scholar]
- 12. Xiong WT, Gu L, Wang C, et al. Anti‐hyperglycemic and hypolipidemic effects of Cistanche tubulosa in type 2 diabetic db/db mice. J Ethnopharmacol. 2013;150:935‐945. [DOI] [PubMed] [Google Scholar]
- 13. Hemalatha T, Pulavendran S, Balachandran C, et al. Arjunolic axid: a novel phytomedicine with multifunctional therapeutic applications. Indian J Exp Biol. 2010;48:238‐247. [PubMed] [Google Scholar]
- 14. Jiangsu New Medical College . Dictionary of Chinese Material Medica. Shanghai: Shanghai Scientific and Technical Publishers; 1977. [Google Scholar]
- 15. Gao H, Zhao F, Chen GD, et al. Bidesmoside triterpenoid glycosides from Stauntonia chinensis and relationship to anti‐inflammation. Phytochemistry. 2009;70:795‐806. [DOI] [PubMed] [Google Scholar]
- 16. Wang D, Tian J, Zhou GP, et al. Triterpenoid glycosides from Stauntonia chinensis . J Asian Nat Prod Res. 2010;12:150‐156. [DOI] [PubMed] [Google Scholar]
- 17. Hu X, Wang S, Xu J, et al. Triterpenoid saponins from Stauntonia chinensis ameliorate insulin resistance via the AMP‐activated protein kinase and IR/IRS‐1/PI3K/Akt pathways in insulin‐resistant HepG2 cells. Int J Mol Sci. 2014;15:10446‐10458. [DOI] [PMC free article] [PubMed] [Google Scholar]
- 18. Song F, Yang F, Xu D, et al. Flash extraction for total saponins of the rattan from Stauntonia chinensis DC. J South‐Central Univ for National (Nat Sci Ed). 2010;29:29‐32. [Google Scholar]
- 19. Zhang X, Jin M, Tadesse N, et al. Safety investigation on total steroid saponins extracts from Dioscorea zingiberensis C.H. Wright: sub‐acute and chronic toxicity studies on dogs. Regul Toxicol Pharmacol. 2017;91:58‐67. [DOI] [PMC free article] [PubMed] [Google Scholar]
- 20. Chen ZH, Li J, Liu J, et al. Saponins isolated from the root of Panax notoginseng showed significant anti‐diabetic effects in KK‐Ay mice. Am J Chin Med. 2008;36:939‐951. [DOI] [PubMed] [Google Scholar]
- 21. Musi N, Goodyear LJ. Insulin resistance and improvements in signal transduction. Endocrine. 2006;29:73‐80. [DOI] [PubMed] [Google Scholar]
- 22. Xiong H, Zhang S, Zhao Z, et al. Antidiabetic activities of entagenic acid in type 2 diabetic db/db mice and L6 myotubes via AMPK/GLUT4 pathway. J Ethnopharmacol. 2018;30:366‐374. [DOI] [PubMed] [Google Scholar]
- 23. Deng J, Liu Y, Duan Z, et al. Protopanaxadiol and protopanaxatriol‐type saponins ameliorate glucose and lipid metabolism in type 2 diabetes mellitus in high‐fat diet/streptozocin‐induced mice. Front Pharmacol. 2017;8:506. [DOI] [PMC free article] [PubMed] [Google Scholar]
- 24. Aragno M, Mastrocola R, Catalano M, et al. Oxidative stress impairs skeletal muscle repair in diabetic rats. Diabetes. 2004;53:1082‐1088. [DOI] [PubMed] [Google Scholar]
- 25. Yang CY, Wang J, Zhao Y, et al. Anti‐diabetic effects of Panax notoginseng saponins and its major anti‐hyperglycemic components. J Ethnopharmacol. 2010;130:231‐236. [DOI] [PubMed] [Google Scholar]
- 26. Kwon DY, Kim YS, Ryu SY, et al. Platyconic acid, a saponin from Platycodi radix, improves glucose homeostasis by enhancing insulin sensitivity in vitro and in vivo. Eur J Nutr. 2012;51:529‐540. [DOI] [PubMed] [Google Scholar]
- 27. Bollen M, Keppens S, Stalmans W. Specific features of glycogen metabolism in the liver. Biochem J. 1998;336:19‐31. [DOI] [PMC free article] [PubMed] [Google Scholar]
- 28. Stalmans W, Cadefau J, Wera S, et al. New insight into the liver glycogen metabolism by glucose. Biochem Soc Trans. 1997;25:19‐25. [DOI] [PubMed] [Google Scholar]
- 29. Wu J, Chen M, Shi S, et al. Hypoglycemic effect and mechanism of a pectic polysaccharide with hexenuronic acid from the fruits of Ficus pumila L. in C57BL/KsJ db/db mice. Carbohydr Polym. 2017;178:209‐220. [DOI] [PubMed] [Google Scholar]
- 30. Manning BD, Cantley LC. AKT/PKB signaling: navigating downstream. Cell. 2007;129:1261‐1274. [DOI] [PMC free article] [PubMed] [Google Scholar]
- 31. Whiteman EL, Cho H, Birnbaum MJ. Role of Akt/protein kinase B in metabolism. Trends Endocrinol Metab. 2002;13:444‐451. [DOI] [PubMed] [Google Scholar]
- 32. Garvey WT, Maianu L, Zhu JH, et al. Evidence for defects in the trafficking and translocation of GLUT4 glucose transporters in skeletal muscle as a cause of human insulin resistance. J Clin Invest. 1998;101:2377‐2386. [DOI] [PMC free article] [PubMed] [Google Scholar]
- 33. Ren JM, Marshall BA, Mueckler MM, et al. Overexpression of Glut4 protein in muscle increases basal and insulin‐stimulated whole body glucose disposal in conscious mice. J Clin Invest. 1995;95:429‐432. [DOI] [PMC free article] [PubMed] [Google Scholar]
- 34. McGee SL, Hargreaves M. Exercise and skeletal muscle glucose transporter 4 expression: molecular mechanisms. Clin Exp Pharmacol Physiol. 2006;33:395‐399. [DOI] [PubMed] [Google Scholar]
- 35. Takaguri A, Inoue S, Kubo T, et al. AMPK activation by prolonged stimulation with interleukin‐1β contributes to the promotion of GLUT4 translocation in skeletal muscle cells. Cell Biol Int. 2016;40:1204‐1211. [DOI] [PubMed] [Google Scholar]
- 36. Oki JC. Dyslipidemias in patients with diabetes mellitus: classification and risks and benefits of therapy. Pharmacotherapy. 1995;15:317‐370. [PubMed] [Google Scholar]
- 37. Zang M, Zuccollo A, Hou X, et al. AMP‐activated protein kinase is required for the lipid‐lowering effect of metformin in insulin‐resistant human HepG2 cells. J Biol Chem. 2004;279:47898‐47905. [DOI] [PubMed] [Google Scholar]
- 38. Abu‐Elheiga L, Matzuk MM, Abo‐Hashema KA, et al. Continuous fatty acid oxidation and reduced fat storage in mice lacking acetyl‐CoA carboxylase 2. Science. 2001;291:2613‐2616. [DOI] [PubMed] [Google Scholar]
- 39. Gao H. Study on the Analgesic and Anti‐Inflammatory Components of the Traditional Chinese Medicine “Stauntonia chinensis” and the Cytotoxic Components of Mangrove Fungus “Aspergillus awamori”. Shenyang: Shenyang Pharmaceutical University; 2005. [Google Scholar]
- 40. Gao H, Zhang X, Wang NL, et al. Triterpenoid saponins from Stauntonia chinensis . J Asian Nat Prod Res. 2007;9:175‐182. [DOI] [PubMed] [Google Scholar]
- 41. Ling Y, Zhang Q, Zhu DD, et al. Identification and characterization of the major chemical constituents in Fructus Akebiae by high‐performance liquid chromatography coupled with electrospray ionization‐quadrupole‐time‐of‐flight mass spectrometry. J Chromatogr Sci. 2016;54:148‐157. [DOI] [PubMed] [Google Scholar]
- 42. Gao H, Wang Z, Yang L, et al. Five new bidesmoside triterpenoid saponins from Stauntonia chinensis . Magn Reson Chem. 2008;46:630‐637. [DOI] [PubMed] [Google Scholar]
- 43. Chen Y, Yang F, Wang S, et al. Triterpenoid saponins from Stauntonia chinensis . Bull Korean Chem Soc. 2014;35:1212‐1214. [Google Scholar]
- 44. Mimaki Y, Kuroda M, Yokosuka A, et al. Triterpenes and triterpene saponins from the stems of Akebia trifoliata . Chem Pharm Bull. 2003;51:960‐965. [DOI] [PubMed] [Google Scholar]
Associated Data
This section collects any data citations, data availability statements, or supplementary materials included in this article.
Supplementary Materials


