While research into the biology of animal behavior has primarily focused on the central nervous system, cues from peripheral tissues and the environment have been implicated in brain development and function1. Emerging data suggest bidirectional communication between the gut and the brain affects behaviors including anxiety, cognition, nociception, and social interaction, among others1–9. Coordinated locomotor behavior is critical for the survival and propagation of animals, and is regulated by internal and external sensory inputs10,11. However, little is known regarding influences by the gut microbiome on host locomotion, or the molecular and cellular mechanisms involved. Here we report that germ-free status or antibiotic treatment result in hyperactive locomotor behavior in Drosophila melanogaster. Increased walking speed and daily activity found in the absence of a gut microbiome are rescued by mono-colonization with specific bacteria, including the fly commensal Lactobacillus brevis. The bacterial enzyme xylose isomerase (Xi) from L. brevis is sufficient to recapitulate the locomotor effects of microbial colonization via modulation of sugar metabolism in flies. Notably, we discover that thermogenetic activation of octopaminergic neurons or exogenous administration of octopamine, the invertebrate counterpart of noradrenaline, abrogates Xi-induced effects on Drosophila locomotion. These findings reveal a previously unappreciated role for the gut microbiome in modulating locomotion, and identify octopaminergic neurons as mediators of peripheral microbial cues that regulate motor behavior in animals.
Coordinated locomotion is required for fundamental activities of life such as foraging, social interaction, and mating, and involves the integration of multiple contextual factors including the internal state of the animal and external sensory stimuli10,11. The intestine represents a major conduit for exposure to environmental signals that influence host physiology, and is connected to the brain through both neuronal and humoral pathways. Recently, seminal studies have uncovered that the intestinal microbiome regulates developmental and functional features of the nervous system1,2, though gut bacterial effects on the neuromodulators and neuronal circuits involved in locomotion remain poorly understood. Since central mechanisms of locomotion, including sensory feedback and neuronal circuits integrating these modalities, are shared in lineages spanning arthropods and vertebrates11–13, we employed the fruit fly Drosophila melanogaster to explore host-microbiome interactions that contribute to locomotor behavior. Locomotion was examined in the presence (conventional; Conv) and absence (axenic; Ax) of commensal bacteria. In comparison to conventionally-reared animals, axenic female adult flies exhibit increased walking speed and daily activity (Fig. 1a – b, and 1g). Drosophila locomotion is characterized by a pattern of intermittent periods of pauses and activity bouts11,14, during the latter of which the average speed of the fly is above a set threshold of 0.25 mm/second. An increased average speed may be related to changes in temporal patterns, including the number and/or duration of walking bouts14. We discovered that axenic flies display an increased average walking bout length in addition to a decreased average pause length, while remaining indistinguishable in the number of bouts compared to animals harboring a microbial community (Fig. 1c – f). These data reveal that the microbiota modulates walking speed and temporal patterns of locomotion in Drosophila.
Fig. 1|. Select gut bacteria modulate locomotor behavior in flies.
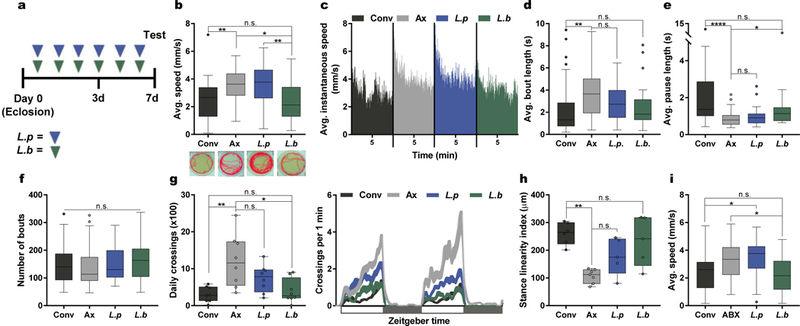
a, Experimental design unless otherwise stated. Briefly, female flies were either left untreated or administered with a bacterial culture or bacterial-derived factors through application to the fly media (40 μL) daily for 6 days. b – f, Analysis of average speed (b), average instantaneous speed (c), average bout length (d), average pause length (e), and number of bouts (f) of conventional (Conv), axenic (Ax), and L. plantarum (L.p) or L. brevis (L.b) mono-associated flies over a 10-min. period. Traces below in (b) are representative individuals from each group and dashes below in (c) represent the 5-min. mark for each group. (b) Conv, n = 36; Ax, n = 36; L.p, n = 35; L.b, n = 36. (c) Conv, n = 23; Ax, n = 35; L.p, n = 23; L.b, n = 21. (d – f) Conv, n = 32; Ax, n = 36; L.p, n = 22; L.b, n = 20. g, Daily activity of virgin female OregonR flies over a 2-day light-dark cycle period each lasting 12 hrs., starting at time 0. n = 8/condition. h, Stance linearity index calculated for each group. Conv, n = 6; Ax, n = 7; L.p, n = 5; L.b, n = 5. i, Average speed of Conv and Conv flies treated with antibiotics (ABX) for 3 days, following which flies were either left naïve or colonized with L.p or L.b. Conv, n = 25; ABX, n = 29; L.p, n = 24; L.b, n = 35. Box-and-whisker plots show median and interquartile range (IQR). * P < 0.05, ** P < 0.01, **** P < 0.0001. Specific P values are in the Supplementary Material. Kruskal-Wallis and Dunn’s post-hoc tests were used for statistical analysis.
The microbial community of Drosophila melanogaster contains 5 – 20 bacterial species15,16. In laboratory-raised flies, two of the dominant species are Lactobacillus brevis and Lactobacillus plantarum15. Specific bacteria in this community affect distinct features of Drosophila physiology, and even closely related microbial taxa can exhibit unique biological influences on the host15,17,18. Accordingly, we examined whether locomotor performance was impacted differentially by individual bacterial species. Despite similar levels of colonization (Extended Data Fig. 1a), mono-association with L. brevis, but not L. plantarum, starting at eclosion is sufficient to correct speed and daily activity deficits in axenic flies (Fig. 1a– b, 1g, and Extended Data Fig. 1b – e). Varying the strain of L. brevis or host diet did not alter bacterial influences on host speed (Extended Data Fig. 1c – e), and L. brevis is able to largely restore temporal patterns of locomotion (Fig. 1c – f and Extended Data Fig. 1f). Detailed gait analysis reveals that L. brevis-associated flies display comparable locomotor coordination to that of conventionally-reared flies (Fig. 1h and Extended Data Fig. 1g). Further, axenic flies co-colonized with a 1:1 mixture of L. brevis and L. plantarum display similar changes in speed to flies mono-associated with L. brevis (Extended Data Fig. 1h).
To investigate whether the effects of microbial exposure are dependent on host developmental stage, we mono-colonized flies at 3 – 5 days post-eclosion (Extended Data Fig. 2a), a time point in which the development of the GI tract and remodeling of the nervous system are complete19–21. Colonization with L. brevis in fully developed animals decreases locomotor speed and average walking bout length to levels similar in flies treated immediately following eclosion (Extended Data Fig. 2b – e). Changes in locomotion are likely independent of bacterial effects on host development, as conventionally-reared flies treated after eclosion with broad spectrum antibiotics exhibit similar walking speeds to animals born under axenic conditions (Extended Data Fig. 2f). Administration of antibiotics increases fly locomotion in two different wild-type lines (Extended Data Fig. 2g). Furthermore, colonization with L. brevis, but not L. plantarum, after the removal of antibiotics reduces locomotor behavior to levels similar to conventional flies (Fig. 1i and Extended Data Fig. 2h – l). From these data, we conclude that locomotion is modulated by select bacterial species of the Drosophila microbiome, and is mediated by active signaling, rather than developmental influences.
Gut bacteria secrete molecular products that regulate aspects of host physiology, including immunity and feeding behavior22,23. To explore how microbes influence locomotion, we administered either cell-free supernatant (CFS) harvested from bacterial cultures or heat-killed bacteria to axenic flies. CFS alone from L. brevis (L.b CFS) reduces hyperactivity in axenic flies, while heat-killing bacteria ablates modulation of locomotion (Fig. 2a and Extended Data Fig. 3a – e), demonstrating a requirement for metabolically active L. brevis. Previous studies have revealed that L. brevis produces uracil18, a molecule that affects the host immune response and may impact locomotion22. However, administration of physiologic levels of uracil to axenic flies did not alter walking speed (Extended Data Fig. 3f). We next explored whether immunity or feeding behavior impact microbial-mediated locomotion. Depletion of the microbiome in Immune Deficiency (IMD) and Toll knockout flies using antibiotics results in similar increases in walking speed compared to wild-type flies (Extended Data Fig. 4a – b). There are no differences in the expression of anti-microbial peptides or the dual oxidase gene, Duox, in L.b CFS-treated axenic flies (Extended Data Fig. 4c). Moreover, while food intake may be influenced by bacterial species and can inhibit locomotor behavior23–25, there is no significant change in the amount of food ingested by L.b CFS-treated flies compared to controls (Extended Data Fig. 4d – e).
Fig. 2|. Xylose isomerase (Xi) from L. brevis alters host locomotion.
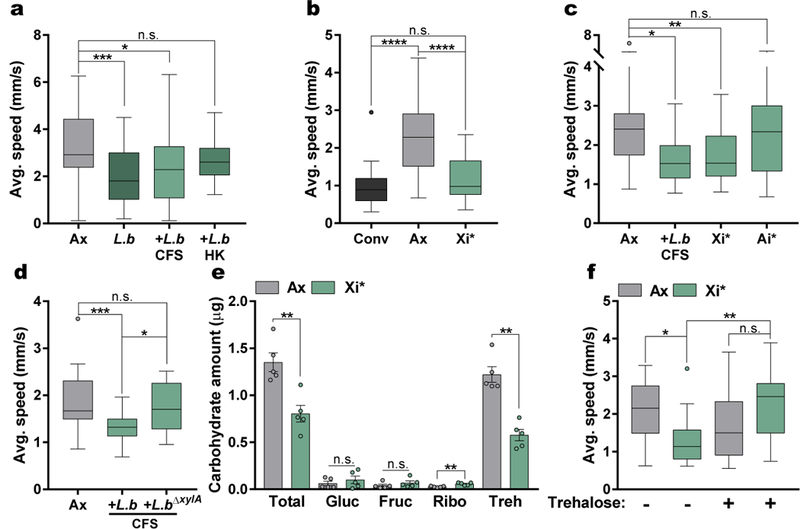
a – c, Average speed of Conv, Ax, L.b mono-associated, and Ax flies treated with either cell-free supernatant (CFS) from L.b, heat-killed (HK) L.b, His-tagged xylose isomerase from L.b (Xi*, 100 μg/mL), or His-tagged L-arabinose isomerase from L.b (Ai*,100 μg/mL). (a) Ax, n = 57; L.b, n = 42; L.b CFS, n = 36; L.b HK, n = 24. (b) Conv, n = 17; Ax, n = 45; Xi*, n = 29. (c) Ax, n = 31; L.b CFS, n = 12; Xi*, n = 28; Ai*, n = 13. d, Average speed of Ax and Ax flies treated with CFS from either WT L.b or xylA mutant L.b (L.b∆xylA) bacterial strains. Ax, n = 28; L.b CFS, n = 29; L.b∆xylA CFS, n = 18. e, Carbohydrate levels in Ax and Xi*-treated flies. Bars represent mean +/− S.E.M. n = 5 samples/condition. f, Average speed of Ax flies and Xi*-treated Ax flies either left untreated or supplemented with trehalose (10 mg/mL) for 3 days before testing. Ax, n = 16; Xi*, n = 18; Ax+Treh, n = 16; Xi*+Treh, n = 17. Box-and-whisker plots show median and IQR. * P < 0.05, ** P < 0.01, *** P < 0.001, **** P < 0.0001. Specific P values are in the Supplementary Material. Kruskal-Wallis and Dunn’s (a – d and f) or Mann-Whitney U (e) post-hoc tests were used for statistical analysis. Gluc, glucose; Fruc, fructose; Ribo, ribose; Treh, trehalose.
Bacterial metabolism of amino acids and carbohydrates is associated with changes in host behavior6,8; however, it is not known whether bacterial metabolic enzymes influence host locomotion. Employing biochemical analysis of L.b CFS and comparative functional analysis of bacterial strains26–28, we determined that bacterial locomotor effects are mediated via proteinaceous molecule(s) present in select bacteria, including L. brevis and E. coli (Extended Data Fig. 5a – e). Subsequently, a screen of E. coli strains containing single gene mutations related to amino acid and carbohydrate metabolism identified xylose isomerase (Xi) as a candidate factor modulating locomotor behavior (Extended Data Fig. 5f). Xi is an enzyme that catalyzes the reversible isomerization of certain sugars, including the conversion of D-glucose to D-fructose29, and is present only in L. brevis and E. coli of the bacterial strains tested (Extended Data Fig. 5e). Administration of His-tagged Xi from L. brevis (Xi*) reduces locomotor behavior in axenic flies to levels similar to L.b CFS and conventional flies (Fig. 2b – c and Extended Data Fig. 5g – h). The addition of His-tagged L-arabinose isomerase (Ai*), an enzyme that is not differentially expressed among the bacteria tested, is not sufficient to influence host speed in axenic flies (Fig. 2c). Furthermore, we generated a chromosomal deletion of the xylose isomerase gene xylA in L. brevis, and demonstrate the mutant strain lacks the ability to modulate host speed and daily activity (Fig. 2d and Extended Data Fig. 5g). No changes in survival or intestinal cellular apoptosis occur at the time of motor testing (Extended Data Fig. 5i – j). Additionally, Xi*-treatment did not significantly alter sleep in axenic flies (Extended Data Fig. 6). Neither the addition of predicted products of Xi (D-fructose, D-glucose, D-xylose, and D-xylulose) alone, nor Xi inactivated by EDTA treatment29, reduces walking speed in axenic flies (Extended Data Fig. 7a – c). We next sought to explore Xi activity through carbohydrate analysis of whole flies, which revealed flies given Xi* exhibit increased ribose and reduced trehalose levels compared to axenic controls (Fig. 2e), with no differences in these sugars in the fly media (Extended Data Fig. 7d). While EDTA-treated Xi* did not significantly alter trehalose levels, these flies still display heightened levels of ribose compared to axenic controls (Extended Data Fig. 7e). Additionally, similar to previous findings30, conventional and L. brevis-colonized flies show reduced levels of trehalose compared to axenic groups (Extended Data Figures 7f – g). Administration of trehalose alone reverses microbial effects on host speed, while supplementation with arabinose or ribose does not (Fig. 2f and Extended Data Fig. 7h – k). Collectively, these results demonstrate that xylose isomerase from L. brevis is sufficient to control locomotion in Drosophila, likely via modulation of key carbohydrates, such as trehalose.
Specific neuronal pathways regulate complex behaviors in animals31–33, and can be modulated by peripheral inputs, including intestinal and circulating carbohydrate levels34. To explore the involvement of various neuronal subsets in bacterial-induced motor behavior, we used the thermosensitive cation channel Drosophila TRPA1 (dTRPA1) to activate neuronal populations previously implicated in locomotion35, via a repertoire of GAL4-driver lines. In combination with UAS-dTrpA1 at the activity-inducing temperature (27˚C), we observe that activation of only two GAL4 lines that both label octopaminergic neurons, tyrosine decarboxylase (Tdc2) and tyramine beta-hydroxylase (Tβh), override L. brevis modulation of locomotion (Fig. 3a and Extended Data Fig. 8). Accordingly, activation of Tdc-expressing cells abrogated the effects of Xi*-treatment and differences between conventional and antibiotic-treated groups (Fig. 3b – c and Extended Data Fig. 9). The ability of L. brevis to decrease locomotion, however, is not changed by the activation of dopaminergic, serotoninergic, GABAergic, or cholinergic neurons (Fig 3a and Extended Data Fig. 8e – h). The administration of octopamine to conventional, Xi*-, or L.b CFS-treated flies increases host walking speed to levels similar to that of axenic flies (Fig. 3d – e and Extended Data Fig. 10a). Further, Tdc2 and Tβh transcript levels are reduced in RNA extracted from the heads of Xi*- and L.b CFS-treated flies (Extended Data Figure 10b – c). As Tdc and Tβh are important for octopamine synthesis, these results further link octopamine to Xi-induced locomotor effects. Octopamine and tyramine are involved in multiple aspects of host physiology, including metabolism and behavior, and display opposite roles in regulating certain motor behaviors36–44. While administration of tyramine did not influence walking speed in Xi* and L.b CFS conditions (Fig. 3e and Extended Data Fig. 10d), antibiotic-treated flies carrying a null allele for Tdc (Tdc2RO54) no longer display differences in locomotion upon supplementation with Xi* (Fig. 3f), suggesting an indirect role for tyramine. Limiting the expression of a transgene for diphtheria toxin (DTI) to octopaminergic and tyraminergic neurons outside of the ventral nerve cord39,45 results in equivalent average speeds between antibiotic and Xi*-treated flies (Extended Data Fig. 10e), implicating the involvement of neurons in the supraesophageal and the subesophageal zones in microbial effects on motor behavior. Octopamine signaling is necessary for locomotor changes, as axenic flies administered with mianserin, an octopamine receptor antagonist, and antibiotic-treated flies carrying a null allele for Tβh (TβHM18) or expressing Tβh RNAi no longer respond to Xi* or L.b CFS treatment (Fig. 3g and Extended Data Fig. 10f – h). Similar results are also found under conventional conditions compared to antibiotic-treated groups (Extended Data Fig. 10i – k). Collectively, we conclude that defined products of the microbiome, and specifically Xi, negatively regulate octopaminergic pathways to control Drosophila locomotion (Extended Data Fig. 10l).
Fig. 3|. Octopamine mediates xylose isomerase-induced changes in locomotion.
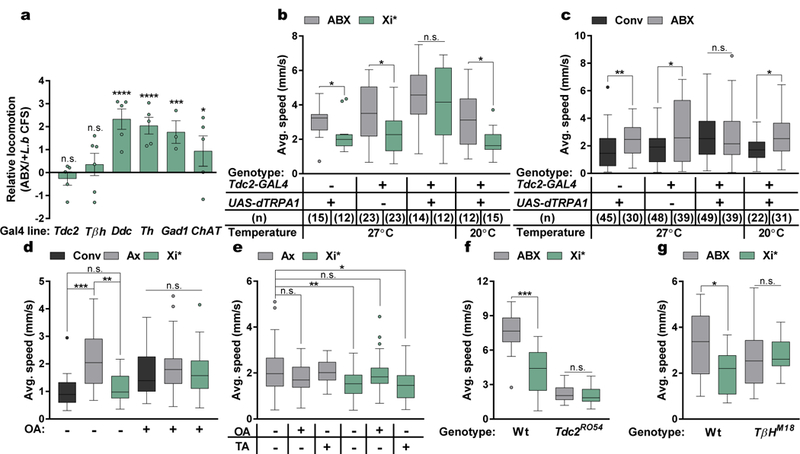
a, Difference in average speed for each GAL4 line crossed with UAS-dTRPA1 at 27˚C. Each point denotes an independent trial. Bars represent mean +/− S.E.M. Tdc2/Ddc/Th/ChAT, n = 5; Tβh, n = 6; Gad1, n = 3. b – c, Average speed with or without thermogenetic activation. d – e, Average speed of flies left untreated or supplemented with octopamine (OA) or tyramine (TA) daily for 3 days. (d) Conv, n = 13; Ax, n = 33; Xi*, n = 21; Conv+OA, n = 29; Ax+OA, n = 27; Xi*+OA, n = 32. (e) Ax, n = 58; Ax+OA, n = 13; Ax+TA, n = 10; Xi*, n = 54; Xi*+OA, n = 46; Xi*+TA, n = 27. f – g, Average speed of antibiotic-treated wild-type (Wt), Tdc2 null mutants (Tdc2RO54), or Tβh null mutants (TβHM18) left untreated (ABX) or administered with Xi* daily for 3 days. (f) Wt (w+): ABX, n = 12; Xi*, n = 17; TdcRO54: ABX, n = 19; Xi*, n = 17. (g) Wt (Canton-S): n = 15; TβHM18: ABX, n = 11; Xi*, n = 12. Box-and-whisker plots show median and IQR. * P < 0.05, ** P < 0.01, *** P < 0.001, **** P < 0.0001. Specific P values are in the Supplementary Material. Mann-Whitney U post-hoc tests following a Two-way ANOVA (a – c), Kruskal-Wallis and Dunn’s post-hoc tests (d – e), or Mann-Whitney U post-hoc tests (f – g) were used for statistical analysis. Tdc, Tyrosine decarboxylase; Tβh, Tyramine beta-hydroxlyase; Ddc, DOPA decarboxylase; Th, Tyrosine hydroxylase; Gad1, Glutamate decarboxylase 1; ChAT, Choline acetyltransferase.
The microbiome influences neurodevelopment, regulates behavior, and contributes to various neurologic and neuropsychiatric disorders. Herein, we demonstrate that gut bacteria modulate locomotion in female Drosophila. The depletion of the gut microbiota increases host exploratory behavior, and the commensal bacterium L. brevis is sufficient to regulate locomotion. In addition, we establish that xylose isomerase from L. brevis corrects the locomotor phenotypes of axenic flies, a process that is mediated by trehalose and octopamine signaling in the host. However, further work is needed to identify the exact neurons and neuronal mechanisms involved, including potential changes in firing patterns. It would also be important to clarify the sex-specific aspects of these microbial effects on locomotion30,46. It is intriguing that germ-free mice display hyperactivity similar to axenic Drosophila, and specific bacteria have been shown to decrease locomotor activity in mice 1,47,48, although the neuronal pathways implicated in mammalian systems have yet to be identified. The mammalian counterpart of octopamine, noradrenaline, modulates locomotion31,49, potentially implicating adrenergic circuitry as a conserved pathway that is co-opted by the microbiome in flies and mammals. In addition to motor behavior, octopamine signaling is linked to sugar metabolism, and trehalose serves as a major energy source for Drosophila36. Xylose isomerase may therefore facilitate adrenergic regulation of host physiology through orchestrating metabolic homeostasis, such as via altering internal energy storage, although additional work is needed to define how the microbiome mediates interactions between sugar metabolism and octopamine signaling. The inextricable link between metabolic state and locomotion suggests that peripheral influences on metabolism may signal via neuronal pathways to modulate physical activity. As animals have become metabolically intertwined with their microbiomes, perhaps it is not surprising that a fundamental trait such as locomotion is influenced by host-microbial symbiosis.
METHODS
Fly Stocks and Rearing.
We obtained Canton-S (#64349), Imd−/− (#55711), Ti−/− (#30652), UAS-dTrpA1 (#26264), Tdc2-GAL4 (#52243), Tβh-GAL4 (#48332), Th-GAL4 (#8488), Ddc-GAL4 (#7009), Gad1-GAL4 (#51630), ChAT-GAL4 (#60317), Elav-GAL4 (#46655), UAS-TβhRNAi (#27667), UAS-DTI (#25039), and pBDPG4U-GAL4 (#68384) lines from Bloomington Drosophila Stock Center at Indiana University. Other fly stocks used were OregonR (kindly provided by A. A. Aravin and K. Fejes Tόth), TβHM18 (kindly provided by M. H. Dickinson)50, Tdc2R054, and tsh-GAL80 (both kindly provided by D. J. Anderson)51,52. To minimize the effect of genetic background on behaviors, mutant fly lines were outcrossed for at least three generations onto a wild-type background.
Flies were cultured at 25˚C and 60% humidity on a 12-hr. light:12-hr. dark cycle and kept in vials containing fresh fly media made at California Institute of Technology consisting of cornmeal, yeast, molasses, agar, p-hydroxy-benzoic acid methyl ester. Other dietary compositions used were created through altering this standard diet or the Nutri-Fly “German Food” Formula (Genesee Scientific) and were calculated using previously published nutritional data53. Axenic flies were generated using standard methods18,54–58. Briefly, embryos from conventional flies were washed in bleach, ethanol, and sterile PBS before being cultivated on fresh irradiated media54. Axenic stocks were maintained through the application of an irradiated diet supplemented with antibiotics (500 μg/ml ampicillin, Putney; 50 μg/ml tetracycline, Sigma; 200 μg/ml rifamycin, Sigma) for at least one generation. For experiments, virgin female flies were collected shortly after eclosion and placed at random into vials (10 – 15 flies per vial) containing irradiated media without antibiotics. Vials were changed every 3 – 4 days using sterile methods. The antibiotic supplemented diet was applied to conventional flies shortly after eclosion to generate antibiotic-treated (ABX) flies. Both antibiotic-treated and axenic flies were tested for contaminants through plating animal lysates on Man, Rogosa, and Sharpe (MRS, BD Biosciences), Mannitol (25 g/L Mannitol, Sigma; 5 g/L Yeast extract, BD Biosciences; 3 g/L Peptone, BD Biosciences), and Luria-Bertani (LB, BD Biosciences) nutrient agar plates.
Bacterial Strains.
Lactobacillus brevis EW, Lactobacillus plantarum WJL, and Acetobacter pomorum were obtained from laboratory-reared flies in the laboratory of Won-Jae Lee (Seoul National University)18,56,58. Lactobacillus brevisBb14 (ATCC, #14869) and Lactobacillus brevisP−2 (ATCC, #27305) were isolated from human feces and fermented beverages, respectively. Escherichia coli K12 (CGSC, #7636) was grown in LB broth and Escherichia coli ∆tyrA (CGSC, #9131), Escherichia coli ∆trpC (CGSC, #10049), Escherichia coli ∆manX (CGSC, #9511), Escherichia coli ∆treA (CGSC, #9090), and Escherichia coli ∆xylA (CGSC, #10610)28 were grown in LB broth supplemented with kanamycin (50 μg/mL). Lactobacillus brevis and Lactobacillus plantarum cultures were grown overnight in a standing 37˚C incubator in MRS broth (BD Biosciences). For mono-associations, fresh stationary phase bacterial cultures (OD600 = 1.0, 40 μL) were added directly to fly vials. Associations with two bacteria were performed in a 1:1 mixture. For heat-killed experiments, fresh cultures of Lactobacillus brevis (OD600 = 1.0) were washed 3 times in sterile PBS, incubated at 100˚C for 30 min., and cooled to room temperature before administering to flies. All treatments were supplied daily through application to the fly media (40 μL) for 6 days following eclosion.
Bacterial Supernatant Preparations.
Cell-free supernatants (CFS) of specified bacterial strains were harvested from bacterial cultures (OD600 = 1.0) by centrifuging at 13,000 × g for 10 min. and subsequent filtration through a 0.22-μm sterile filter (Millipore). CFS was dialyzed in MilliQ water with a 3.5 kDa membrane (Thermo Scientific) overnight at 4˚C to generate L.b CFS and L.p CFS samples. Each of these treatments were supplied daily through application to the fly media (40 μL) for 6 days following eclosion.
Heat and Enzymatic Treatment of L.b CFS.
For heat-inactivation experiments, freshly prepared L.b CFS samples were incubated at 100˚C for 30 min. and cooled to room temperature before administering to flies. For proteinase K (PK) and trypsin (Typ) treatment, overnight dialysis of CFS was performed in Tris-HCl (pH 8 for PK and pH 8.5 for Typ) after which samples were treated with either PK (100 μg/mL, Invitrogen) or Typ (0.05 μg/mL, Sigma) at 37˚C for 24 or 7 hrs., respectively. A proteinase inhibitor cocktail (Sigma) was added to stop the reaction and subsequently removed through overnight dialysis (Thermo Scientific) at 4˚C in MilliQ water. Aliquots of the samples were run on a 4–20% Tris-glycine gel (Invitrogen) to confirm protein cleavage. Controls followed the same protocol except for the addition of proteinase K or trypsin. For amylase digests, 20 μL of 100 mU/mL amylase (Sigma) was added to either freshly prepared L.b CFS or a PBS control for 30 min. and inhibited through lowering the pH to 4.5. Each of these treatments were supplied daily through application to the fly media (40 μL) for 6 days following eclosion.
Production of His-tagged proteins (Xi* and Ai*)
An expression plasmid for the production of His-tagged xylose isomerase from L.b, here termed as Xi*, was constructed by amplification of its gene and cloning the resulting PCR product in the pQE30 cloning vector (Qiagen) using SLIC ligation. The following primer sequences were used for the construct: 5’-CGCATCACCATCACCATCACGGATCTTACTTGCTCAACGTATCGATGATGTAA-3’ and 5’-GGGGTACCGAGCTCGCATGCGGATCATGACTGAAGAATACTGGAAAGGC-3’. Conformation of the resulting plasmid was verified and transformed into E. coli (Turbo, NEB). This strain was then grown in LB containing ampicillin (100 μg/mL) and chloramphenicol (25 μg/mL) with shaking at 220 rpm at 37˚C for 1 hr. before the addition of 0.1 mM IPTG. After 4 hrs. of shaking at 220 rpm at 37˚C, cells were pelleted and lysed using lysozyme (Sigma) and bead beating with matrix B beads (MP Biomedicals) for 45 sec. Supernatant was collected after centrifugation and the Xi* protein purified through metal affinity purification under native conditions using HisPur™ Ni-NTA Spin Columns (Thermo Scientific). Protein purification was verified through western blot using an Anti-6X His tag® antibody (Abcam) and quantified using a Pierce BCA Protein Assay kit (Thermo Scientific) after which protein was stored at −20˚C. Expression and purification of His-tagged L-arabinose isomerase from L.b, here termed as Ai*, was performed under the exact same conditions and the following primer sequences were used for the construct: 5’-GGGGTACCGAGCTCGCATGCGGATCATGTTATCAGTTCCAGATTATGAATTTTGG-3’ and 5’-CGCATCACCATCACCATCACGGATCCTTACTTGATGAACGCCTTTGTCAT-3’. For EDTA treatment29, purified Xi* was combined with 5 mM EDTA for 44 hrs. at 4°C and subsequently dialyzed prior to administering to flies through application to the fly media (40 μL) for 6 days following eclosion.
Generation of xylA deletion mutant (∆xylA)
~1-kb DNA segments flanking the region to be deleted were PCR amplified using the following primers: 5’-ATTCCAATACTACCACTAGCAACGACATCCGTAAAGT-3’; 5’-AATTCGAGCTCGGTACCCGGGGATCCACAATCAGAATTGATCGCGGCAAC-3’; 5’-TCGTTGCTAGTGGTAGTATTGGAATCCTAAACCAGATTTCTTATCTTGATG-3’; 5’-GCCTGCAGGTCGACTCTAGAGGATCCCGCAAGTCTAGTGCGGCT-3’. The forward primers were designed using to be partially complementary at their 5’ ends by 25 bp. The fused PCR product was cloned into the BamHI site of the Lactobacilli vector pGID023 and mobilized into L.b. Colonies selected for the erythromycin (Erm) resistance, indicating integration of the vector into the host chromosome were re-plated onto MRS+Erm and subsequently passaged over 5 days and plated onto MRS+Erm. Colonies selected for Erm resistance were passaged again in MRS alone over 3 days and plated on MRS. Resulting colonies were plated in replica on MRS and MRS+Erm. Erm sensitive colonies were screened by PCR to distinguish wild-type revertants from strains with the desired mutation.
Drug treatments.
Axenic flies were either left untreated or administered with L.b CFS or Xi* for 3 days after eclosion. After switching to new irradiated fly media, groups of axenic flies were treated through application to the fly media (40 μL) with octopamine (OA, 10 mg/mL, Sigma), tyramine (TA, 10 mg/mL, Sigma), L-dopa (1 mg/mL, Sigma), or mianserin (2 mg/mL) every day for 3 days before testing, similar to previously published methods33,37.
Bacterial Load Quantification.
Intestines dissected from surface sterilized 7-day-old adult female flies were homogenized in sterile PBS with ~100 μl matrix D beads using a bead beater. Lysate dilutions in PBS were plated on MRS agar plates and enumerated after 24 hrs. at 37˚C.
Locomotion Assays.
Locomotor behavior was assayed through three previously established methods: the Drosophila Activity Monitoring System (DAMS, Trikinetics)59,60, video-assisted tracking61–63, and gait analysis64.
Activity measurements.
7-day-old individual female flies were cooled on ice for 1 min. and transferred into individual vials (25 × 95 mm) containing standard irradiated media. Tubes were then inserted and secured into Drosophila activity monitors (DAMS, Trikinetics) and kept in a fly incubator held at 25˚C. Flies were allowed to acclimate to the new environment for 1 day before testing and midline crossing was sampled every min. Average daily activity was calculated from the 2 days tested and actograms were generated using ActogramJ60. Sleep was defined as a 5 min. bout of inactivity as previously described65.
Video-assisted tracking.
Individual female flies were cooled on ice for 1 min. before being introduced under sterile conditions into autoclaved arenas (3.5 cm diameter wells), which allowed free movement but restricted flight. After a 1 hr. acclimation period, arenas were placed onto a light box and recorded from above for a period of 10 min. at 30 frames per sec. All testing took place between ZT 0 and ZT 3 (ZT, Zeitgeber time; lights are turned on at ZT 0 and turned off at ZT 12) and both acclimation and testing occurred at 25˚C unless otherwise stated. Videos were processed using Ethovision software or the Caltech FlyTracker (http://www.vision.caltech.edu/Tools/FlyTracker/).
Bout analysis was performed using custom python scripts (available upon request). The velocity curve was smoothed from the acquired video at 30 frames per sec. using a 15 sec. moving average window. A minimum walking speed of 0.25 mm/s was given below which flies were moving but not walking (‘pause bouts’) and above which they were designated as walking (‘walking bouts’). Lengths were measured as time between bout onset and offset.
Gait analysis.
Experiments used an internally illuminated glass surface with frustrated total internal refraction (fTIR) to mark the flies’ contact with the glass64. The movement of the flies and their contact was recorded with a high-framerate camera, and videos were quantified using the FlyWalker software package. For further details of the parameters see 64. All groups consisted of 7-day-old female flies and were tested at room temperature.
Feeding Assays.
Female flies were collected at the same time as described for Locomotor Assays. Flies were transferred regularly onto fresh food until day 7, upon which the flies were starved for 2 hrs. and subsequently transferred for 30 min. to an irradiated standard fly media dyed with FD&C Blue no. 1 (Sigma) at a final concentration of 0.5 g dye per 100 g food. Flies were allowed to feed on the food (3–4 biological replicates and 7 flies per replicate) at 25˚C after which they were decapitated and their bodies collected. Each replicate was homogenized in 150 μL of PBS/0.05% Triton X-100 and centrifuged at 5,000 × g for 1 min. to remove debris. Absorbance for all groups was measured together at 630 nm and the amount of food consumed was estimated from a standard curve of the same dye solution. The MAFE assay was performed as described previously66–67. Briefly, individual flies were introduced into a 200 μL pipette tip, which was cut to expose the proboscis. Flies were first water satiated and presented with 100 mM sucrose delivered in a fine graduated capillary (VWR). After flies were unresponsive to 10 food stimuli, the assay was terminated and the total volume of food was calculated.
Measurement of life span
Adult female flies were transferred under sterile conditions to irradiated fly media every 4 – 5 days. Survival in 3 or more independent cohorts containing 15 – 25 flies each was monitored over time.
Apoptosis assay
Midguts from 7-day-old female flies were dissected in PBS containing 0.1% Triton X-100 and the apoptosis assay was performed as previously described18,56. The percentage of apoptotic cells was determined by dividing the number of apoptotic cells by the total number of cells in each section and multiplying by 100.
Measurement of carbohydrate levels
Fly (5 flies per sample) and fly media (0.1 g per sample) were homogenized in TE Buffer (10 mM Tris, pH = 8, 1 mM EDTA) using a bead beater for 45 sec. followed by centrifugation at 7,000 × g for 3 min. The supernatant was heat treated for 30 min. at 72°C before being stored at −80°C before subsequent clean-up steps prior to running on HPAEC-PAD.
100 μL of fly or fly media homogenate sample in TE buffer was diluted with 200 μL of UltraPure distilled water (Invitrogen) and sonicated to get uniform solution. Samples were centrifuged at 2,000 rpm for 15 sec. to precipitate insoluble material. 100 μL of the sample was filtered through pre-washed Pall Nanosep® 3K Omega centrifugal device (MWCO 3KDa, Sigma-Aldrich) for 15 min. at 14,000 rpm, 7°C. The filtrate was dried on Speed Vac. The dry sample was reconstituted in 300 μL of UltraPure water and loaded onto pre-washed Dionex OnGuard® IIH 1cc cartridge. The flow through and 2×1 mL elution with Ultrapure water was collected in the same tube and lyophilized.
Monosaccharide analysis was done using Dionex CarboPac™ PA1 column (4X250mm) with PA1 guard column (4×50mm). Flow rate 1ml/min. Pulsed amperometric detection with gold electrode. The elution gradient was as follows: 0 min. – 20 min., 19 mM sodium hydroxide; 20 min. – 50 min., 0 mM - 212.5 mM sodium acetate gradient with 19 mM sodium hydroxide; 50 min. – 65 min., 212.5 mM sodium acetate with 19 mM sodium hydroxide; 65 min. – 68 min., 212.5 mM – 0 mM sodium acetate with 19 mM sodium hydroxide; 68 min. – 85 min., 19 mM sodium hydroxide
Trehalose, arabinose, galactose, glucose, mannose, xylose, fructose, ribose, sucrose and xylulose were used as standards. The monosaccharides were assigned based on the retention time and quantified using Chromeleon™ 6.8 chromatography data system software. In Extended Data Figures 7f – g, measurements of trehalose levels were performed following the same isolation procedure and subsequently processed using a Trehalose Assay Kit (Megazyme) according to the manufacturer’s instructions.
For experiments treating flies with trehalose, arabinose, or ribose, groups of axenic or axenic flies previously treated with Xi* were administered with trehalose, arabinose, or ribose (10 mg/mL, Sigma) through application to the fly media (40 μL) for every day for 3 days before testing.
RNA isolation and quantitative real-time PCR.
Heads (20 flies per sample) or decapitated bodies (5 flies per sample) were dissected on ice and immediately processed using an Arcturus™ PicoPure™ RNA isolation kit (Applied Biosystems) or a standard TRIzol™-Chloroform protocol (ThermoFisher). 1 μg of RNA was reverse transcribed using iScript cDNA Synthesis Kit, according to manufacturer’s protocol (Bio-Rad) and diluted to 10 ng/μL based on the input concentration of total RNA.
Previously published primer pairs were used to target immune-related gene transcripts18,68. Other primer sequences used include Tdc (F: GGTCTGCCGGACCACTTTC, R: CACTCCGATGCGGAAGTCTG), Tβh (F: GCTTATCCGACACAAAGCTGC, R: GAAAGCATTCTGCAAGTGGAA), Ddc (F: TGGGATGAGCACACCATCTTG, R: GTAGAAGGGAATCAAACCCTCG), Tph (F: TGTTTTCGCCCAAGGATTCGT, R: CACCAGGTTTATGTCATGCTTCT). All primers were synthesized by Integrated DNA Technologies. Real-time PCR for the house-keeping genes Rp49 and RpL32 were used to ensure that input RNA was equal among all samples. Real-time PCR was performed on cDNA using an ABI PRISM 7900 HT system (ThermoFisher) according to the manufacturer’s instructions.
Data reporting and statistical analysis.
Sample size was based on previous literature in the field and experimenters were not blinded as almost all data acquisition and analysis was automated. After eclosion, virgin female flies with the same genotype were sorted into groups of 10–15 flies per vial at random. All flies in each vial were administered with the same treatment regime. For each experiment, the experimental and control flies were collected, treated, and tested at the same time. A Mann-Whitney U or Kruskal-Wallis and Dunn’s post-hoc test was used for statistical analysis of behavioral data and carbohydrate analysis. Comparisons with more than one variant were first analyzed using Two-way ANOVA. An unpaired two-sided Student’s t-test or a One-way ANOVA followed by a Bonferroni post-hoc test was used for statistical analysis of quantitative RT–PCR results and CFU analysis. All statistical analysis was performed using Prism Software (GraphPad, version 7). P values are indicated as follows: **** P < 0.0001; *** P < 0.001; ** P < 0.01; and * P < 0.05. See Supplementary Material for more details on statistical tests and exact P values for each figure. For boxplots, lower and upper whiskers represent 1.5 interquartile range of the lower and upper quartiles, respectively; boxes indicate lower quartile, median, and upper quartile, from bottom to top. When all points are shown, whiskers represent range and boxes indicate lower quartile, median, and upper quartile, from bottom to top. Bar graphs are presented as mean values +/− standard error of the mean (S.E.M.).
Extended Data
Extended Data Figure 1 |. Effects of colonization level, bacterial strain, and host diet on L. brevis-modulation of locomotion.
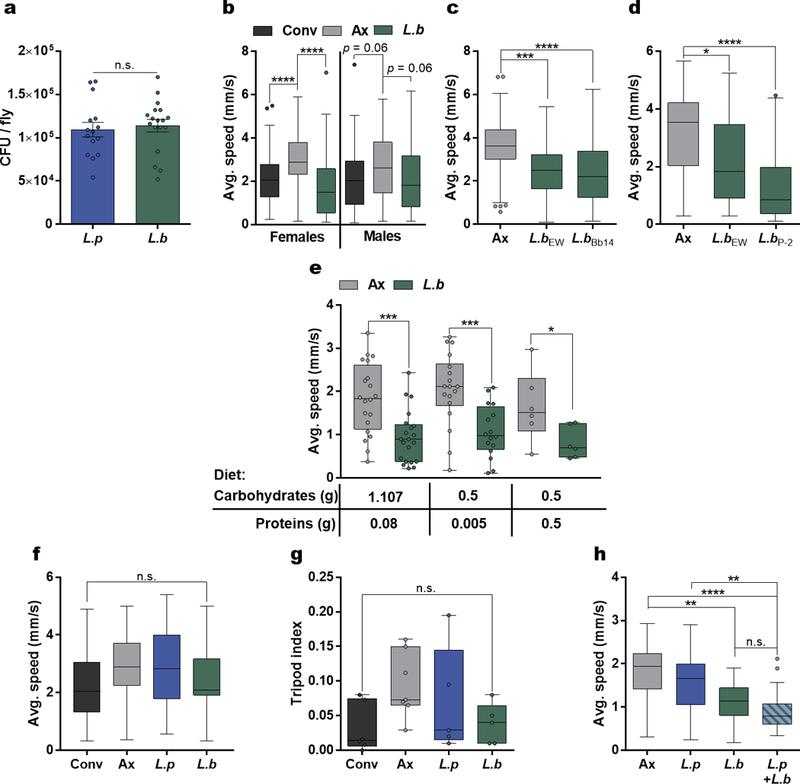
a, Colony forming units (CFU) per individual fly for L.p or L.b mono-associated flies. Bars represent mean +/− S.E.M. L.p, n = 15; L.b, n =18. b, Average speed of Conv, Ax, and L.b mono-associated female or male flies. Females: Conv, n = 90; Ax, n = 92; L.b, n = 89; Males: Conv, n = 100; Ax, n = 100; L.b, n = 95. c – d, Average speed of Ax or flies mono-associated with L.b strains EW, Bb14, or P-2. (c) Ax, n = 58; L.b EW, n = 57; L.b Bb14, n = 57. (d) Ax, n = 45; L.b EW, n = 28; L.b P-2, n = 42. e, Average speed of Ax or L.b mono-associated flies raised on different diet compositions from eclosion until day 7. Diet 1: Ax, n = 20; L.b, n = 21; Diet 2: Ax, n = 18; L.b, n = 16; Diet 3: Ax, n = 6; L.b, n = 6. f, Average speed during walking bouts for Conv, Ax, L.p, and L.b groups. Conv, n = 23; Ax, n = 35; L.p, n = 22; L.b, n = 22. g, Tripod index for Conv, Ax, L.p, and L.b groups. Conv, n = 6; Ax, n = 7; L.p, n = 5; L.b, n = 5.h, Average speed of Ax flies or flies mono-associated with L.p or L.b alone or in combination (1:1). Ax, n = 18; L.p, n = 24; L.b, n = 24; L.p+L.b, n = 24. Box-and-whisker plots show median and IQR. * P < 0.05, ** P < 0.01, *** P < 0.001, **** P < 0.0001. Specific P values are in the Supplementary Material. Unpaired Student’s t-test (a), Kruskal-Wallis and Dunn’s (b – d and f – h), or Mann-Whitney U (e) post-hoc tests were used for statistical analysis. Data are representative of at least 3 independent trials for each experiment.
Extended Data Figure 2 |. Post-eclosion microbial signals decrease host locomotion.
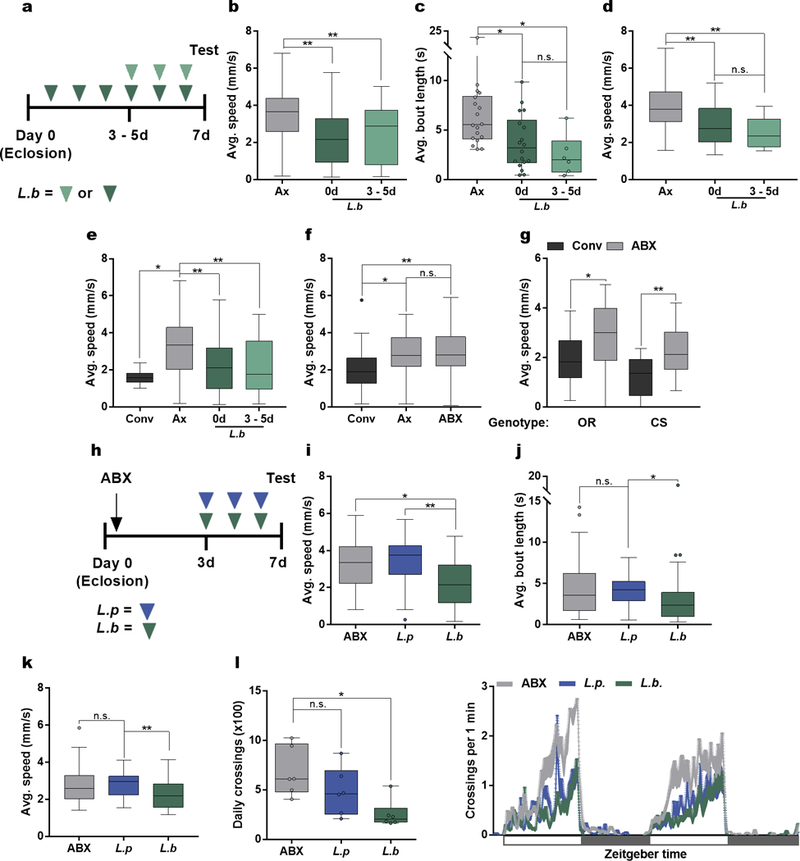
a, Experimental design (b – e) in which Ax flies were associated with L.b either directly after (day 0, dark green arrows) or 3 – 5 days (light green arrows) following eclosion. b – d, Average speed (b), average bout length (c), and average speed during walking bouts (d) of Ax and flies mono-associated with L.b at either day 0 or day 3 – 5. (b) Ax, n = 46; L.b 0d, n = 47; L.b 3–5d, n = 43. (c) Ax, n = 18; L.b 0d, n = 18; L.b 3–5d, n = 6. (d) Ax, n = 36; L.b 0d, n = 36; L.b 3–5d, n = 12. e, Average speed of Conv, Ax, and flies mono-associated with L.b at either day 0 or day 3 – 5. Conv, n = 11; Ax, n = 53; L.b 0d, n = 53; L.b 3–5d, n = 52. f, Average speed of Conv, Ax, and Conv flies treated with antibiotics for 3 days after eclosion (ABX). Conv, n = 32; Ax, n =36; ABX, n = 36. g, Average speed of OregonR (OR) and Canton S (CS) Conv flies and Conv flies treated with antibiotics for 3 days after eclosion (ABX). OR: Conv, n = 20; ABX, n = 22; CS: Conv, n = 12; ABX, n = 17. h, Experimental design (i – l) in which conventionally-reared flies were treated with antibiotics (ABX, black arrow) for 3 days following eclosion. All flies were subsequently placed on irradiated media either without supplementation (ABX) or associated with L.p (blue arrows) or L.b (green arrows) for the 3 days prior to testing. i – k, Average speed (i), average bout length (j), and average speed during walking bouts (k) calculated for ABX, L.p-, and L.b-associated flies. (i) ABX, n = 29; L.p, n = 24; L.b, n = 35. (j) ABX, n = 36; L.p, n = 30; L.b, n = 35. (k) ABX, n = 42; L.p, n = 30; L.b, n = 35. l, Daily activity of ABX, L.p and, L.b groups (virgin female OregonR flies) over a 2-day light-dark cycle period each lasting 12 hours, starting at time 0. White boxes represent lights on and gray boxes represent lights off. n = 6/condition. Box-and-whisker plots show median and IQR. * P < 0.05, ** P < 0.01. Specific P values are in the Supplementary Material. Kruskal-Wallis and Dunn’s (b – f and i – l) or Mann-Whitney U (g) post-hoc tests were used for statistical analysis. Data are representative of at least 2 independent trials for each experiment.
Extended Data Figure 3 |. Bacterial-derived products from L. brevis alter locomotion.
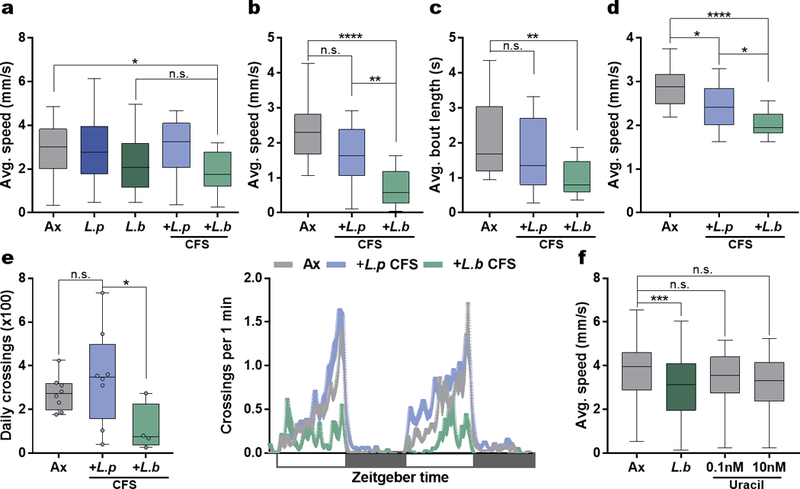
a, Average speed of Ax, L.p or L.b mono-associated, and Ax flies treated with cell-free supernatant (CFS) from L.p or L.b. Ax, n = 45; L.p, n = 17; L.b, n = 42; L.p CFS, n = 17; L.b CFS, n = 16. b – e, Average speed (b), average bout length (c), average speed during walking bouts (d), and daily activity (e) of Ax and Ax virgin female OregonR flies treated with CFS from either L.p or L.b. White boxes represent lights on and gray boxes represent lights off. (b) Ax, n = 23; L.p CFS, n = 20; L.b CFS, n = 20. (c) Ax, n = 23; L.p CFS, n = 20; L.b CFS, n = 17. (d) Ax, n = 22; L.p CFS, n = 21; L.b CFS, n = 17. (e) Ax, n = 8; L.p CFS, n = 8; L.b CFS, n = 4. f, Average speed of Ax, L.b mono-associated, and Ax uracil-treated flies. Ax, n = 96; L.b, n = 88; 0.1 Uracil, n = 41; 10 Uracil, n = 18. Box-and-whisker plots show median and IQR. * P < 0.05, ** P < 0.01, *** P < 0.001, **** P < 0.0001. Specific P values are in the Supplementary Material. Kruskal-Wallis and Dunn’s post-hoc tests were used for statistical analysis. Data are representative of at least 2 independent trials for each experiment.
Extended Data Figure 4 |. Locomotor phenotypes are independent of food intake, anti-microbial peptides, as well as the Immune Deficiency (IMD) and Toll pathways.
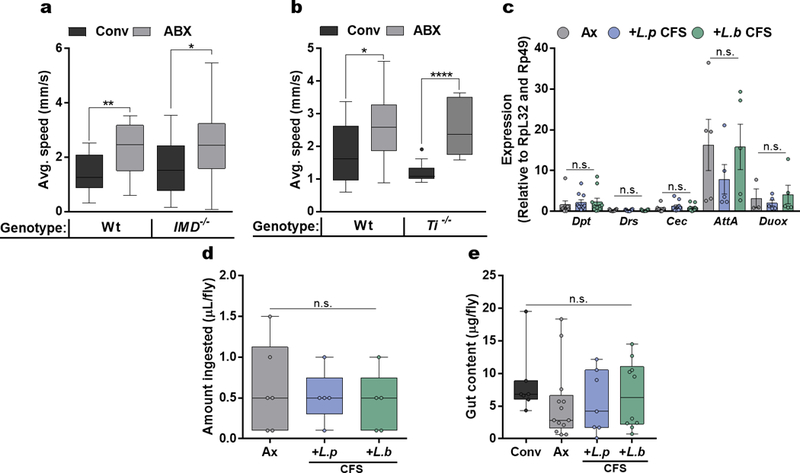
a, Average speed of wild-type background (OregonR, Wt) and Imd−/− flies placed on either media alone or media supplemented with antibiotics (ABX) following eclosion. Wt: Conv, n = 16; ABX, n = 17; IMD−/−: Conv, n = 24; ABX, n = 25. b, Average speed of wild-type background (Canton S, Wt) and Ti−/− flies placed on either media alone or media supplemented with antibiotics (ABX) following eclosion. Wt: Conv, n = 15; ABX, n = 17; Ti−/−: Conv, n = 10; ABX, n = 11. c, qRT-PCR of immune-related transcripts in Ax and Ax L.p- or L.b- CFS treated flies. Bars represent mean +/− S.E.M. Dpt: Ax, n = 8; L.p CFS, n = 10; L.b CFS, n = 10; Drs: Ax, n = 10; L.p CFS, n = 10; L.b CFS, n = 10; Cec: Ax, n = 8; L.p CFS, n = 10; L.b CFS, n = 10; AttA: Ax, n = 5; L.p CFS, n = 5; L.b CFS, n = 5; Duox: Ax, n = 3; L.p CFS, n = 5; L.b CFS, n = 5. d, Amount ingested by Ax and Ax L.p- or L.b- CFS treated flies over 10 trials during MAFE assay. Ax, n = 6; L.p CFS, n =5; L.b CFS, n = 6. e, Intestinal content measured through supplementing the diet of Conv, Ax, and L.p- or L.b- CFS treated Ax flies with blue food dye. Conv, n = 7; Ax, n = 13; L.p CFS, n = 7; L.b CFS, n = 10. Box-and-whisker plots show median and IQR. * P < 0.05, ** P < 0.01, **** P < 0.0001. Specific P values are in the Supplementary Material. Mann-Whitney U (a – b), One-way ANOVA and Bonferroni (c), or Kruskal-Wallis and Dunn’s (d – e) post-hoc tests were used for statistical analysis. Data are representative of at least 2 independent trials for each experiment. Dpt, Diptericin; Drs, Drosomycin; Cec, Cecropin; AttA, Attacin-A; Duox, Dual Oxidase.
Extended Data Figure 5 |. Modulation of locomotion by the bacterial enzyme, xylose isomerase.
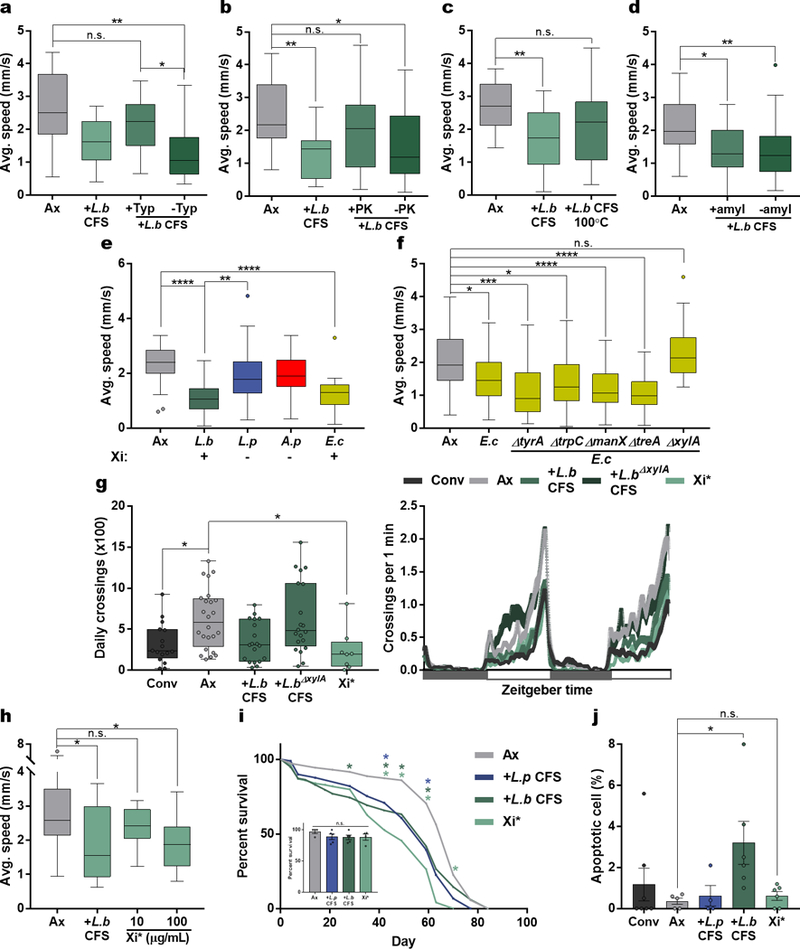
a – c, Average speed of Ax or Ax flies treated with unaltered, protease- (Typ, Trypsin; PK, Proteinase-K), or heat-treated (100°C) L.b CFS. (a) Ax, n = 18; L.b CFS, n = 18; +Typ, n = 17; -Typ, n = 17. (b) Ax, n = 23; L.b CFS, n = 18; +PK, n = 23; -PK, n = 23. (c) n = 18. d, Average speed of Ax flies administered with amylase-treated PBS (Ax), amylase-treated L.b CFS (+amyl L.b CFS), or unaltered L.b CFS (-amyl L.b CFS). Ax, n = 30; +amyl, n = 17; -amyl, n = 30. e, Average speed of Ax flies or flies mono-associated with L.b, L.p, A. pomorum (A.p), or E. coli (E.c). Below shows the presence (+) or absence (−) of Xi based on NCBI Blastn (xylA locus) and Blastp (Xi) results. Ax, n = 30; L.b, n = 30; L.p, n = 29; A.p, n = 30; E.c, n = 18. f, Average speed of Ax and flies mono-associated with either WT E.c or single gene knockout strains of E.c (∆tyrA, ∆trpC, ∆manX, ∆treA, ∆xylA). Ax, n = 65; E.c; n = 52; E.c∆tyrA, n = 18; E.c∆trpC, n = 17; E.c∆manX, n = 45; E.c∆treA, n = 46; E.c∆xylA, n = 20. g, Daily activity of Conv, Ax, and Ax virgin female OregonR flies treated with L.b CFS, L.b∆xylA CFS, or Xi* over a 2-day light-dark cycle period each lasting 12 hours, starting at time 0. White boxes represent lights on and gray boxes represent lights off. Conv, n = 16; Ax, n = 24; L.b CFS, n = 19; L.b∆xylA CFS, n = 20; Xi*, n = 8. h, Average speed of Ax and Ax flies treated with L.b CFS or Xi*. Ax, n = 16; L.b CFS, n = 11; 10 µg/mL Xi*, n = 12; 100 µg/mL Xi*, n = 14. i, Lifespan measurements for Ax and Ax treated with L.p CFS, L.b CFS, or Xi*. Asterisks above represent significance at the time point measured by Kruskal-Wallis and Dunn’s post-hoc test. Inset image shows survival at day 7, error bars represent mean +/− S.E.M. Ax, n = 4 groups; L.p CFS, n = 5 groups; L.b CFS, n = 5 groups; Xi*, n = 4 groups. j, Percentage of apoptotic cells in the intestine of Conv, Ax, and Ax treated with L.p CFS, L.b CFS, or Xi*. Bars represent mean +/− S.E.M. Conv, n = 7; Ax, n = 5; L.p CFS, n = 4; L.b CFS, n = 6; Xi*, n = 6. Box-and-whisker plots show median and IQR. * P < 0.05, ** P < 0.01, *** P < 0.001, **** P < 0.0001. Specific P values are in the Supplementary Material. Kruskal-Wallis and Dunn’s (a – i) or Log-rank (i) post-hoc tests were used for statistical analysis. Data are representative of at least 2 independent trials for each experiment.
Extended Data Figure 6 |. Sleep analysis for mono-colonized flies and flies administered with bacteria factors.
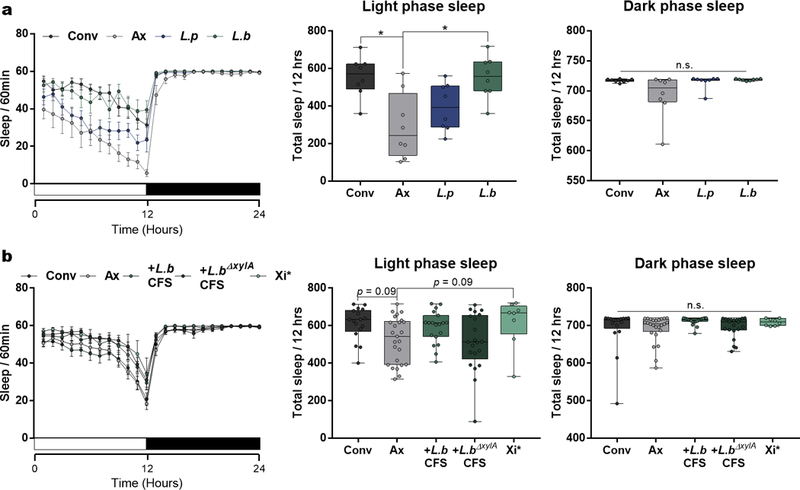
a, 24-hour sleep profiles of Conv, Ax, L.p-, and L.b-colonized virgin female OregonR flies with the number of sleep bouts in 60 min time window and total sleep in the light or dark phase. Error bars represent mean +/− S.E.M. n = 8/condition. b, 24-hour sleep profiles of Conv, Ax, L.b CFS-, L.b∆xylA CFS-, and Xi* treated Ax virgin female OregonR flies with the number of sleep bouts in 60 min time window and total sleep in the light or dark phase. Error bars represent mean +/− S.E.M. Conv, n = 17; Ax, n = 25; L.b CFS-, n = 19; L.b∆xylA CFS-, n = 21; Xi*, n = 8. Box-and-whisker plots show median and IQR. * P < 0.05. Specific P values are in the Supplementary Material. Kruskal-Wallis and Dunn’s post-hoc tests were used for statistical analysis. Data are representative of at least 2 independent trials for each experiment.
Extended Data Figure 7 |. Xylose isomerase activity and key carbohydrates are involved in Xi-mediated changes in locomotion.
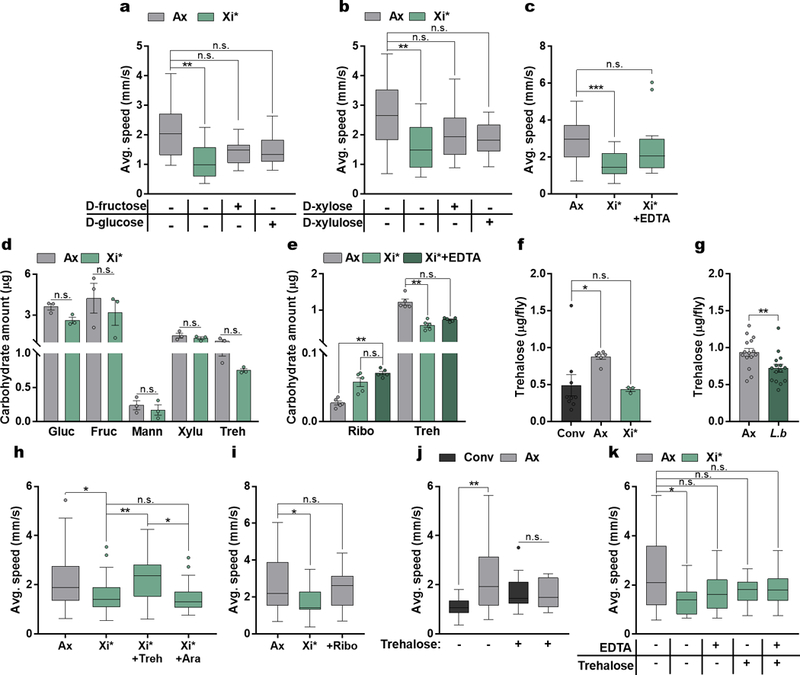
a – b, Average speed of Ax and Ax flies treated with Xi* or 100 µg of D-fructose, D-glucose, D-xylose, or D-xylulose. (a) Ax, n = 16; Xi*, n = 13; D-fructose, n = 13; D-glucose, n = 15. (b) Ax, n = 26; Xi*, n = 21; D-xylose, n = 22; D-xylulose, n = 18. c, Average speed of Ax and Ax flies treated with either Xi* or Xi* inactivated through treatment with 5mM EDTA. Ax, n = 21; Xi*, n = 16; Xi*+EDTA, n = 18. d, Carbohydrate levels in Ax and Xi*-treated fly media. Each sample is from 0.1 g of fly media and represents a separate vial. Bars represent mean +/− S.E.M. n = 3 samples/condition. e, Carbohydrate levels in Ax, Xi*, and EDTA-treated Xi* flies. Each sample contains 5 flies. Bars represent mean +/− S.E.M. n = 5 samples/condition. f, Trehalose levels in Conv, Ax, and Xi*-treated flies. Bars represent mean +/− S.E.M. Conv, n = 9 samples; Ax, n = 6 samples; Xi*, n = 3 samples. g, Trehalose levels in Ax and L.b colonized flies. Bars represent mean +/− S.E.M. n = 15 samples/condition. h, Average speed of Ax and Xi*-treated flies supplemented with either trehalose (Treh, 10 mg/mL) or arabinose (Ara, 10 mg/mL) for 3 days before testing. Ax, n = 40; Xi*, n = 40; Xi*+Treh, n = 39; Xi*+Ara, n = 18. i, Average speed of Ax, Xi*-, or ribose- (Ribo, 10 mg/mL) treated flies. Ax, n = 29; Xi*, n = 25; Ribo, n = 12. j, Average speed of Conv and Ax flies supplemented with trehalose (Treh, 10 mg/mL) for 3 days before testing. Conv, n = 15; Ax, n = 22; Conv+Treh, n = 18; Ax+Treh, n = 15. k, Average speed of Ax and Xi* or EDTA-treated Xi* Ax flies subsequently left untreated or supplemented with trehalose (Treh, 10 mg/mL) for 3 days before testing. Ax, n = 27; Xi, n = 19; Xi+EDTA, n = 24; Xi+Treh, n = 19; Xi+EDTA+Treh, n = 25. Box-and-whisker plots show median and IQR. * P < 0.05, ** P < 0.01, *** P < 0.001. Specific P values are in the Supplementary Material. Kruskal-Wallis and Dunn’s (a – c, e – f, h – k) or a Mann-Whitney U (d and g) post-hoc tests were used for statistical analysis. Data are representative of at least 2 independent trials for each experiment. Gluc, glucose; Fruc, fructose; Mann, mannose; Xylu, xylulose; Treh, trehalose; Ribo, ribose.
Extended Data Figure 8 |. Thermogenetic activation of neuromodulator-GAL4 lines.
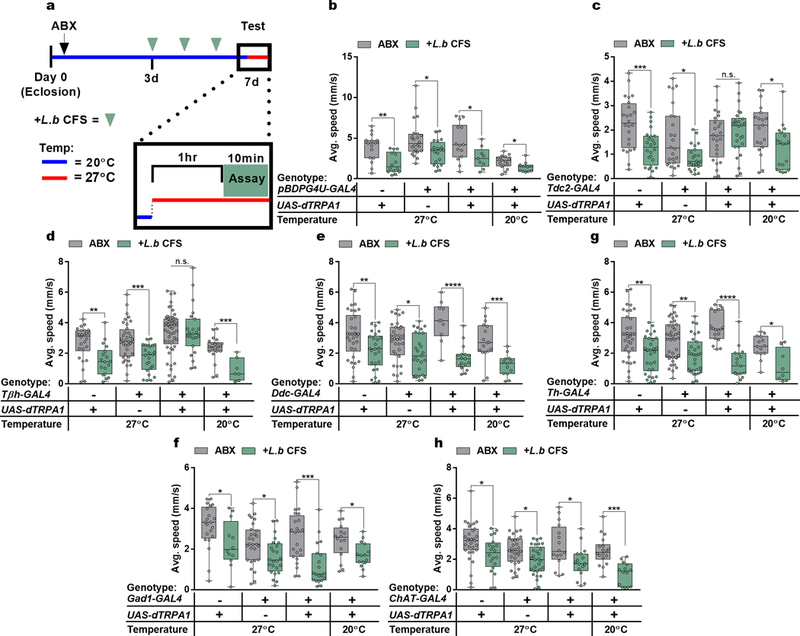
a, Experimental design in which Conv flies (Canton-S) were treated with antibiotics (ABX, black arrow) for 3 days following eclosion. All flies were subsequently placed on irradiated media either without supplementation or treated with L.b CFS (green arrows) for 3 days. 1 hr. prior to and during testing flies were either exposed to 27˚C (red line) to facilitate thermogenetic activation or kept at 20˚C (blue line). b – h, Average speed of flies previously treated with antibiotics and subsequently left untreated (ABX) or administered with L.b CFS for 3 days prior to testing. (b) UAS: ABX, n = 15; L.b CFS, n = 14; GAL4: ABX, n = 24; L.b CFS, n = 20; GAL4>UAS (27°C): ABX, n = 14; L.b CFS, n = 9; GAL4>UAS (20°C): ABX, n = 16; L.b CFS, n = 11. (c) UAS: ABX, n = 24; L.b CFS, n = 24; GAL4: ABX, n = 24; L.b CFS, n = 23; GAL4>UAS (27°C): ABX, n = 25; L.b CFS, n = 26; GAL4>UAS (20°C): ABX, n = 19; L.b CFS, n = 19. (d) UAS: ABX, n = 26; L.b CFS, n = 18; GAL4: ABX, n = 36; L.b CFS, n = 24; GAL4>UAS (27°C): ABX, n = 53; L.b CFS, n = 23; GAL4>UAS (20°C): ABX, n = 21; L.b CFS, n = 7. (e) UAS: ABX, n = 34; L.b CFS, n = 26; GAL4: ABX, n = 34; L.b CFS, n = 28; GAL4>UAS (27°C): ABX, n = 10; L.b CFS, n = 17; GAL4>UAS (20°C): ABX, n = 17; L.b CFS, n = 13. (f) UAS: ABX, n = 36; L.b CFS, n = 30; GAL4: ABX, n = 40; L.b CFS, n = 31; GAL4>UAS (27°C): ABX, n = 19; L.b CFS, n = 17; GAL4>UAS (20°C): ABX, n = 14; L.b CFS, n = 8. (g) UAS: ABX, n = 21; L.b CFS, n = 12; GAL4: ABX, n = 28; L.b CFS, n = 24; GAL4>UAS (27°C): ABX, n = 24; L.b CFS, n = 20; GAL4>UAS (20°C): ABX, n = 16; L.b CFS, n = 15. (h) UAS: ABX, n = 31; L.b CFS, n = 20; GAL4: ABX, n = 31; L.b CFS, n = 29; GAL4>UAS (27°C): ABX, n = 16; L.b CFS, n = 17; GAL4>UAS (20°C): ABX, n = 18; L.b CFS, n = 14. Box-and-whisker plots show median and IQR. * P < 0.05, ** P < 0.01, *** P < 0.001, **** P < 0.0001. Specific P values are in the Supplementary Material. Mann-Whitney U post-hoc tests following a Two-way ANOVA were used for statistical analysis. Data are representative of at least 2 independent trials for each experiment.
Extended Data Figure 9 |. Activation of octopaminergic neurons in flies carrying a null allele for Tβh (TβHM18).
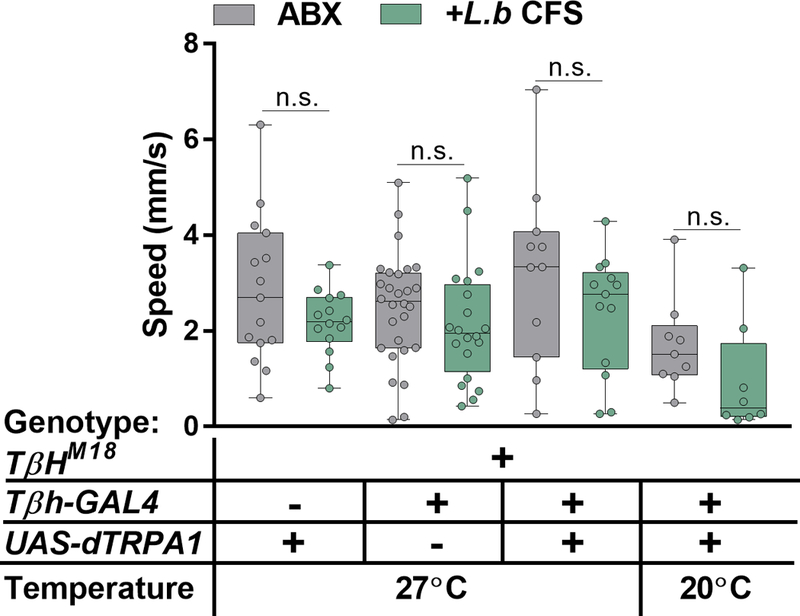
Average speed of flies previously treated with antibiotics and subsequently left untreated (ABX) or administered with L.b CFS for 3 days prior to testing. UAS: ABX, n = 15; L.b CFS, n = 14; GAL4: ABX, n = 28; L.b CFS, n = 20; GAL4>UAS (27°C): ABX, n = 11; L.b CFS, n = 13; GAL4>UAS (20°C): ABX, n = 9; L.b CFS, n = 8. Box-and-whisker plots show median and IQR. Specific P values are in the Supplementary Material. Mann-Whitney U post-hoc tests following a Two-way ANOVA were used for statistical analysis. Data are representative of at least 2 independent trials.
Extended Data Figure 10|. Octopamine mediates L. brevis- and xylose isomerase-induced changes in locomotion.
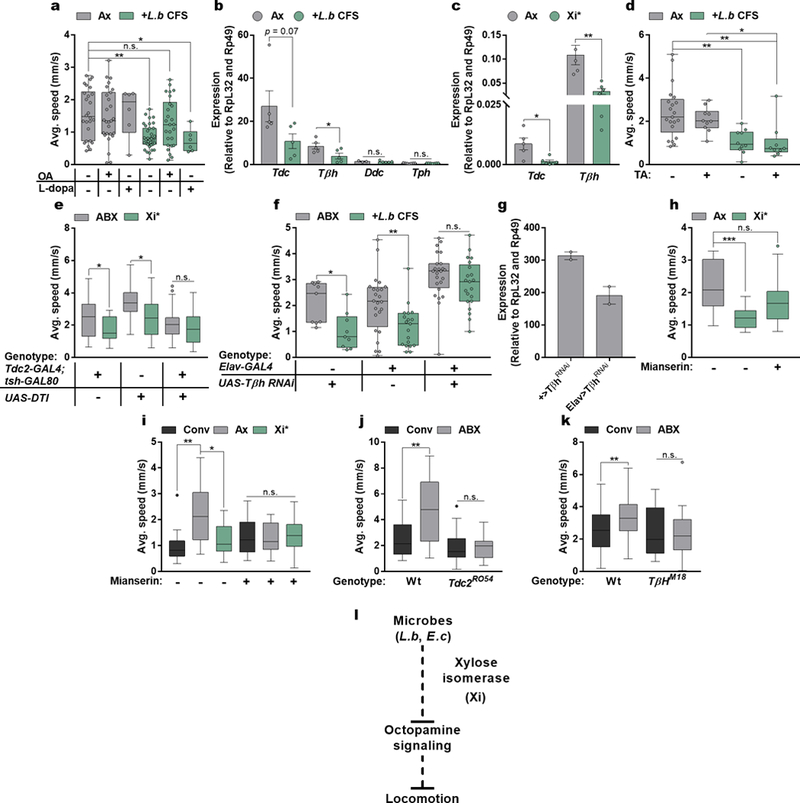
a, Average speed of Ax and L.b CFS-treated Ax flies left untreated or supplemented with octopamine (OA, 10 mg/mL) or L-dopa (1 mg/mL) for 3 days. Ax, n = 26; Ax+OA, n = 27; Ax+L-dopa, n = 6; L.b CFS, n = 35; L.b CFS+OA, n = 26; L.b CFS+L-dopa, n = 6. b, qRT-PCR for transcripts from heads of Ax and L.b CFS-treated Ax flies. Bars represent mean +/− S.E.M. Tdc: n = 5; Tβh, n = 5; Ddc: Ax, n = 3; L.b CFS, n = 5; Tph: n =7. c, qRT-PCR for transcripts from heads of Ax or Ax Xi*-treated flies. Bars represent mean +/− S.E.M. Ax, n = 5 samples; Xi*, n = 6 samples. d, Average speed of Ax and L.b CFS-treated Ax flies left untreated or supplemented with tyramine (TA, 10 mg/mL) for 3 days. Ax, n = 21; Ax+TA, n = 10; L.b CFS, n = 10; L.b CFS+TA, n = 9. e, Average speed of control lines and flies expressing DTI in octopaminergic and tyraminergic neurons outside of the ventral nerve cord. All flies were previously treated with antibiotics and subsequently left untreated (ABX) or administered with Xi* for 3 days prior to testing. GAL4;GAL80: Ax, n = 25; Xi*, n = 18; UAS: Ax, n = 26; Xi*, n = 21; GAL4>UAS: Ax, n = 39; Xi*, n = 23. f, Average speed of control lines and flies expressing Tβh RNAi in all neurons. All flies were previously treated with antibiotics and subsequently left untreated (ABX) or administered with L.b CFS for 3 days prior to testing. UAS: n = 9; GAL4: Ax, n = 24; L.b CFS, n = 19; GAL4>UAS: Ax, n = 24; L.b CFS, n = 21. g, Tβh mRNA measured from heads of flies previously treated with antibiotics. Error bars represent range. n = 2 samples/condition. h, Average speed of Ax and Xi*-treated Ax flies left untreated or supplemented with mianserin (2 mg/mL) for 3 days. Ax, n = 14; Xi*, n = 15; Xi*+Mian, n = 15. i, Average speed of Conv, Ax, and Xi*-treated Ax flies left untreated or supplemented with mianserin (2 mg/mL) for 3 days. Conv, n = 13; Ax, n = 28; Xi*, n = 24; Conv+Mian, n = 27; Ax+Mian, n = 22; Xi*+Mian, n = 22. j, Average speed of wild-type background (w+, Wt) and Tdc2 null mutants (Tdc2RO54) either left untreated or after treatment with antibiotics for 3 days following eclosion. Wt Conv, n = 13; Wt ABX, n = 21; TdcRO54 Conv, n = 28; TdcRO54 ABX, n = 34. k, Average speed of wild-type background (Canton-S, Wt) and Tβh null mutants (TβHM18) either left untreated or after treatment with antibiotics for 3 days following eclosion. Wt Conv, n = 38; Wt ABX, n = 42; TβHM18 Conv, n = 25; TβHM18 ABX, n = 33. l, Model of bacterial modulation of host locomotion. Box-and-whisker plots show median and IQR. * P < 0.05, ** P < 0.01, *** P < 0.001. Specific P values are in the Supplementary Material. Kruskal-Wallis and Dunn’s (a, d, h – i), unpaired Student’s t-test (b – c and g), or Mann-Whitney U (e – f and j – k) post-hoc tests were used for statistical analysis. Data are representative of at least 2 independent trials for each experiment. Tdc, Tyrosine decarboxylase; Tβh, Tyramine beta-hydroxlyase; Ddc, DOPA decarboxylase; Tph, Tryptophan hydroxylase.
Supplementary Material
Acknowledgements
We thank Drs. H. Chu, G. Sharon, W.-L. Wu, J. K. Scarpa, and E. D. Hoopfer as well as the Mazmanian laboratory for helpful critiques. We are grateful to Drs. A. A. Aravin (Caltech), and K. Fejes Tόth (Caltech) for use of their laboratory space. We thank Drs. D. J. Anderson (Caltech), H. A. Lester (Caltech), V. Gradinaru (Caltech), and M.-F. Chesselet (UCLA) for helpful discussions. We also thank A. R. Sandoval, M. Meyerowitz, and M. Smalley for technical support and Y. Garcia-Flores for administrative support. We are grateful to Dr. D. C. Hall for creating custom python scripts. We thank Dr. W.-J. Lee (Seoul National University) for the L. brevisEW, L. plantarumWJL, and A. pomorum bacterial strains, the Yale Coli Genetic Stock Center for wild type and mutant E. coli strains, and Drs. M. H. Dickinson (Caltech), D. J. Anderson (Caltech), A. A. Aravin (Caltech), and K. Fejes Tόth (Caltech) for fly lines. We thank the GlycoAnalytics Core (UCSD) for their help with carbohydrate analysis. We are also grateful to Drs. M. Fischbach (Stanford), and M. Funabashi (Stanford) for the pGID023 vector, and helpful advice. Imaging was performed in the Biological Imaging Facility, with the support of the Caltech Beckman Institute and the Arnold and Mabel Beckman Foundation. C.E.S. was partially supported by the Center for Environmental Microbial Interactions at Caltech. This project was funded by grants from the NIH (NS085910) and the Heritage Medical Research Institute to S.K.M.
Footnotes
Code availability.
Custom code for bout analysis is available from the corresponding authors upon request.
Data availability.
All data sets generated are available from the corresponding authors upon reasonable request.
Author Information The authors declare no competing financial interests.
References
- 1.Diaz Heijtz R, et al. Normal gut microbiota modulates brain development and behavior. Proc. Natl. Acad. Sci. 108, 3047–52 (2011). [DOI] [PMC free article] [PubMed] [Google Scholar]
- 2.Bravo JA, et al. Ingestion of Lactobacillus strain regulates emotional behavior and central GABA receptor expression in a mouse via the vagus nerve. Proc. Natl. Acad. Sci. 108, 16050–16055 (2011). [DOI] [PMC free article] [PubMed] [Google Scholar]
- 3.Luczynski P, et al. Microbiota regulates visceral pain in the mouse. Elife. 6, e25887 (2017). [DOI] [PMC free article] [PubMed] [Google Scholar]
- 4.Gacias M et al. Microbiota-driven transcriptional changes in prefrontal cortex override genetic differences in social behavior. Elife. 5, e13442 (2016). [DOI] [PMC free article] [PubMed] [Google Scholar]
- 5.Fischer C et al. Metabolite exchange between microbiome members produces compounds that influence Drosophila behavior. Elife. 6, 1–25 (2017). [DOI] [PMC free article] [PubMed] [Google Scholar]
- 6.Leitão- Goncalves R, et al. Commensal bacteria and essential amino acids control food choice behavior and reproduction. PLoS Biol. 15, 1–29 (2016). [DOI] [PMC free article] [PubMed] [Google Scholar]
- 7.Wong ACN et al. Gut microbiota modifies olfactory-guided microbial preferences and foraging decisions in Drosophila. Curr. Biol. 27, 2397–2404.e4 (2017). [DOI] [PubMed] [Google Scholar]
- 8.Liu W, et al. Enterococci mediate the oviposition preference of Drosophila melanogaster through sucrose catabolism. Sci. Rep. 7, 1–14 (2017). [DOI] [PMC free article] [PubMed] [Google Scholar]
- 9.Sharon G et al. Commensal bacteria play a role in mating preference of Drosophila melanogaster. Proc. Natl. Acad. Sci. 107, 20051–20056 (2010). [DOI] [PMC free article] [PubMed] [Google Scholar]
- 10.Huston SJ & Jayaraman V Studying sensorimotor integration in insects. Curr. Opin. Neurobiol. 21, 527–34 (2011). [DOI] [PubMed] [Google Scholar]
- 11.Dickinson MH, et al. How animals move: an integrative view. Science. 288, 100–106 (2000). [DOI] [PubMed] [Google Scholar]
- 12.Pearson KG Common principles of motor control in vertebrates and invertebrates. Annu. Rev. Neurosci. 16, 265–297 (1993). [DOI] [PubMed] [Google Scholar]
- 13.Strausfeld NJ & Hirth F Deep homology of arthropod central complex and vertebrate basal ganglia. Science. 340, 157–161 (2013). [DOI] [PubMed] [Google Scholar]
- 14.Martin JR, Ernst R & Heisenberg M Temporal pattern of locomotor activity in Drosophila melanogaster. J. Comp. Physiol. 184, 73–84 (1999). [DOI] [PubMed] [Google Scholar]
- 15.Erkosar B, Storelli G, Defaye A & Leulier F Host-intestinal microbiota mutualism: “learning on the fly.” Cell Host Microbe. 13, 8–14 (2013). [DOI] [PubMed] [Google Scholar]
- 16.Wong ACN, Ng P & Douglas AE Low-diversity bacterial community in the gut of the fruitfly Drosophila melanogaster. Environ. Microbiol. 13, 1889–900 (2011). [DOI] [PMC free article] [PubMed] [Google Scholar]
- 17.Schwarzer M, et al. Lactobacillus plantarum strain maintains growth of infant mice during chronic undernutrition. Science. 351, 854–857 (2016). [DOI] [PubMed] [Google Scholar]
- 18.Lee K-A et al. Bacterial-derived uracil as a modulator of mucosal immunity and gut-microbe homeostasis in Drosophila. Cell. 153, 797–811 (2013). [DOI] [PubMed] [Google Scholar]
- 19.Lemaitre B & Miguel-Aliaga I The digestive tract of Drosophila melanogaster. Annu. Rev. Genet. 47, 377–404 (2013). [DOI] [PubMed] [Google Scholar]
- 20.Kimura KI & Truman JW Postmetamorphic cell death in the nervous and muscular systems of Drosophila melanogaster. J. Neurosci. 10, 403–401 (1990). [DOI] [PMC free article] [PubMed] [Google Scholar]
- 21.Tissot M & Stocker RF Metamorphosis in Drosophila and other insects: The fate of neurons throughout the stages. Prog. Neurobiol. 62, 89–111 (2000). [DOI] [PubMed] [Google Scholar]
- 22.Blacher E, Levy M, Tatirovsky E & Elinav E Microbiome-modulated metabolites at the interface of host immunity. J. Immunol. 198, 572–580 (2017). [DOI] [PubMed] [Google Scholar]
- 23.Breton J, et al. Gut commensal E. coli proteins activate host satiety pathways following nutrient- induced bacterial growth. Cell Metab. 23, 1–11 (2016). [DOI] [PubMed] [Google Scholar]
- 24.Mann K, Gordon M & Scott K A pair of interneurons influences the choice between feeding and locomotion in Drosophila. Neuron. 79, 754–765 (2013). [DOI] [PMC free article] [PubMed] [Google Scholar]
- 25.Wong AC-N, Dobson AJ & Douglas AE Gut microbiota dictates the metabolic response of Drosophila to diet. J. Exp. Biol. 217, 1894–901 (2014). [DOI] [PMC free article] [PubMed] [Google Scholar]
- 26.Kim E-K, Park YM, Lee OY, & Lee W-J Draft Genome Sequence of Lactobacillus brevis Strain EW, a Drosophila Gut Pathobiont. Genome Announc. 1, e00938–13 (2013). [DOI] [PMC free article] [PubMed] [Google Scholar]
- 27.Martino ME, et al. Resequencing of the Lactobacillus plantarum Strain WJL Genome. Genome Announc. 3, e01382–15 (2015). [DOI] [PMC free article] [PubMed] [Google Scholar]
- 28.Baba T et al. Construction of Escherichia coli K-12 in-frame, single-gene knockout mutants: the Keio collection. Mol. Syst. Biol. 2, 2006–008. (2006). [DOI] [PMC free article] [PubMed] [Google Scholar]
- 29.Yamanaka K Purification, crystallization, and properties of the D-xylose isomerase from Lactobacillus brevis. Biochim. Biophys. Acta 151, 670–80 (1967). [DOI] [PubMed] [Google Scholar]
- 30.Ridley EV, Wong ACN, Westmiller S & Douglas AE Impact of the resident microbiota on the nutritional phenotype of Drosophila melanogaster. PLoS One 7, e36765 (2012). [DOI] [PMC free article] [PubMed] [Google Scholar]
- 31.Yang Z et al. Octopamine mediates starvation-induced hyperactivity in adult Drosophila. Proc. Natl. Acad. Sci. 112, 5219–5224 (2015). [DOI] [PMC free article] [PubMed] [Google Scholar]
- 32.Chen A et al. Dispensable, redundant, complementary, and cooperative roles of dopamine, octopamine, and serotonin in Drosophila melanogaster. Genetics. 193, 159–76 (2013). [DOI] [PMC free article] [PubMed] [Google Scholar]
- 33.Riemensperger T, et al. Behavioral consequences of dopamine defciency in the Drosophila central nervous system. Proc. Natl. Acad. Sci. 108, 834–839 (2011). [DOI] [PMC free article] [PubMed] [Google Scholar]
- 34.Mithieux G, et al. Portal sensing of intestinal gluconeogenesis is a mechanistic link in the diminution of food intake induced by diet protein. Cell Metab. 2, 321–329 (2005). [DOI] [PubMed] [Google Scholar]
- 35.Hamada FN, et al. An internal thermal sensor controlling temperature preference in Drosophila. Nature. 454, 217–220 (2008). [DOI] [PMC free article] [PubMed] [Google Scholar]
- 36.Roeder T Tyramine and octopamine: ruling behavior and metabolism. Annu. Rev. Entomol. 50, 447–477 (2005). [DOI] [PubMed] [Google Scholar]
- 37.Crocker A & Sehgal A Octopamine regulates sleep in Drosophila through protein kinase A-dependent mechanisms. J. Neurosci. 38, 9377–9385 (2008). [DOI] [PMC free article] [PubMed] [Google Scholar]
- 38.Crocker A, Shahidullah M, Levitan IB & Sehgal A Identification of a neural circuit that underlies the effects of octopamine on sleep:wake behavior. Neuron. 65, 670–681 (2010). [DOI] [PMC free article] [PubMed] [Google Scholar]
- 39.Selcho M, Pauls D, El Jundi B, Stocker RF & Thum AS The role of octopamine and tyramine in Drosophila larval locomotion. J. Comp. Neurol. 520, 3764–3785 (2012). [DOI] [PubMed] [Google Scholar]
- 40.Saraswati S, Fox LE, Soll DR & Wu CF Tyramine and octopamine have opposite effects on the locomotion of Drosophila larvae. J. Neurobiol. 58, 425–441 (2004). [DOI] [PubMed] [Google Scholar]
- 41.Klaassen LW & Kammer AE Octopamine enhances neuromuscular transmission in developing and adult moths, Manduca sexta. J. Neurobiol. 16, 227–243 (1985). [DOI] [PubMed] [Google Scholar]
- 42.Weisel-Eichler A & Libersat F Neuromodulation of flight initiation by octopamine in the cockroach Periplaneta americana. J. Comp. Physiol. A. 179, 103–112 (1996). [Google Scholar]
- 43.Brembs B, Christiansen F, Pfluger HJ & Duch C Flight initiation and maintenance deficits in flies with genetically altered biogenic amine levels. J. Neurosci. 27, 11122–11131 (2007). [DOI] [PMC free article] [PubMed] [Google Scholar]
- 44.van Breugel F, Suver MP & Dickinson MH Octopaminergic modulation of the visual flight speed regulator of Drosophila. J. Exp. Biol. 217, 1737–1744 (2014). [DOI] [PubMed] [Google Scholar]
- 45.Han DD, Stein D & Stevens LM Investigating the function of follicular subpopulations during Drosophila oogenesis through hormone-dependent enhancer-targeted cell ablation. Development 127, 573–83 (2000). [DOI] [PubMed] [Google Scholar]
- 46.Selkrig J et al. The Drosophila microbiome has a limited influence on sleep, activity, and courtship behaviors. Sci Rep 8, 10646 (2018). [DOI] [PMC free article] [PubMed] [Google Scholar]
- 47.Nishino R et al. Commensal microbiota modulate murine behaviors in a strictly contamination-free environment confirmed by culture-based methods. Neurogastroenterol. Motil. 25, 521–528 (2013). [DOI] [PubMed] [Google Scholar]
- 48.Lendrum JE, Seebach B, Klein B & Liu S Sleep and the gut microbiome: antibiotic-induced depletion of the gut microbiota reduces nocturnal sleep in mice. bioRxiv. (2017). [Google Scholar]
- 49.Berridge CW Noradrenergic modulation of arousal. Brain Res. Rev. 58, 1–17 (2008). [DOI] [PMC free article] [PubMed] [Google Scholar]
- 50.Monastirioti M, Linn CE, & White K Characterization of Drosophila tyramine beta-hydroxylase gene and isolation of mutant flies lacking octopamine. J. Neurosci. 16, 3900–3911 (1996). [DOI] [PMC free article] [PubMed] [Google Scholar]
- 51.Clyne JD & Miesenbock G Sex-specific control and tuning of the pattern generator for courtship song in Drosophila. Cell. 133, 354–363 (2008). [DOI] [PubMed] [Google Scholar]
- 52.Shiga Y, Tanaka-Matakatsu M, & Hayashi S A nuclear GFP/ beta-galactosidase fusion protein as a marker for morphogenesis in living Drosophila. Dev. Growth Differ. 38, 99–106 (1996). [Google Scholar]
- 53.Lee WC & Micchelli CA Development and characterization of a chemically defined food for Drosophila. PLoS One. 8, 1–10 (2013). [DOI] [PMC free article] [PubMed] [Google Scholar]
- 54.Brummel T, Ching A, Seroude L, Simon AF & Benzer S Drosophila lifespan enhancement by exogenous bacteria. Proc. Natl. Acad. Sci. 101, 12974–12979 (2004). [DOI] [PMC free article] [PubMed] [Google Scholar]
- 55.Ren C, Webster P, Finkel SE & Tower J Increased internal and external bacterial load during Drosophila aging without life-span trade-off. Cell Metab. 6, 144–52 (2007). [DOI] [PubMed] [Google Scholar]
- 56.Ryu J-H, et al. Innate immune homeostasis by the homeobox gene caudal and commensal-gut mutualism in Drosophila. Science. 319, 777–82 (2008). [DOI] [PubMed] [Google Scholar]
- 57.Storelli G, et al. Lactobacillus plantarum promotes Drosophila systemic growth by modulating hormonal signals through TOR-dependent nutrient sensing. Cell Metab. 14, 403–14 (2011). [DOI] [PubMed] [Google Scholar]
- 58.Shin SC, et al. Drosophila microbiome modulates host developmental and metabolic homeostasis via insulin signaling. Science. 334, 670–4 (2011). [DOI] [PubMed] [Google Scholar]
- 59.Chiu JC, Low KH, Pike DH, Yildirim E & Edery I Assaying locomotor activity to study circadian rhythms and sleep parameters in Drosophila. J. Vis. Exp, 1–8 (2010). [DOI] [PMC free article] [PubMed] [Google Scholar]
- 60.Schmid B, Helfrich-Förster C, & Yoshii T A new ImageJ plugin “ActogramJ” for chronobiological analyses. J Biol Rhythms, 26, 464–467 (2011). [DOI] [PubMed] [Google Scholar]
- 61.Wolf FW, Rodan AR, Tsai LT-Y & Heberlein U High-resolution analysis of ethanol-induced locomotor stimulation in Drosophila. J. Neurosci. 22, 11035–44 (2002). [DOI] [PMC free article] [PubMed] [Google Scholar]
- 62.Simon JC & Dickinson MH A new chamber for studying the behavior of Drosophila. PLoS One. 5, e8793 (2010). [DOI] [PMC free article] [PubMed] [Google Scholar]
- 63.White KE, Humphrey DM & Hirth F The dopaminergic system in the aging brain of Drosophila. Front. Neurosci. 4, 1–12 (2010). [DOI] [PMC free article] [PubMed] [Google Scholar]
- 64.Mendes CS, Bartos I, Akay T, Márka S & Mann RS Quantification of gait parameters in freely walking wild type and sensory deprived Drosophila melanogaster. Elife. 2, e00231 (2013). [DOI] [PMC free article] [PubMed] [Google Scholar]
- 65.Shaw PJ, Cirelli C, Greenspan RJ, & Tononi G Correlates of sleep and waking in Drosophila melanogaster. Science. 287, 1834–1837 (2000). [DOI] [PubMed] [Google Scholar]
- 66.Yu Y, et al. Regulation of starvation-induced hyperactivity by insulin and glucagon signaling in adult Drosophila. Elife. 5, e15693 (2016). [DOI] [PMC free article] [PubMed] [Google Scholar]
- 67.Qi W, et al. A quantitative feeding assay in adult Drosophila reveals rapid modulation of food ingestion by its nutritional value. Mol. Brain. 8, 87 (2015). [DOI] [PMC free article] [PubMed] [Google Scholar]
- 68.Chakrabarti S, Poidevin M, & Lemaitre B The Drosophila MAPK p38c regulates oxidative stress and lipid homeostasis in the intestine. PLoS Genet. 10, e1004659 (2014). [DOI] [PMC free article] [PubMed] [Google Scholar]
Associated Data
This section collects any data citations, data availability statements, or supplementary materials included in this article.


