

Manipulation of gut microbiota is increasingly recognized as a promising approach to reduce various noncommunicable diseases, such as obesity and type 2 diabetes. Specific dietary supplements, including resistant starches (RS), are often a focus, yet comprehensive insights into functional responses of microbiota are largely lacking. Furthermore, unresponsiveness in certain individuals is poorly understood. Our data indicate that distinct parts of microbiota work jointly to degrade RS and successively form health-promoting fermentation end products. It highlights the need to consider both primary degraders and specific more-downstream-acting bacterial groups in order to achieve desired intervention outcomes. The gained insights will assist the design of personalized treatment strategies based on an individual's microbiota.
KEYWORDS: butyrate, diet, gut microbiota, metagenomics, resistant starch, short-chain fatty acids
ABSTRACT
Several studies monitoring alterations in the community structure upon resistant starch (RS) interventions are available, although comprehensive function-based analyses are lacking. Recently, a multiomics approach based on 16S rRNA gene sequencing, metaproteomics, and metabolomics on fecal samples from individuals subjected to high and low doses of type 2 RS (RS2; 48 g and 3 g/2,500 kcal, respectively, daily for 2 weeks) in a crossover intervention experiment was performed. In the present study, we did pathway-based metagenomic analyses on samples from a subset of individuals (n = 12) from that study to obtain additional detailed insights into the functional structure at high resolution during RS2 intervention. A mechanistic framework based on obtained results is proposed where primary degradation was governed by Firmicutes, with Ruminococcus bromii as a major taxon involved, providing fermentation substrates and increased acetate concentrations for the growth of various major butyrate producers exhibiting the enzyme butyryl-coenzyme A (CoA):acetate CoA-transferase. H2-scavenging sulfite reducers and acetogens concurrently increased. Individual responses of gut microbiota were noted, where seven of the 12 participants displayed all features of the outlined pattern, whereas four individuals showed mixed behavior and one subject was unresponsive. Intervention order did not affect the outcome, emphasizing a constant substrate supply for maintaining specific functional communities.
IMPORTANCE Manipulation of gut microbiota is increasingly recognized as a promising approach to reduce various noncommunicable diseases, such as obesity and type 2 diabetes. Specific dietary supplements, including resistant starches (RS), are often a focus, yet comprehensive insights into functional responses of microbiota are largely lacking. Furthermore, unresponsiveness in certain individuals is poorly understood. Our data indicate that distinct parts of microbiota work jointly to degrade RS and successively form health-promoting fermentation end products. It highlights the need to consider both primary degraders and specific more-downstream-acting bacterial groups in order to achieve desired intervention outcomes. The gained insights will assist the design of personalized treatment strategies based on an individual's microbiota.
INTRODUCTION
Imbalances in gut microbiota are linked to various noncommunicable diseases, such as obesity and type 2 diabetes, that are particularly emerging in industrialized nations. The so-called “Western lifestyle” and specifically its associated diets are suggested to govern observed dysbiosis, as they are high in fat content and lack sufficient complex polysaccharides that escape digestion in the upper gastrointestinal tract and reach the large intestine (1, 2). Consequently, the colonic microbiota is depleted of growth substrates, limiting the production of microbe-derived fermentation products, such as short-chain fatty acids, that are essential for host health (3, 4). There are large collective efforts to reveal the specific mechanisms by which diet controls our gut microbiota. Manipulating its structure through personalized nutrition and specific prebiotic supplements is a promising approach to promote host health (5, 6).
Beneficial features of resistant starches (RS) are well documented (7), and several studies investigating the microbiome structure upon RS interventions have been conducted (8–12). Various bacterial taxa are able to degrade starch, but only a few are known to act on its resistant forms, where in particular, Ruminococcus bromii and Bifidobacterium adolescentis have been exposed as key primary degraders (13). Intake of resistant starch had various impacts on gut microbiota in previous studies where 15% to 30% of individuals were unresponsive during interventions, highlighting the individuality of gut communities. Those observations support the concept of “permissive” versus “restrictive” microbiota, where the restrictive microbiota lacks certain key degraders, leading to unresponsiveness during intervention (11, 14). Degradation products of RS stimulate the growth of additional taxa that are not supposed to be involved in its primary degradation, leading to an increase in specific fermentation end products, in particular butyrate, which is proposed to be primarily responsible for observed health benefits of RS, promoting epithelial integrity and immune homeostasis (15, 16). Flourishing of major butyrate producers, specifically of Eubacterium rectale, during diets rich in RS has been repeatedly reported (9, 10, 12). Importantly, community alterations occurred rapidly and were reversed after dietary changes in RS, implying that a constant RS supply is needed to maintain certain community structures (9, 11).
The above-mentioned studies are primarily based on phylogenetic marker gene analyses, and comprehensive functional investigations disentangling the complex network of primary degradation of resistant starch to final fermentation end products are lacking. Given the vast functional redundancies of gut microbes, functional investigations are key to extract universal patterns during degradation that are possibly blind to phylogenetic-based studies due to highly subject-specific taxonomic compositions of gut communities (17). To this end, a multiomics approach based on 16S rRNA gene sequencing, metaproteomics, and metabolomics on fecal samples from individuals subjected to high and low doses of type 2 RS (RS2) in a crossover intervention experiment was recently performed (18, 19). Here, we performed pathway-based metagenomic analyses on samples from a subset of randomly chosen individuals (n = 12) from that study to obtain additional detailed insights into the functional structure at high resolution.
RESULTS
An outline of the crossover design of this study is presented in Fig. 1. Fecal samples were taken from 12 individuals subjected to a defined low-carbohydrate “maintenance diet” supplemented with low doses of RS type 2 (3 g/2,500 kcal daily for 2 weeks) compared with high doses of RS2 (48 g/2,500 kcal daily for 2 weeks), separated by a 2-week washout period on their usual diets for 7 days, followed by the maintenance diet for an additional 7 days; six individuals (referred to as 1 to 6) received the high dose followed by the low dose, whereas the other half (referred to as 7 to 12) were subjected to the inverted order. Details of the dietary intervention have been described earlier (18).
FIG 1.
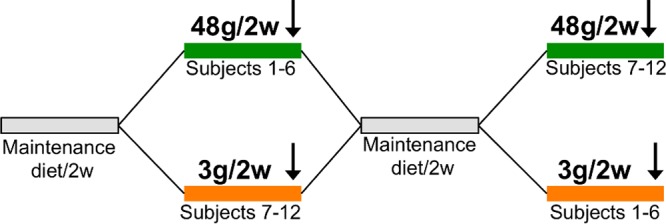
Schematic representation of the crossover intervention design. Participants were subjected to diets low (3 g/2,500 kcal daily) and high (48 g/2,500 kcal daily) in RS2 for 2 weeks (2w), separated by a 2-week period; six individuals (1 to 6) received the high-RS2 diet, followed by the low-RS2 diet, whereas the other half (participants 7 to 12) consumed the diets in the alternate order. Samples were taken at the end of each intervention (indicated by an arrow).
Diets high in RS2 changed the fecal community structure within subjects.
Community structures maintained high subject specificities during interventions, and no significant global differences between the two dietary groups were obtained (Fig. 2A). Firmicutes and Bacteroidetes dominated in all samples (see Fig. S1 in the supplemental material). The resistant starch degrader R. bromii was detected in six subjects at high abundances, whereas B. adolescentis displayed abundances of ≥1% in only two individuals. All subjects exhibited several taxa associated with butyrate production at high abundances (Fig. S1). Within-subject comparisons revealed a strong shift in the community structure in 11 individuals upon intake of the high-RS2 diet with increasing Gram-positive Firmicutes (mean ± standard deviation, +10.7% ± 10.6%) at the expense of the Gram-negative Bacteroidetes (−10.4% ± 10.8%) (Fig. 2B). At the species level, we did not detect any significant differences after false-discovery rate (FDR) correction, although changes in R. bromii (+7.8% ± 9.9%, only considering the six subjects exhibiting this bacterium) and the butyrate producer Faecalibacterium prausnitzii (+2.1% ± 2.6%) were most responsive to RS2 intake and displayed raw P values of <0.05 (Fig. 2C). Some additional butyrate producers, namely, E. rectale and Roseburia spp., were highly elevated in several samples derived from high RS2 doses. Members of Bacteroides showed discordant behavior and, overall, the abundance of the genus declined in eight individuals upon high RS2 intake. No significant differences between intervention orders were obtained.
FIG 2.
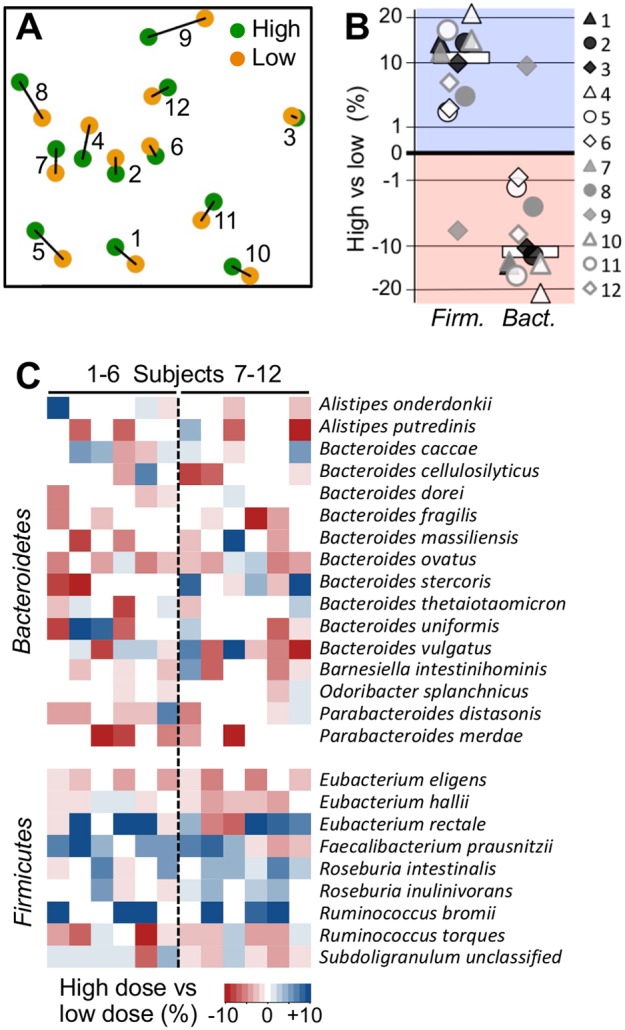
Community structure changes upon RS2 intake. (A) Nonmetric multidimensional scaling analysis based on species data of communities from individual participants (type of intervention, i.e., high- and low-RS2 diet, is indicated by the color code). (B and C) Abundance changes in the dominant phyla Firmicutes and Bacteroidetes comparing results from samples derived from high-RS2 diets with those from low-RS2 diets (B), with the respective results at the species level (only results from species with mean abundances >0.5% are shown) (C). In panel B, median changes are indicated by white bars. Results exceeding values from the color bar (shown in panel C) were scaled to ±10%. Subjects 1 to 6 received the high-RS2 diet, followed by the low-RS2 diet, whereas individuals 7 to 12 consumed the diets in the alternate order.
High doses of RS2 enriched potential functions involved in its degradation, along with downstream fermentation pathways.
Ordination analysis based on abundances of potential functions (KEGG modules) revealed two major groups, where seven patients clustered together at low-RS2 diets and displayed similar shifts at diets high in RS2 (Fig. 3A). Four individuals formed a distinct group, whereas data from subject 7 clustered apart from other individuals. Those seven individuals also displayed significantly higher responses (Bray-Curtis dissimilarity [BC] between diets, 0.12 ± 0.05) than other subjects (BC, 0.06 ± 0.01). Detailed analyses based on within-subject comparisons including all individuals showed several signatures for Gram-positive bacteria elevated in abundance with high-RS2 doses, such as map00561 (glycerolipid metabolism) and M00251 (teichoic acid transport system) (Fig. 3B), supporting major phylogenetic-based community shifts shown in Fig. 2B. Furthermore, genes linked to the KEGG pathway map0500 (starch and sucrose metabolism) increased by 21.0% ± 15.0%, together with two associated KEGG models, namely, M00565 (trehalose biosynthesis, +41.8% ± 33.2%) and M00266 (phosphotransferase system [PTS], maltose/glucose-specific II component, +55.6% ± 52.6%) that encompass amylose-degrading pathways and uptake mechanisms of the respective degradation products. Individual KEGG Orthology (KO) terms representing starch-degrading enzymes were increased in most individuals (K01176, +114.7% ± 156.9%; K01208, +108.4% ± 108.4%; K05343, +135.4% ± 173.1%; K00700, +28.9% ± 26.9%), except for subject 9, who consistently lacked functional responses for starch degradation. Several sugar uptake systems specific for the degradation products glucose and maltose increased with high-RS2 diets (an overview of all KEGG features significantly changing with high-RS2 diets is given in Data Sets S1 to S3). Analyses based on genes encoding carbohydrate-active enzymes (CAZymes) supported the results obtained from KEGG, in that glycoside hydrolases (GH) associated with families 13 and 77 encompassing starch-degrading amylases, as well as GH13 exhibiting specific polysaccharide binding modules, were elevated at high-RS2 concentrations (+30.0% ± 22.9%, +32.8% ± 34.8%, and +34.1% ± 32.9%, respectively; Fig. 3B).
FIG 3.
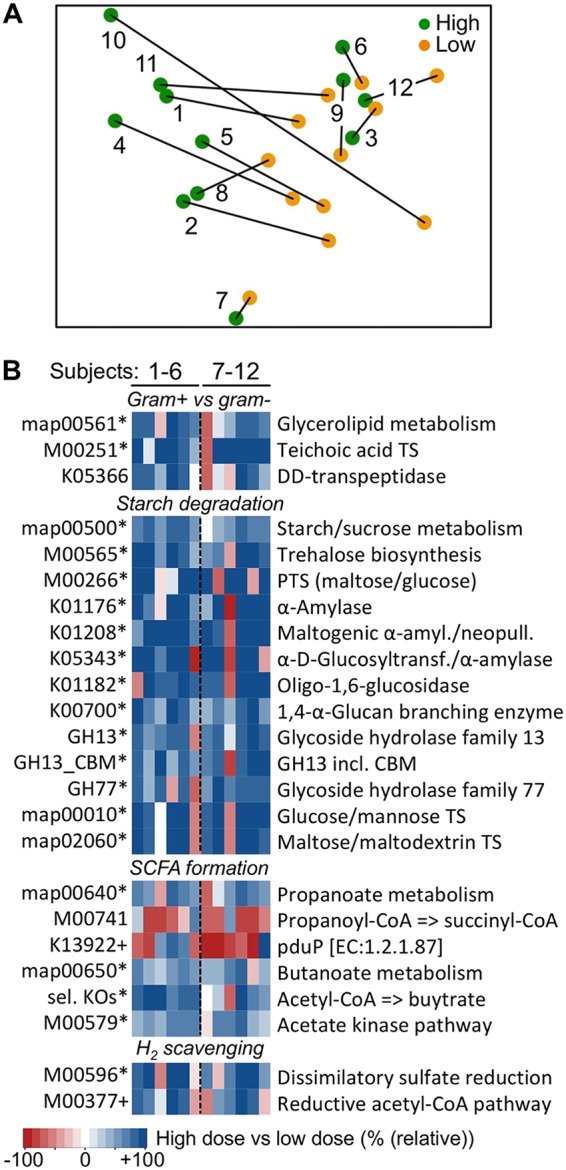
Alterations of potential functions during RS2 intervention. (A) Nonmetric multidimensional scaling analysis of the overall functional potential of communities (based on abundances of KEGG modules) from individual participants is shown (type of intervention, i.e., high- and low-RS2 diets, is indicated by the color code). (B) Relative changes of selected major functions comparing results from samples derived from high-RS2 diets with those from low-RS2 diets. Results are based on KEGG and CAZy (GH13, GH13_CBM, and GH77), where an asterisk illustrates significant differences (P < 0.05) and the plus sign indicates trending differences (P < 0.1) based on FDR-corrected Wilcoxon signed-rank tests (for KOs, q-value statistics were applied). sel. KOs, combined result of manually selected KOs (K00626, K00074, and K01715). Results exceeding values from the color bar were scaled to 100%. Subjects 1 to 6 received the high-RS2 diet, followed by the low-RS2 diet, whereas individuals 7 to 12 consumed the diets in the alternate order. GH, glycoside hydrolase; CBM, carbohydrate binding module; TS, transport system; amyl., amylase; neopull., neopullulanase; Glucosyltransf., glucosyltransferase; incl., including.
Genes encoding KEGG pathways for major fermentative routes of butyrate (map00650) and propionate (map00640), as well as M00579, representing the main acetate synthesis pathway via acetate kinase were elevated (+13.9% ± 11.9%) in samples derived from high-RS2 intake (Fig. 3B). However, the major propionate-forming succinate pathway that is primarily used by Bacteroides did not change, and K13922, representing propionaldehyde dehydrogenase (PduP), a signature enzyme for the propanediol pathway, trended in a decreasing manner (KOs associated with the acrylate pathway were not detected). Manual selected KOs of the main butyrate-producing pathway (from acetyl coenzyme A [acetyl-CoA] to crotonoyl-CoA; K00626, K00074, and K01715) behaved discordantly in many individuals, and only crotonase (K01715) was significantly increased. However, the combined results indicated increased butyrate production potential with high RS2 doses (+26.2% ± 24.3%) (Fig. 3B).
H2-scavanging bacteria, specifically sulfite reducers represented by M00596 and acetogens using the Wood-Ljungdahl pathway (M00377), were increased by 49.7% ± 53.8% and 21.2% ± 23.7% (FDR corrected P = 0.09), respectively, in samples derived from high RS2 consumption. The module for methanogenesis from acetate (M00357) was elevated as well, although this increase was governed by acetate kinase (K00925) and phosphate acetyltransferase (K00625), whereas KOs encoding methanogenic signature enzymes, such as acetyl-CoA decarbonylase/synthase and methyl-coenzyme M reductase, were not elevated (methyl-coenzyme M reductase was only found in two individuals). Recently, serum levels of the atherosclerotic compound trimethylamine-N-oxide (TMAO), which is formed from microbe-derived trimethylamine (TMA), were reported to increase with high doses of RS2 (18). In this study, we detected the TMA-forming pathway via choline in all subjects; however, the abundances did not differ between diets (0.16% ± 0.13% and 0.11% ± 0.11% of total bacteria exhibited the pathway at diets low and high RS2, respectively [P = 0.44]), whereas genes encoding carnitinase that produce TMA from carnitine were only detected in three individuals at an abundance of 0.14% ± 0.14%) (Fig. S2). No major differences between intervention orders were obtained.
Taxonomic affiliations of genes encoding RS2-degrading key enzymes.
R. bromii constituted major fractions of genes encoding amylases and a glucan-branching enzyme associated with RS2 degradation (K00176, 74.4%; K01208, absent; K05343, 79.0%; K00700, 88.6%; and GH13, 12.2% [including all samples]) and showed the highest increase in abundance with high doses of RS2 in individuals exhibiting genes affiliated with that taxon (i.e., R. bromii) (Fig. 4). Additionally, genes linked to selected butyrate producers, such as E. rectale, F. prausnitzii, and Roseburia spp., did increase, whereas those associated with Bacteroides spp. showed varied patterns (Fig. 4). Genes previously described in B. adolescentis played a minor role. Interestingly, both KEGG and CAZy suggest that genes linked to R. bromii were present in subjects 2 and 7 and increased with high doses of RS2, despite phylogenetic results that suggested that those individuals were devoid of this taxon (Fig. 2C). KEGG indicates lower mean abundances (∼15% of mean abundance compared with other six R. bromii-rich subjects), whereas CAZy-based analyses suggest similar abundances in all eight individuals (Fig. S3A). Four subjects were consistently lacking this taxon in all analyses. Closer investigations suggest that a bacterium related to R. bromii is present in subjects 2 and 7, as coverage of the R. bromii genome was highly variable, and the housekeeping gene rplB shows substantial phylogenetic distance from the reference in these individuals (Fig. S3B and C).
FIG 4.
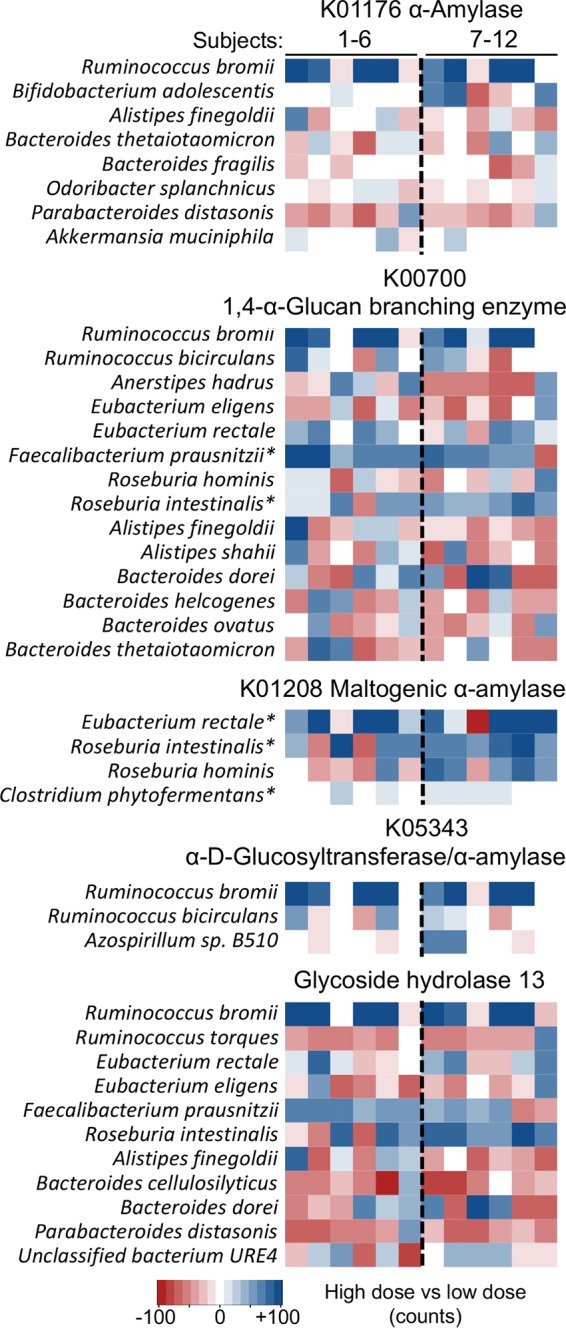
Taxonomic affiliations of genes encoding major starch-degrading enzymes based on KEGG and CAZy. Abundance changes (number of counts) of taxa comparing results from samples derived from high-RS2 diets with those from low-RS2 diets are displayed, where the asterisks illustrate significant differences (P < 0.05) based on FDR-corrected Wilcoxon signed-rank tests. Results exceeding values from the color bar were scaled to ±100 counts. Subjects 1 to 6 received the high-RS2 diet, followed by the low-RS2 diet, whereas individuals 7 to 12 consumed the diets in the alternate order.
A specific group of butyrate producers responded to RS2 intervention.
Since the production of butyrate is attributed a key role in the health benefits of RS (15) and was further revealed to be a key response to RS2 intervention in previous studies, we took a detailed look on all major pathways and the associated taxonomy of this functional group of bacteria (Fig. 5). In the colon, butyrate is primarily formed by the carbohydrate-fueled acetyl-CoA pathway, with butyryl-coenzyme A (CoA):acetate CoA-transferase (butyrate transferase [but]) and butyrate kinase (buk) as terminal enzymes; other terminal enzymes are usually low in abundance and play a minor role (20, 21). Production routes based on proteins are described as well, although their abundances are comparatively low (20). In this study, genes encoding the main acetyl-CoA pathway were elevated in 10 individuals upon RS2 intervention (+6.2% ± 3.5%; participant 9 [P9] −4.3% and participant 12 [P12], −0.05%), which was governed by bacteria exhibiting but (+5.4% ± 3.6% [excluding P9]) associated with the Ruminococcaceae bacterium F. prausnitzii (raw P < 0.05) and E. rectale (raw P < 0.1), a member of the Lachnospiraceae (Fig. 5). Additional abundant but-containing Lachnospiraceae, specifically Roseburia spp., did increase in several individuals as well, and, overall, the abundance of pathway genes linked to this family significantly increased by +3.0% ± 4.4% (Data Set S4). Taxa associated with buk and other terminal enzymes of the acetyl-CoA pathway did not respond to RS2. Genes linked to the lysine pathway declined with high RS2 doses (−1.4% ± 1.7%), mainly due to a decrease in Alistipes and Flavonifractor spp.; other protein-fed pathways (4-aminobuytrate and glutarate) were only detected at low concentrations and did not change during the intervention (Data Set S4). The results are in accordance with phylogenetics-based data presented in Fig. 2, and no significant differences between intervention orders were obtained.
FIG 5.
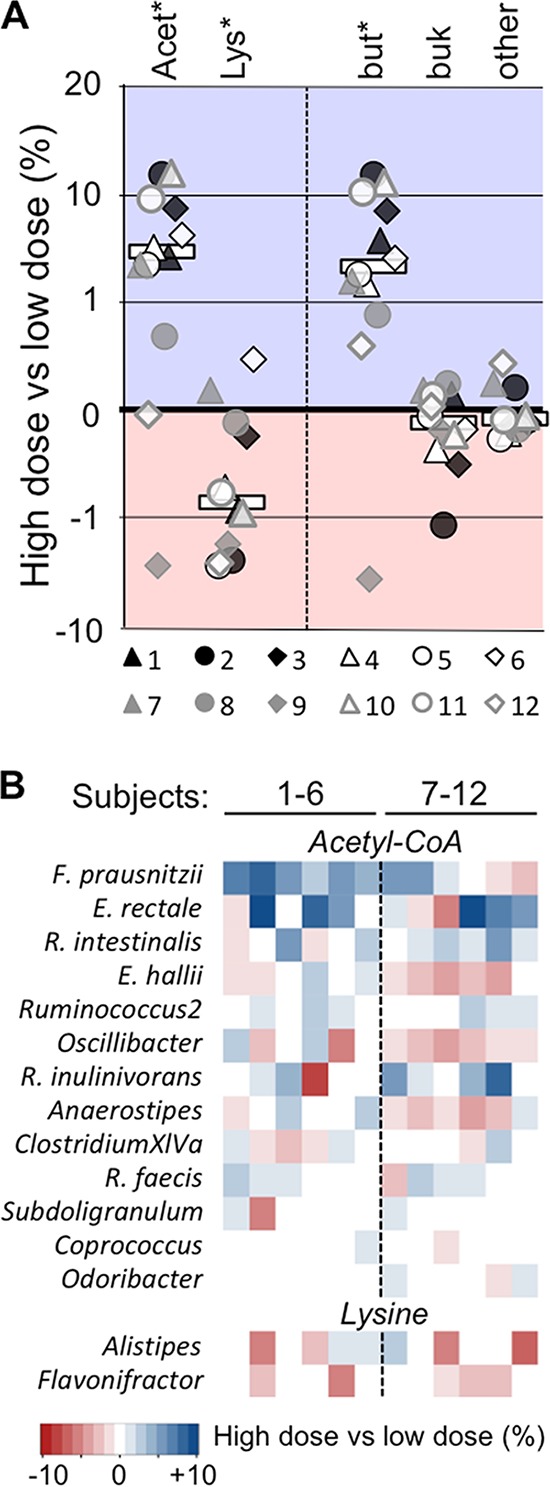
Detailed analysis of the butyrate-producing potential during RS2 intervention. (A) Abundance changes in both the dominant acetyl-CoA pathway (Acet) and the lysine pathway (Lys) comparing results from samples derived from high-RS2 diets with those from low-RS2 diets. Abundance changes of genes encoding terminal enzymes of the acetyl-CoA pathway, namely butyrate transferase (but), butyrate kinase (buk), and others are shown as well. Results for individual subjects as well as median changes (all subjects; white bars) are displayed. (B) Taxonomic affiliations of the two pathways. Asterisks illustrate significant differences (P < 0.05) based on FDR-corrected Wilcoxon signed-rank tests. Results exceeding values from the color bar were scaled to ±10%. Subjects 1 to 6 received the high-RS2 diet, followed by the low-RS2 diet, whereas individuals 7 to 12 consumed the diets in the alternate order.
DISCUSSION
In this study, we provide detailed insights into the functional structure of gut microbiota during dietary resistant starch intervention using metagenomic analyses. The overall results are largely in accordance with previously published multiomics data (19), which indicated an increase in Firmicutes at the expense of Bacteroidetes and elevated levels of proteins catalyzing the production of the short-chain fatty acids (SCFAs) acetate and butyrate at diets high in RS2 (see Data Set S5). Additional detailed insights into potential functions involved and associated key taxa were revealed, complementing the understanding of gut microbiota functional responses to RS2 intake. We set the obtained results in a mechanistic framework outlined in Fig. 6A proposing that primary degradation was governed by Firmicutes, primarily R. bromii, which led to increased concentrations of the SCFAs acetate and butyrate and promoted the growth of H2-scavenging bacteria. Previous studies support specific parts of the proposed model, such as increases in acetate and butyrate concentrations after the administration of RS2 (12, 22), enrichment for certain butyrate-producing taxa (9, 12), and R. bromii as a principal RS2 primary degrader (10, 13). Metagenomics only targets the functional potential; however, certain key elements, such as butyrate production and H2 scavenging pathways, represent core metabolic routes, and gene abundance can serve as a proxy for function (23); metaproteomics supported those findings (Data Set S5). Although R. bromii and its associated genes encoding starch-degrading enzymes were, overall, not significantly elevated in diets high in RS2, we included those features in the model, as our data support its proposed role in governing RS2 degradation. The taxon constituted major fractions of key genes for RS2 degradation and displayed the most increases with high-RS2 diets in respective subjects (Fig. 4). A decline in pH is documented to influence gut bacteria, specifically reducing the growth of Gram negatives (24), and we postulate that increased fermentation and formation of SCFAs during RS2 degradation lowered the pH, further affecting community composition, where pH-sensitive Gram-negative Bacteroidetes declined, whereas the growth of Gram positives, including butyrate producers, increased. Community alterations did not rely on intervention order, demonstrating that the gained features for microbiota at high doses of RS2 are quickly reversed after reducing the supply, which is in accordance with previous dietary intervention studies (9, 11). Thus, a constant source of RS2 is required to sustain its microbe-derived health benefits.
FIG 6.
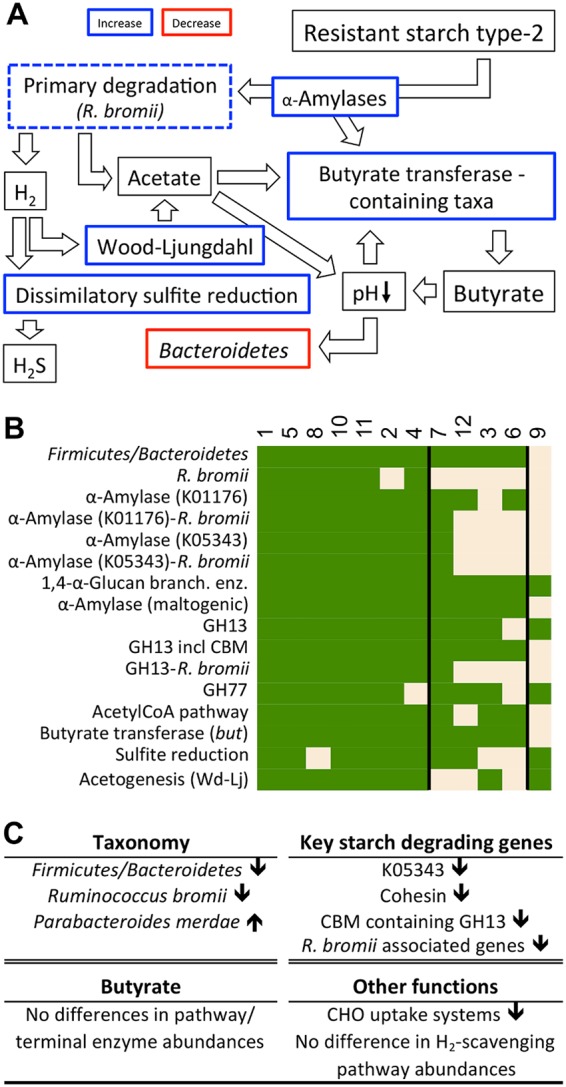
A mechanistic model on functional responses of gut communities upon RS2 intervention. (A) Major steps of the model, where thick colored lines represent results obtained in this study, whereas postulated events based on observations from previous studies are given in black-lined boxes. Although R. bromii and associated genes overall did not significantly differ between the two diets (dashed lines), those features were included due to the proposed role of this taxon as a key primary degrader of RS2 (for additional explanations, see the text). (B) Detailed responses of individual participants (participant numbers are at the top) on major steps outlined in our model, where the color green refers to an increase at high-RS2 diets within an individual. Seven participants displayed all features of the proposed response pattern, whereas four individuals (3, 6, 7, and 12) showed mixed behaviors, and one subject (9) was unresponsive. (C) Major potential functions discriminating non/mixed responders (excluding subject 7) from responders at low doses of RS2. GH, glycoside hydrolase; CBM, carbohydrate-binding module; Glucan branch. enz., glucan-branching enzyme; Wd-Lj, Wood-Ljungdahl.
Distinct individual responses were detected, where only seven of 12 participants displayed at least 15 of the 16 total selected features, whereas four individuals showed mixed behaviors, and one subject was considered unresponsive (Fig. 6B). Varied responses between subjects are in accordance with previous studies (11, 12). Functional community structures with diets low in RS2 from individuals who displayed the complete response pattern formed a cluster in ordination analysis distinct from other subjects and showed increased Bray-Curtis dissimilarities between diets (Fig. 3A), suggesting that initial (referring to samples low in RS2) differences in the functional potential governed behavior during RS2 intervention. Several features associated with RS2 degradation were discriminating those subjects from non/mixed responders, such as higher abundances of the maltose alpha-d-glucosyltransferase/alpha-amylase (K05343), cohesion, which is required for scaffolding of extracellular carbohydrate active enzymes, and carbohydrate-binding molecule (CBM) containing GH13 (Fig. 6C; subject 7 was excluded from analyses, as its functional community clustered uniquely [Fig. 3A]). Concentrations of other alpha-amylases K00176 and K01208, the glycan-branching enzyme K00700, and total GH13 did not significantly differ between the groups; however, all respective genes affiliated with R. bromii were enriched in the subjects who showed a full response (Fig. 6C). Additionally, several carbohydrate transporters were elevated in those individuals. Neither the butyrate-producing potential nor abundances of H2-scavenging pathways differed between groups (an overview of all significantly different features is given in Data Set S6).
Genes encoding key enzymes involved in starch degradation were increased with high RS2 intake, specifically those associated with R. bromii and various butyrate producers. Since dense clusters of many extracellular amylases termed “amylosomes” rather than specifically adapted enzymes are proposed to act on resistant starch (25), it is difficult to distinguish key primary degraders from the taxa involved in downstream degradation steps. In vitro experiments highlight the inability of various starch degraders, including the butyrate producer E. rectale, to act on its resistant forms, whereas partly degraded products provided by R. bromii promoted their growth (13). Roseburia spp. were shown to act on more easily accessible amylopectin potato starch, whereas F. prausnitzii failed to grow (26). Hence, it is likely that butyrate producers are not directly involved in the primary degradation of RS2, supporting R. bromii as a keystone degrader that showed little redundancy in this specific feature with other gut bacteria in our study. In all seven responders, this bacterium increased to high concentrations during RS2 intervention (including a close relative revealed in two subjects), and no other candidates that perform similarly were observed; B. adolescentis did not play a significant role. Although we detected an increase in the butyrate-producing potential in three individuals lacking this taxon, the overall degradation signatures were weaker.
The increase in butyrate producers upon administration of high doses of RS2 was governed by butyrate-transferase-containing bacteria that rely on acetate as a cosubstrate for proliferation. Taxa exhibiting this enzyme are net-acetate consumers and show high sensitivity to extracellular acetate concentrations during growth in vitro (27). Our data suggest that RS2 is suspending limitations from two ends, providing both fermentation substrates and an acetate-rich environment supporting the growth of those taxa. Various butyrate producers associated with distinct genera/families responded to RS2 treatment, indicating a high functional redundancy and demonstrating the importance of function-based analyses to obtain a comprehensive overview of mechanisms underlying RS2 degradation. Next to an elevated acetate production potential via the Wood-Ljungdahl pathway from H2 and CO2, an increase in genes encoding the major reductive route via phosphate acetyltransferase and acetate kinase was detected as well. Higher substrate fluxes via that route are indeed most likely during high doses of RS2, which is supported by the proteomics results (Data Set S5); however, increases in gene abundances are not determinative, as most gut bacteria are equipped with that pathway (21). Pathways for propionate synthesis, namely, the succinate pathway, primarily used by Bacteroides, and the propanediol route (found in specific Firmicutes) (28), did not significantly change, which is supported by previous work that revealed only acetate and butyrate to be elevated upon RS2 treatment (12, 22).
We did not detect alterations in TMA synthesis pathways in metagenomes despite increased TMAO plasma levels reported earlier (18). Expression-based analyses providing deep insights, such as metatranscriptomics, are needed in order to shed more light on this issue and reveal the associated bacterial key players. However, our data suggest elevated concentrations of H2S, a toxic gas associated with inflammatory conditions (29, 30), with high RS2 doses, supporting the observation that RS2 promotes some health-deteriorating metabolites of microbiota. More work is needed to develop precision interventions that uncouple the production of those metabolites from beneficial features of gut microbiota stimulated by RS2 in order to obtain optimal outcomes.
Conclusions.
Our results suggest that the primary degradation of RS2 was largely governed by features linked to Firmicutes, including R. bromii as a main taxon, that initiated a cascade of reactions leading to profound community alterations with increased levels of fermentation end products, specifically butyrate, to which health benefits have been ascribed. Some subjects showed mixed/no responses, and synbiotics that aim to deliver both growth-promoting substrates and respective primary degraders might be an appropriate approach to promote complete responsiveness in those individuals.
MATERIALS AND METHODS
Intervention study outline.
Fecal samples from 12 individuals were selected for metagenomic analysis from a larger controlled randomized crossover dietary intervention study testing the metabolic effects of diets high in RS2 (18, 19). Six participants (no. 1 to 6) consumed diets low in RS2 (3 g daily for 2 weeks), followed by diets high in RS2 (48 g daily for 2 weeks), separated by a 2-week washout period that consisted of their usual diets (7 days) and a low-carbohydrate maintenance diet (7 days), whereas the other half (participants 7 to 12) consumed these diets in the reverse order. Stool samples were collected at the end of each intervention. For more details on the diets and subject characteristics, see references 18 and 19). The study protocol was approved by the institutional review board of the Children's Hospital and Research Center of Oakland. All participants gave written informed consent to take part in the study. The study protocols were approved by the Human Subjects Committee of both Children's Hospital Oakland Research Institute and the Lawrence Berkeley National Laboratory.
DNA extraction, sequencing, and metagenomic analysis.
DNA from samples was extracted using the Mo Bio PowerSoil DNA extraction kit, with additional heat lysis for 5 min at 60°C (Mo Bio Laboratories, Carlsbad, CA), and sequenced on the Illumina HiSeq 2000 system (150-bp paired-end [PE] reads and 400-bp insert size). Raw reads (2.35 × 10⁷ ± 4.55 × 10⁶) were filtered and adapters removed using Trimmomatic (version 0.33) (31), with the following default parameters: removing adapters (2 maximum seed mismatches, 30 score threshold for palindrome removal, and minimum score threshold of 10 for removing adapter), removing leading low-quality or N bases below quality 3, removing trailing low-quality bases below quality 3, scanning the read with a 4-base-wide sliding window, trimming when the average quality per base drops below 15, and removing reads <36 bases in length. Filtered reads were assembled using Megahit (version 1.0.6-3-gfb1e59b) (32), with the following parameters: –kmin-1pass and –presents meta-large. The assembled contigs were uploaded to MG-RAST (33) for open reading frame (ORF) calling and were subsequently annotated against the KEGG gene database (2017-02-20) containing 21,480,820 genes and 20,634 KOs (34). On average, 73.1% ± 4.7% of the reads mapped to contigs using Bowtie2 (version 2.2.9) (35), and abundance of contigs was estimated by calculating the median coverage (counts). Between-sample normalization by the sum of their counts was performed before the analyses. Further, translated ORFs were subjected to dbCAN (version 5) to predict CAZymes relevant for RS2 degradation, according to the developer's instructions (36). Taxonomic analysis was performed using MetaPhlAn version 2.0 (in default mode) (37).
Specific analyses of butyrate-producing communities were performed according to Vital et al. (20). In brief, an updated reference database (38) that encompasses all genes of the four major butyrate synthesis pathways, together with respective gene sequences from metagenomes obtained via gene-targeted assemblies using RDP's Xander (default mode) (39), was subjected to complete-linkage clustering (95% nucleotide similarity) (40) to establish a butyrate-specific gene catalogue. The three housekeeping genes rplB, recA, and pyrG were included in the procedures (20). Reads were mapped to this catalogue using bowtie2, and pathway abundances were calculated from the mean abundances of respective genes normalized to the three housekeeping genes. Individual taxa were merged on the genus level except for abundant Roseburia and Lachnospiraceae incertae sedis, whose species displayed high phylogenetic distances; for genera containing only one species, the species name is given. Taxon abundances were calculated from median gene abundances, where all respective pathway genes had to be detected (>90% of reads used for total pathway calculations were assigned a taxonomy).
Trimethylamine-producing pathways were analyzed by using blastn (BLAST 2.4.0+ [41]) searching reads against the reference database, according to Rath et al. (42).
Statistical analyses.
Wilcoxon signed-rank tests (wilcox.test, paired = TRUE) with FDR correction (fdrtools) were performed in R (version 3.3.3) to test for differences between the two diets, whereas comparisons between responders and non/mixed responders with low-RS2 diets were done using QIIME (bootstrap_mann_whitney_u) (43); for testing differences in Bray-Curtis dissimilarities between the two groups, the Student t test was applied in R. An FDR-corrected P value of <0.05 was considered a significant result (for KOs, a q-value of <0.05 was applied [fdrtools]). Before testing, data sets were filtered for features detected in ≥25% of samples (= six samples; for comparisons of samples derived only from low-RS2 diets, this cutoff was raised to 50%). The following additional cutoffs (average abundance) were applied: KOs, 10 counts; KEGG modules, 50 counts; KEGG pathways, 100 counts; MetaPhlAn, 0.1% of total community; butyrate taxa, 0.1% of total butyrate-producing community; taxonomic affiliations of genes encoding key RS2-degrading enzymes (1% of all bacteria exhibiting the gene). Heatmaps (gplots) and nonmetric multidimensional scaling analysis and construction of the dendrogram (vegan using Bray-Curtis dissimilarity) were performed in R (version 3.3.3). For taxonomic (MetaPhlAn2) and butyrate-specific analyses, abundance changes from low- to high-RS2 diets, i.e., results from the low-RS2 diet subtracted from results of the high-RS2 diet, are given, whereas relative changes are given for KEGG- and CAZyme-based results (Fig. 3), as those analyses involved different levels (pathways, modules, and KOs), which does not allow for meaningful comparisons based on abundance data.
Data availability.
Raw sequences were submitted to the European Nucleotide Archive (ENA) under accession number PRJEB25954.
Supplementary Material
ACKNOWLEDGMENTS
Financial support was provided by NIH Human Microbiome Project Demonstration Project (grant UH3 DK083993); the Office of Science, U.S. Department of Energy (grant DE-FG02-98ER62678); the NIH (grant DK086472); NIH National Center for Advancing Translational Sciences, UCSF Clinical and Translational Science Unit (grant UL1 TR000004); the Microbiomes in Transition Initiative under the Laboratory Directed Research and Development Program at PNNL (PNNL is a multiprogram national laboratory operated for DOE by Battelle Memorial Institute under contract DE-AC06-76RL01830); the Helmholtz Association's Initiatives on Personalized Medicine (iMed) and Aging and Metabolic Programming (AMPro); and the Centre for Individualized Infection Medicine (CIIM).
We thank Colin Brislawn and Marianna Lucio for their assistance in accessing data from reference 19.
We declare no conflicts of interest.
Footnotes
Supplemental material for this article may be found at https://doi.org/10.1128/AEM.01562-18.
REFERENCES
- 1.De Filippo C, Cavalieri D, Di Paola M, Ramazzotti M, Poullet JB, Massart S, Collini S, Pieraccini G, Lionetti P. 2010. Impact of diet in shaping gut microbiota revealed by a comparative study in children from Europe and rural Africa. Proc Natl Acad Sci U S A 107:14691–14696. doi: 10.1073/pnas.1005963107. [DOI] [PMC free article] [PubMed] [Google Scholar]
- 2.Wu GD, Chen J, Hoffmann C, Bittinger K, Chen YY, Keilbaugh S, Bewtra M, Knights D, Walters W, Knight R, Sinha R, Gilroy E, Gupta K, Baldassano R, Nessel L, Li H, Bushman FD, Lewis JD. 2011. Linking long-term dietary patterns with gut microbial enterotypes. Science 334:105–108. doi: 10.1126/science.1208344. [DOI] [PMC free article] [PubMed] [Google Scholar]
- 3.Macfarlane S, Macfarlane GT. 2003. Regulation of short-chain fatty acid production. Proc Nutr Soc 62:67–72. doi: 10.1079/PNS2002207. [DOI] [PubMed] [Google Scholar]
- 4.Zhao L, Zhang F, Ding X, Wu G, Lam YY, Shi Y, Shen Q, Dong W, Liu R, Ling Y, Zeng Y, Wang X, Zhang Q, Wang J, Wang L, Wu Y, Zeng B, Wei H, Zhang M, Peng Y, Zhang C. 2018. Gut bacteria selectively promoted by dietary fibers alleviate type 2 diabetes. Science 1156:1151–1156. doi: 10.1126/science.aao5774. [DOI] [PubMed] [Google Scholar]
- 5.Gibson GR, Roberfroid MB. 1995. Dietary modulation of the human colonic microbiota: introducing the concept of prebiotics. J Nutr 125:1401–1412. [DOI] [PubMed] [Google Scholar]
- 6.Flint HJ, Duncan SH, Louis P. 2017. The impact of nutrition on intestinal bacterial communities. Curr Opin Microbiol 38:59–65. doi: 10.1016/j.mib.2017.04.005. [DOI] [PubMed] [Google Scholar]
- 7.Nugent AP. 2005. Health properties of resistant starch. Nutr Bull 30:27–54. doi: 10.1111/j.1467-3010.2005.00481.x. [DOI] [Google Scholar]
- 8.Abell GCJ, Cooke CM, Bennett CN, Conlon MA, McOrist AL. 2008. Phylotypes related to Ruminococcus bromii are abundant in the large bowel of humans and increase in response to a diet high in resistant starch. FEMS Microbiol Ecol 66:505–515. doi: 10.1111/j.1574-6941.2008.00527.x. [DOI] [PubMed] [Google Scholar]
- 9.Martínez I, Kim J, Duffy PR, Schlegel VL, Walter J. 2010. Resistant starches types 2 and 4 have differential effects on the composition of the fecal microbiota in human subjects. PLoS One 5:e15046. doi: 10.1371/journal.pone.0015046. [DOI] [PMC free article] [PubMed] [Google Scholar]
- 10.Walker AW, Ince J, Duncan SH, Webster LM, Holtrop G, Ze X, Brown D, Stares MD, Scott P, Bergerat A, Louis P, McIntosh F, Johnstone AM, Lobley GE, Parkhill J, Flint HJ. 2011. Dominant and diet-responsive groups of bacteria within the human colonic microbiota. ISME J 5:220–230. doi: 10.1038/ismej.2010.118. [DOI] [PMC free article] [PubMed] [Google Scholar]
- 11.Salonen A, Lahti L, Saloja J, Holtrop G, Korpela K, Duncan SH, Date P, Farquharson F, Johnstone AM, Lobley GE, Louis P, Flint HJ, de Vos WM. 2014. Impact of diet and individual variation on intestinal microbiota composition and fermentation products in obese men. ISME J 8:2218–2230. doi: 10.1038/ismej.2014.63. [DOI] [PMC free article] [PubMed] [Google Scholar]
- 12.Venkataraman A, Sieber JR, Schmidt AW, Waldron C, Theis KR, Schmidt TM. 2016. Variable responses of human microbiomes to dietary supplementation with resistant starch. Microbiome 4:33. doi: 10.1186/s40168-016-0178-x. [DOI] [PMC free article] [PubMed] [Google Scholar]
- 13.Ze X, Duncan SH, Louis P, Flint HJ. 2012. Ruminococcus bromii is a keystone species for the degradation of resistant starch in the human colon. ISME J 6:1535–1543. doi: 10.1038/ismej.2012.4. [DOI] [PMC free article] [PubMed] [Google Scholar]
- 14.Wu GD, Compher C, Chen EZ, Smith SA, Shah RD, Bittinger K, Chehoud C, Albenberg LG, Nessel L, Gilroy E, Star J, Weljie AM, Flint HJ, Metz DC, Bennett MJ, Li H, Bushman FD, Lewis JD. 2014. Comparative metabolomics in vegans and omnivores reveal constraints on diet-dependent gut microbiota metabolite production. Gut 65:63–72. [DOI] [PMC free article] [PubMed] [Google Scholar]
- 15.Brouns F, Kettlitz B, Arrigoni E. 2002. Resistant starch and “the butyrate revolution.” Trends Food Sci Technol 13:251–261. doi: 10.1016/S0924-2244(02)00131-0. [DOI] [Google Scholar]
- 16.Smith PM, Howitt MR, Panikov N, Michaud M, Gallini CA, Bohlooly YM, Glickman JN, Garrett WS. 2013. The microbial metabolites, short-chain fatty acids, regulate colonic Treg cell homeostasis. Science 341:569–573. doi: 10.1126/science.1241165. [DOI] [PMC free article] [PubMed] [Google Scholar]
- 17.Human Microbiome Project Consortium. 2012. Structure, function and diversity of the healthy human microbiome. Nature 486:207–214. doi: 10.1038/nature11234. [DOI] [PMC free article] [PubMed] [Google Scholar]
- 18.Bergeron N, Williams PT, Lamendella R, Faghihnia N, Grube A, Li Xinmin, Wang Z, Rob K, Jansson JK, Hazen SL, Krauss RM. 2016. Diets high in resistant starch increase plasma levels of trimethylamine-N-oxide, a gut microbiome metabolite associated with CVD risk. Br J Nutr 116:2020–2029. doi: 10.1017/S0007114516004165. [DOI] [PMC free article] [PubMed] [Google Scholar]
- 19.Maier TV, Lucio M, Lee H, Verberkmoes NC, Brislawn CJ, Bernhardt J, Lamendella R, McDermott JE, Ackermann G, Knight R, Riedel K, Krauss RM, Schmitt-Kopplin P, Jansson K. 2017. Impact of dietary resistant starch on the human gut microbiome, metaproteome, and metabolome. mBio 8:e01343-. doi: 10.1128/mBio.01343-17. [DOI] [PMC free article] [PubMed] [Google Scholar]
- 20.Vital M, Karch A, Pieper DH. 2017. Colonic butyrate-producing communities in humans: an overview using omics data. mSystems 2:e00130-. doi: 10.1128/mSystems.00130-17. [DOI] [PMC free article] [PubMed] [Google Scholar]
- 21.Louis P, Flint HJ. 2017. Formation of propionate and butyrate by the human colonic microbiota. Environ Microbiol 19:29–41. doi: 10.1111/1462-2920.13589. [DOI] [PubMed] [Google Scholar]
- 22.Hald S, Schioldan AG, Moore ME, Dige A, Laerke HN, Agnholt J, Knudsen KEB, Hermansen K, Marco ML, Gregersen S, Dahlerup JF. 2016. Effects of arabinoxylan and resistant starch on intestinal microbiota and short-chain fatty acids in subjects with metabolic syndrome: a randomised crossover study. PLoS One 11:e0159223. doi: 10.1371/journal.pone.0159223. [DOI] [PMC free article] [PubMed] [Google Scholar]
- 23.Kettle H, Louis P, Holtrop G, Duncan SH, Flint HJ. 2015. Modelling the emergent dynamics and major metabolites of the human colonic microbiota. Environ Microbiol 17:1615–1630. doi: 10.1111/1462-2920.12599. [DOI] [PubMed] [Google Scholar]
- 24.Duncan SH, Louis P, Thomson JM, Flint HJ. 2009. The role of pH in determining the species composition of the human colonic microbiota. Environ Microbiol 11:2112–2122. doi: 10.1111/j.1462-2920.2009.01931.x. [DOI] [PubMed] [Google Scholar]
- 25.Ze X, David Ben Y, Laverde-Gomez JA, Dassa B, Sheridan PO, Duncan SH, Louis P, Henrissat B, Juge N, Koropatkin NM, Bayer EA, Flint HJ. 2015. Unique organization of extracellular amylases into amylosomes in the resistant starch-utilizing human colonic Firmicutes bacterium Ruminococcus bromii. mBio 6:e01058-15. doi: 10.1128/mBio.01058-15. [DOI] [PMC free article] [PubMed] [Google Scholar]
- 26.Scott KP, Martin JC, Duncan SH, Flint HJ. 2014. Prebiotic stimulation of human colonic butyrate-producing bacteria and bifidobacteria, in vitro. FEMS Microbiol Ecol 87:30–40. doi: 10.1111/1574-6941.12186. [DOI] [PubMed] [Google Scholar]
- 27.Duncan SH, Barcenilla A, Stewart CS, Pryde SE, Flint HJ. 2002. Acetate utilization and butyryl coenzyme A (CoA):acetate-CoA transferase in butyrate-producing bacteria from the human large intestine. Appl Environ Microbiol 68:5186–5190. doi: 10.1128/AEM.68.10.5186-5190.2002. [DOI] [PMC free article] [PubMed] [Google Scholar]
- 28.Reichardt N, Duncan SH, Young P, Belenguer A, McWilliam Leitch C, Scott KP, Flint HJ, Louis P. 2014. Phylogenetic distribution of three pathways for propionate production within the human gut microbiota. ISME J 8:1323–1335. doi: 10.1038/ismej.2014.14. [DOI] [PMC free article] [PubMed] [Google Scholar]
- 29.Devkota S, Wang Y, Musch MW, Leone V, Fehlner-Peach H, Nadimpalli A, Antonopoulos DA, Jabri B, Chang EB. 2012. Dietary-fat-induced taurocholic acid promotes pathobiont expansion and colitis in Il10−/− mice. Nature 487:104–108. doi: 10.1038/nature11225. [DOI] [PMC free article] [PubMed] [Google Scholar]
- 30.Ohge H, Furne JK, Springfield J, Rothenberger D, Madoff RD, Levitt MD. 2005. Association between fecal hydrogen sulfide production and pouchitis. Dis Colon Rectum 48:469–475. doi: 10.1007/s10350-004-0820-8. [DOI] [PubMed] [Google Scholar]
- 31.Bolger AM, Lohse M, Usadel B. 2014. Trimmomatic: a flexible trimmer for Illumina sequence data. Bioinformatics 30:2114–2120. doi: 10.1093/bioinformatics/btu170. [DOI] [PMC free article] [PubMed] [Google Scholar]
- 32.Li D, Liu C, Luo R, Sadakane K, Lam T. 2015. MEGAHIT: an ultra-fast single-node solution for large and complex metagenomics assembly via succinct de Bruijn graph. Bioinformatics 31:1674–1676. doi: 10.1093/bioinformatics/btv033. [DOI] [PubMed] [Google Scholar]
- 33.Meyer F, Paarmann D, Souza MD, Olson R, Glass EM, Kubal M, Paczian T, Rodriguez A, Stevens R, Wilke A, Wilkening J, Edwards RA. 2008. The metagenomics RAST server—a public resource for the automatic phylogenetic and functional analysis of metagenomes. BMC Bioinformatics 8:386. doi: 10.1186/1471-2105-9-386. [DOI] [PMC free article] [PubMed] [Google Scholar]
- 34.Kanehisa M, Sato Y, Kawashima M, Furumichi M, Tanabe M. 2016. KEGG as a reference resource for gene and protein annotation. Nucleic Acids Res 44:D457–D462. doi: 10.1093/nar/gkv1070. [DOI] [PMC free article] [PubMed] [Google Scholar]
- 35.Langmead B, Salzberg SL. 2012. Fast gapped-read alignment with Bowtie 2. Nat Methods 9:357–359. doi: 10.1038/nmeth.1923. [DOI] [PMC free article] [PubMed] [Google Scholar]
- 36.Yin Y, Mao X, Yang J, Chen X, Mao F, Xu Y. 2012. dbCAN: a web resource for automated carbohydrate-active enzyme annotation. Nucleic Acids Res 40:W445–W451. doi: 10.1093/nar/gks479. [DOI] [PMC free article] [PubMed] [Google Scholar]
- 37.Segata N, Waldron L, Ballarini A, Narasimhan V, Jousson O, Huttenhower C. 2012. Metagenomic microbial community profiling using unique clade-specific marker genes. Nat Methods 9:811–814. doi: 10.1038/nmeth.2066. [DOI] [PMC free article] [PubMed] [Google Scholar]
- 38.Vital M, Howe AC, Tiedje JM. 2014. Revealing the bacterial butyrate synthesis pathways by analyzing (meta) genomic data. mBio 5:e00889-14. doi: 10.1128/mBio.00889-14. [DOI] [PMC free article] [PubMed] [Google Scholar]
- 39.Wang Q, Fish JA, Gilman M, Sun Y, Brown CT, Tiedje JM, Cole JR. 2015. Xander: employing a novel method for efficient gene-targeted metagenomic assembly. Microbiome 3:32. doi: 10.1186/s40168-015-0093-6. [DOI] [PMC free article] [PubMed] [Google Scholar]
- 40.Cole JR, Wang Q, Fish JA, Chai B, McGarrell DM, Sun Y, Brown CT, Porras-Alfaro A, Kuske CR, Tiedje JM. 2014. Ribosomal Database Project: data and tools for high throughput rRNA analysis. Nucleic Acids Res 42:D633–D642. doi: 10.1093/nar/gkt1244. [DOI] [PMC free article] [PubMed] [Google Scholar]
- 41.Camacho C, Coulouris G, Avagyan V, Ma N, Papadopoulos J, Bealer K, Madden TL. 2009. BLAST+: architecture and applications. BMC Bioinformatics 9:421. doi: 10.1186/1471-2105-10-421. [DOI] [PMC free article] [PubMed] [Google Scholar]
- 42.Rath S, Heidrich B, Pieper DH, Vital M. 2017. Uncovering the trimethylamine-producing bacteria of the human gut microbiota. Microbiome 5:54. doi: 10.1186/s40168-017-0271-9. [DOI] [PMC free article] [PubMed] [Google Scholar]
- 43.Caporaso JG, Kuczynski J, Stombaugh J, Bittinger K, Bushman FD, Costello EK, Fierer N, Peña AG, Goodrich JK, Gordon JI, Huttley G, Kelley ST, Knights D, Koenig JE, Ley RE, Lozupone C, Mcdonald D, Muegge BD, Pirrung M, Reeder J, Sevinsky JR, Turnbaugh PJ, Walters W, Widmann J, Yatsunenko T, Zaneveld J, Knight R. 2010. QIIME allows analysis of high-throughput community sequencing data. Nat Methods 7:335–336. doi: 10.1038/nmeth.f.303. [DOI] [PMC free article] [PubMed] [Google Scholar]
Associated Data
This section collects any data citations, data availability statements, or supplementary materials included in this article.
Supplementary Materials
Data Availability Statement
Raw sequences were submitted to the European Nucleotide Archive (ENA) under accession number PRJEB25954.