Abstract
Objective:
Despite existing prognostic markers, breast cancer prognosis remains a difficult subject due to the complex relationships between many contributing factors and survival. This study seeks to integrate multiple clinicopathological and genomic factors with dimensional reduction across machine learning algorithms to compare survival predictions.
Methods:
This is a secondary analysis of the data from a prospective cohort study of female patients with breast cancer enrolled in the Molecular Taxonomy of Breast Cancer International Consortium (METABRIC). We constructed a series of predictive models: ensemble models (Gradient Boosting and Random Forest), support vector machine (SVM), and artificial neural networks (ANN) for 5-year survival based on clinicopathological and gene expression data after K-means clustering with K-nearest-neighbor (KNN) classification. Model performance was evaluated by receiver operating characteristic (ROC) curve, accuracy, and calibration slope (CS). Model stability was assessed over 10 random runs in terms of ROC, accuracy, CS, and variable importance.
Results:
The analytic cohort is composed of 1874 patients with breast cancer. Overall, the median age was 62 years; the 5-year survival rate was 75%. ROC and accuracy were not significantly different between models (ROC and accuracy around 0.67 and 0.72 across models, respectively). However, ensemble methods resulted in better fit (CS) with stable measures of variable importance across 10 random training/validation splits. K-means clustering of gene expression profiles on training data points along with KNN classification of validation data points was a robust method of dimensional reduction. Furthermore, the gene expression cluster with the highest mortality risk was an influential factor in model prediction.
Conclusions:
Using machine learning methods to construct predictive models for 5-year survival in patients with breast cancer, we demonstrated discrimination ability across models with new insight into the stability and utility of dimensional reduction on genomic features in breast cancer survival prediction.
Keywords: Breast cancer, survival, machine learning methods, prediction
Background
Breast cancer is the most common cancer among women worldwide.1 It remains one of the most prevalent health problems in the United States, with an annual incidence of 266,000 and 5-year mortality rate of 11.4%.2 There has been consistent effort throughout the past few decades to characterize the heterogeneity of disease and identify factors that contribute to treatment response and survival. Guidelines such as Nottingham Prognostic Index (NPI) based on clinicopathological features and prognostic panels based on gene markers such as Oncotype DX and MammaPrint have proven instrumental in guiding clinical decisions.3–6
With the development of economical sequencing technologies and computational methods to facilitate the analysis of big data, these prognostic tools may be refined at the present for precision and accuracy. While machine learning methods such as decision tree (DT), support vector machine (SVM), and artificial neural network (ANN) have been used in cancer research for the past two decades,7–9 they have gained traction in recent years as effective methods of generating predictive models that can delineate important factors in cancer heterogeneity, response, and survival.10 Ensemble methods such as Gradient Boosting and Random Forest, which aggregate multiple DTs to lower bias and variance, have also been successful in cancer classification.11 For feature preprocessing, dimensionality reduction methods, such as principal components analysis on known gene signatures and self-organizing map for clinicopathological features, have been found to improve the prediction of breast cancer survival.12,13 However, to our knowledge, there has yet to be a study that combines the predictive power of clinicopathological features and genomic features with dimension reduction methods, such as K-means clustering, to systematically examine performance across various machine learning models.
The goals of this study were to construct predictive models on 5-year breast cancer survival using four major nonlinear machine learning methods (Gradient Boosting, Random Forest, SVM, and ANN) and examine the utility of these models for incorporating different types of clinicopathological and genomic-based variables. We integrated clinicopathological data with gene expression data of a well-characterized prospective cohort (Molecular Taxonomy of Breast Cancer International Consortium (METABRIC))14 using a K-nearest-neighbor (KNN) classifier on genomic clusters determined by K-means. We compared the models in terms of classification accuracy, receiver operating characteristic (ROC) curves, goodness-of-fit by calibration slope (CS), and internal stability across 10 runs. Our secondary aims were to assess important contributors to survival, examine the utility of dimensional reduction for genomic data in survival prediction, and identify any subgroups of patients with higher mortality risks based on K-means clusters from dimensional reduction on gene expression profiles.
Methods
Study design
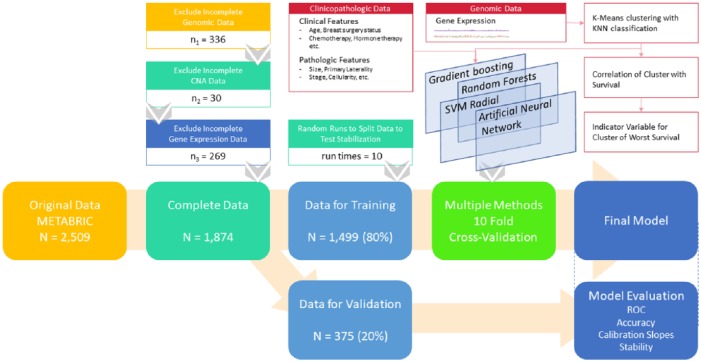
This is a secondary analysis of 2509 adult female participants with breast cancer in a prospective cohort study— METABRIC accessed from cBioPortal.15,16 The study setting comprises five academic centers within Canada and the United Kingdom. Detailed clinical information for a median 10-year follow-up period was measured, along with genomic data (copy number aberrations and gene expression) from fresh frozen tumor tissue. Original dataset includes study in 201214 and study in 2016.17 It contains a merged sample of 2509 patients, including 2506 breast cancer cases and 3 breast sarcoma cases. For METABRIC 2012, researchers collected a discovery set of 997 primary tumors and a validation set of 995 tumors from tumor banks in both Canada and the United Kingdom. For METABRIC 2016, researchers sequenced a total of 2433 primary tumors and 650 normal non-cancerous samples (including normal adjacent breast tissue (n = 532) and peripheral blood cells (n = 127)). In the current analysis, we excluded samples with either incomplete clinical or genomic data as we assume that the data are missing completely at random for this large cohort study. Genomic data in the form of copy number alteration (CNA) and gene expression levels were examined. After excluding 336 patients without complete genomic measurement results, 30 patients with incomplete CNA data and 269 patients without gene expression measurement data, 1874 patients were included in the following analysis (see Figure 1 for study scheme).
Figure 1.
Study scheme. KNN indicates K-nearest-neighbor; METABRIC, Molecular Taxonomy of Breast Cancer International Consortium; ROC, receiver operating characteristic; SVM, support vector machine.
Predictors and outcomes
We combined both clinicopathological features and genomic features to generate potential predictors for our models. Eighteen clinical and pathological features, including age at diagnosis, NPI, testing for estrogen receptor (ER), progesterone receptor (PR), human epidermal growth factor receptor (HER2) status, menopausal status, three-gene classifier subtype, degree of abnormality of cancer cells, primary tumor laterality, cellularity of tumor content, tumor size, tumor stage, breast surgery status, chemotherapy status, and hormone therapy status were included in the analysis.
Genomic predictors were processed through dimensionality reduction method in a supervised fashion using K-means, with clustering based on expression data of all targeted genes in the training set. For the validation set, we determined the cluster information for each individual based on nearest neighbors by applying KNN method to the training set with the number of neighbors set as 7. To assess for the stability of these clusters, we ran K-means using 10 random samples of training set and KNN classification on the respective validation sets from an 80-20 training/validation splits. The number of centroids in K-means was selected as k = 10 to emulate the number of genomic clusters found in METABRIC. The K-means cluster found to be most correlated with survival in the training set was then included as an indicator variable in the final set of predictors. The primary outcome was 5-year survival. Secondary outcome was overall survival (measured using the overall survival metric, median 10-year follow-up).
Statistical analysis
To predict survival outcome, a total of 27 features (including indicator variables) from the 18 clinicopathological features mentioned above and 1 genomic feature were used to construct the models. We trained a series of nonlinear machine learning methods with 10-fold cross-validation of the training set upon 10 random training/validation splits using Gradient Boosting (R package xgboost), Random Forest (R package randomForest), SVM with a radial basis (SVM, R package svm), and ANN (R package nnet). The 10 random training/validation splits included the same patients in each set as those for K-means clustering above. For each split, 80% of the analytic cohort were randomly selected as our training dataset. Model performance was examined in the remaining 20% validation dataset, by estimating ROC, accuracy, and CS.
Variable importance, computed by taking the difference between whole model accuracy and model accuracy after permuting each predictor variable, is calculated and scaled to a maximum value of 100 for the strongest predictor (R package caret). Confidence intervals for ROCs were measured using Delong method (R package pROC). CSs were calculated and graphed (R package gbm). Survival analysis was performed using Cox regression models to examine the association between derived clusters and survival outcome (R package survival). The log-rank test was performed to determine the significance of inter-cluster differences in survival.
Linear models for microarray data (LIMMA) with false discovery rate (FDR) correction was used to identify differentially expressed genes between a derived cluster with the worst survival and all other clusters. Pathway enrichment analysis using DAVID18 and co-expression network analysis was then performed to elucidate differentiating features in this high-risk cluster. We constructed a co-expression network at gene-level using GeneMANIA.19 The institutional review board of Massachusetts General Hospital waived review of the current analysis.
Results
The analysis cohort consisted of 1874 breast cancer patients with median age of 62 years (interquartile range (IQR) 51-71) and median NPI of 4. ER, PR, and HER2 status were positive in 76.6%, 53.0%, and 12.4% of patients, respectively. The overall 5-year survival rate was 75.2% (Table 1).
Table 1.
Summary of patient characteristics.
| Patient characteristics | Overall (n = 1874) |
|---|---|
| Age (year), median (IQR) | 62 (51-71) |
| NPI, median | 4 |
| Menopause | 78.3% |
| ER positive status | 76.6% |
| PR positive status | 53.0% |
| HER2-positive status | 12.4% |
| Three genes status, mode (%)a | 3 (32.3%) |
| Claudin subtypes, mode (%)b | 3 (35.7%) |
| Chemotherapy | 20.8% |
| Hormonal therapy | 61.7% |
| Radiotherapy | 60.3% |
| Surgery, mode (%) | 1 (59.1%) |
| Tumor size (mm), median (IQR) | 51.0 (30.3-63.0) |
| Tumor grade, median | 2 |
| Tumor stage, median | 3 |
| Laterality, mode (%) | −1 (49.3%) |
| Cellularity, median | 2 |
| Oncotree code, mode (%)c | 4 (79.1%) |
| Outcomes | |
| 5-year survival | 75.2% |
| 10-year survival | 47.7% |
| 15-year survival | 26.4% |
Table includes all clinicopathological features used in machine learning models.
Abbreviations: ER, estrogen receptor; HER2, human epidermal growth factor receptor; IQR, interquartile range; METABRIC, Molecular Taxonomy of Breast Cancer International Consortium; NPI, Nottingham Prognostic Index; PR, progesterone receptor.
Three genes status: ER, HER2, and Aurora kinase A (AURKA) activity.
Claudin (PAM50) subtypes: luminal A, luminal B, HER2-enriched, basal-like, and Claudin-low.
Oncotree code: tumor types based on Oncotree reported in METABRIC dataset.
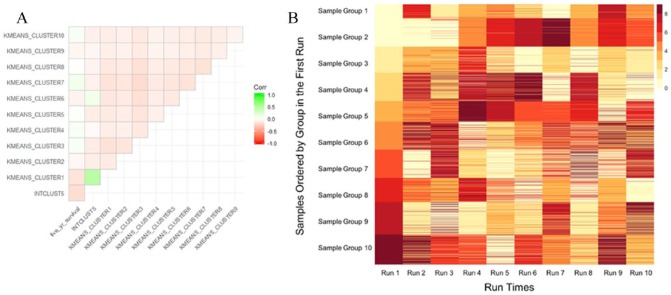
Correlation plot of K-means clusters with INTCLUST5 and survival for one random run shows one K-means cluster more positively correlated with INTCLUST5 and negatively correlated with survival compared with other clusters (Figure 2A). K-means clustering with KNN classification results in largely stable and reproducible grouping of patients, particularly in the group with worst survival (Figure 2B).
Figure 2.
(A) Correlation plot of K-means clusters for one random run with INTCLUST5 and 5-year survival. (B) Heatmap K-means clustering of training set and KNN classification of validation set over 10 random runs. Colors indicate group number across runs. Cluster groups are stable, particular for the group with worst survival (Group 1 in Run 1), as most patients classified into one particular group will be clustered into the same group for across repeated runs.
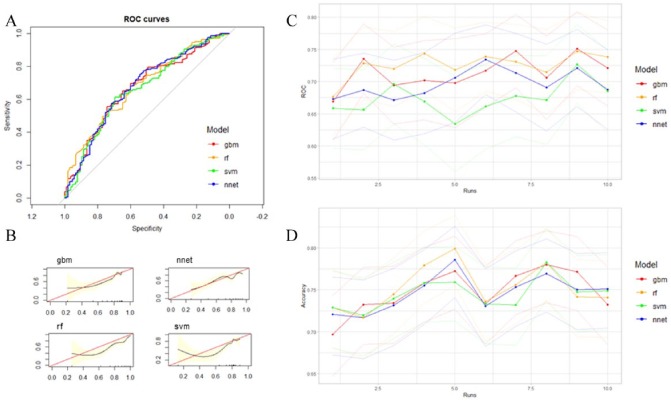
Among the machine learning methods constructed, no model performed significantly better than others as all 95% confidence intervals of ROC and accuracy across models overlapped (Table 2, Figure 3A, C, and D). CSs showed that Gradient Boosting consistently had good model fit compared with other models across runs (Figure 3B and Supplementary Figure 1).
Table 2.
Summary of model performances in terms of discrimination ability and accuracy for one run.
| Models | ROC (95% CI) | Accuracy (95% CI) |
|---|---|---|
| Gradient boosting | 0.669 (0.608, 0.730) | 0.697 (0.648, 0.743) |
| Random forest | 0.677 (0.617, 0.736) | 0.729 (0.681, 0.773) |
| SVM | 0.658 (0.596, 0.720) | 0.729 (0.681, 0.773) |
| ANN | 0.673 (0.611, 0.735) | 0.721 (0.672, 0.765) |
All models performed similarly across ROC and accuracy measures. See Supplementary Table 1 for performance across all runs.
Abbreviations: ANN, artificial neural network; CI, confidence interval; ROC, receiver operating characteristic; SVM, support vector machine.
Figure 3.
(A) Area under ROC curve of all prediction models based on clinicopathological features and genomic clusters from gene expression data from one run. (B) Calibration slopes (CSs) of all models from one run. See Supplementary Figure 1 for CS graphs for all nine other runs. (C) ROC curve (with 95% CI in lighter colors) and (D) accuracy (with 95% CI in lighter colors) of all models for 10 random training/validation splits. All models performed similarly in terms of ROC and accuracy. Performance measures were stable over 10 random runs, with all methods predicting 5-year survival better than random. ROC indicates receiver operating characteristic.
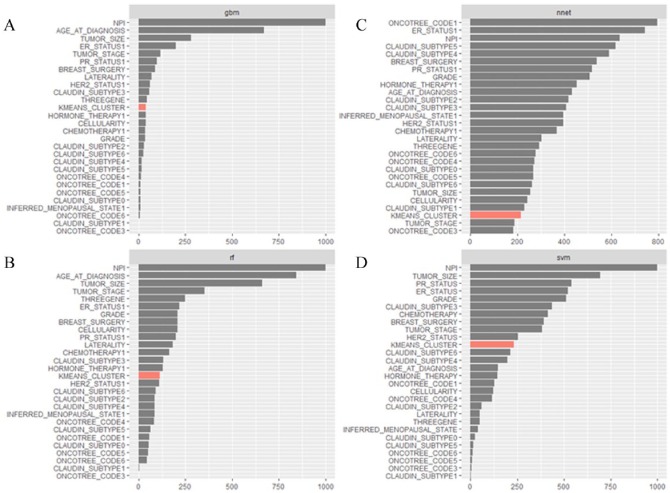
NPI, age, tumor stage and size, ER/PR/HER2 status, breast surgery status were important contributors to the models (Figure 4A to D shows the sum of variable importance for each variable across runs by model). NPI was the most important variable across all runs for Gradient Boosting, Random Forest, and SVM models. Genomic cluster by K-means was a moderately important factor for most models except ANN. ANN variables were the least stable across runs and resulted in less pronounced differences in the magnitudes of variable importance compared with the other models. Ensemble methods (Gradient Boosting and Random Forest) were more stable in the assignment of variable importance values across runs than SVM and ANN (see Supplementary Table 1 for individual variable importance values across runs for all four models).
Figure 4.
(A), (B), (C), and (D) Sum of variable importance values for all variables across 10 random runs, by model: Gradient Boosting (A), Random Forest (B), ANN (C), and SVM (D). All models besides ANN consistently chose NPI as the most important variable. Other important variables include tumor size and stage, ER/PR/HER2 status, and breast surgery status. K-means cluster with the worst survival was moderately important across models except for ANN. ANN was the most unstable model in terms of the values of variable importance assigned to each variable across runs. The x-axis denotes the sum of variable importance values across 10 random runs and may not exceed 1000, which is the sum for a variable that was the most important through all runs of a model.
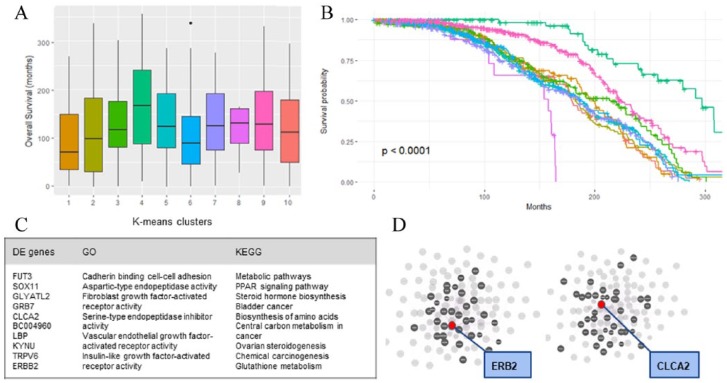
Survival analysis on one training/validation run revealed that the patterns of survival are significantly different between the derived clusters (Plog-rank < .0001) (Figure 5B). Cluster 1, which correlated with INTCLUST5 as mentioned above, had highest mortality risk (Figure 5A). Several other unique differences were found between derived genomic clusters. For example, compared with other clusters, patients in cluster 1 were younger with worse NPI and more HER2 positivity. LIMMA analysis further revealed 476 genes that are differentially expressed between cluster 1 and all other clusters, including the overexpression of both HER2 and CLCA2 within the top 11 differentially expressed genes (all FDR <.0001; Figure 5C).
Figure 5.
Boxplot of overall survival distribution by genomic clusters for one run (A) and survival curve of the same genomic clusters derived from gene expression (B). There was a significant difference in survival between the clusters (P < .001). (C) Summary of the top 11 differentially expressed genes, top gene ontology terms, and top Kyoto encyclopedia of genes and genomes (KEGG) pathways found from differentially expressed genes. (D) Network hub of the top 100 differentially expressed genes for highlighting ERB2 hub (left) and CLCA2 hub (right). Red dot indicates ERB2 (left) and CLCA2 (right); grey dots indicate genes connected to red dots via functional pathways.
Pathway analysis of the 476 differentially expressed genes showed an enrichment of metabolic pathways, including stimulation of steroid hormone biosynthesis and peroxisome proliferator-activated receptor (PPAR) signaling pathway, in cluster 1. Gene ontology revealed upregulation of genes involved in cadherin binding in cell-cell adhesion, fibroblast growth factor receptor activity, and vascular endothelial growth factor receptor (VEGF-R) activity (Figure 5C).
Finally, network analysis demonstrated that HER2 and CLCA2 are both independent hubs within the network of the top 100 differentially expressed genes, suggesting that separately relevant pathways co-occur within the cluster of patients with highest mortality risk and involve the upregulation of both HER2 and CLCA2 (Figure 5D).
Discussion
In this analysis of machine learning methods with dimensionality reduction in breast cancer survival prediction, we found that no model significantly outperformed others, although all models performed significantly better than null (ROC with 95% CI >0.50 across all runs). Gradient Boosting, in particular, produced stable models with similar variable importance values assigned to each variable, as well as good performance in terms of ROC, accuracy, and CS across 10 random runs. We found that NPI index, age, tumor stage and size, ER/PR/HER2 status, breast surgery status are clinical factors that consistently and strongly influence 5-year survival across repeated runs and across models. It has been well studied that the risk factors for cancer survival is a combination of genetic, epigenetic, and environmental factors.20,21 Indeed, these clinical features are already used as prognostic markers in breast cancer survival.22
Furthermore, we have provided a proof-of-concept that the method of using dimensionality reduction to generate clusters based on gene expression can represent genomic contributors with influence on survival in lower dimensions. Specifically, the method demonstrated in this study involves the construction of K-means clusters based on training set only, followed by KNN classification of validation set into the same clusters. Across repeated runs, K-means clustering is stable, with K-means/KNN algorithm consistently aggregating the same patients into groups. Moreover, among the 10 K-means clusters, we have found a cluster of patients who are significantly associated with worse 5-year-survival outcomes and with the worst survival cluster (INTCLUST5) from the initial METABRIC study. Subgroup-defining features for these patients involve an overexpression of HER2 and CLCA2.
The subject of machine learning methods comparison has been explored in the past few years. Delen et al23 have found that DTs can perform better than ANN for binary breast cancer survival prediction using clinicopathological variables, with accuracy of 93.6% compared for 91.2%. Montazeri et al24 have examined the performance of a variety of machine learning methods, including ANN, DT, Random Forest, and SVM, and have found that Random Forest technique performed the best using eight clinical predictors. Another study by Vanneschi et al25 examined machine learning techniques for breast cancer survival using gene signatures alone. Our study contributes to this landscape by systematically comparing machine learning methods using both clinicopathological and K-means clustering of genomic data in a large cohort study. Our findings suggest that while Ensemble methods (Gradient Boosting and Random Forest) do not significantly outperform other methods in terms of ROC and accuracy, they resulted in relatively good model fit (CS) across runs with more stable variable importance measures.
The finding that CLCA2 is overexpressed in the context of HER2 overexpression within the highest risk cluster suggests an interesting genetic phenotype. HER2 is a well characteristic breast cancer oncogene with targetable action by Trastuzumab,26 while CLCA2 is a chloride channel targeted by TP53 and is usually downregulated in the context of tumor proliferation.27 As both HER2 and CLCA2 function centrally within distinct network hubs, there may be benefits for further investigation into the molecular interactions between CLCA2 and HER2 pathways.
Our study has several potential limitations. First, the cohort study was initiated within years prior to the approval of Trastuzumab in 1998;28 thus, we saw within our dataset that HER2 was a negative prognostic factor. New survival data from more recent cohorts would likely be different, with HER2 having less impact on breast cancer survival. Second, as our study only included complete cases across all variables (ie, those without missing genomic information), there may be potential for selection bias. However, we do not believe this to be impactful as our analytic and nonanalytic cohorts displayed similar clinicopathological characteristics. Compared with previous studies using clinicopathological features to predict survival, our study has fewer sample sizes (on the order of thousands rather than hundred thousand). This disparity in sample size reduces the power of our study and may partly explain the lower ROCs achieved in this study compared with others (eg, ROC greater than 0.90). Finally, as we did not have normal tissue controls in this study, gene expression data could not be measured against baseline, which limits our understanding of the differential genes that are involved in the development of breast cancer between clusters. Despite this, the current analysis of between-cluster comparisons yielded a number of interesting differentially expressed genes for downstream analysis.
In this analysis of a well-characterized prospective cohort of 1874 patients with breast cancer, we found that nonlinear machine learning models (Gradient Boosting, Random Forest, SVM, and ANN) performed similarly well in breast cancer survival prediction, although Ensemble methods may offer more internal stability. Further analysis suggested that the influential variables contributing to prediction include NPI score, age, tumor stage and size, ER/PR/HER2 status, and breast surgery status. Gene expression cluster by K-means was a moderately influential factor. Within clusters, we found that one cluster with HER2 and CLCA2 overexpression was associated with the worst 5-year survival outcome. Our findings promote further investigation into the use of clinicopathological and genomic factors to identify high-risk patients, as well as exploration into the role of CLCA2 gene in high-risk HER2-positive patients.
Supplemental Material
Supplemental material, Supplemental_Material for Machine Learning With K-Means Dimensional Reduction for Predicting Survival Outcomes in Patients With Breast Cancer by Melissa Zhao, Yushi Tang, Hyunkyung Kim and Kohei Hasegawa in Cancer Informatics
Footnotes
Funding:The author(s) received no financial support for the research, authorship, and/or publication of this article.
Declaration of conflicting interests:The author(s) declared no potential conflicts of interest with respect to the research, authorship, and/or publication of this article.
Author Contributions: MZ, YT, HK, and KH contributed to conception and design of study. Analysis and interpretation of data was performed by MZ, YT, and KH. The manuscript was drafted by MZ, and edited by YT, HK, and KH. MZ, YT, HK, and KH all reviewed and approved of the final version of the manuscript.
ORCID iD: Melissa Zhao  https://orcid.org/0000-0002-5190-3635
References
- 1. Ferlay J, Soerjomataram I, Dikshit R, et al. Cancer incidence and mortality worldwide: sources, methods and major patterns in GLOBOCAN 2012. Int J Cancer. 2015;136:E359–E386. doi: 10.1002/ijc.29210. [DOI] [PubMed] [Google Scholar]
- 2. U.S. Cancer Statistics Working Group. United States Cancer Statistics: 1999–2014 Incidence and mortality web-based Report. Atlanta: U.S. Department of Health and Human Services, Centers for Disease Control and Prevention and National Cancer Institute, 2017, www.cdc.gov/uscs [Google Scholar]
- 3. Elston CW, Ellis IO. Pathological prognostic factors in breast cancer. I. The value of histological grade in breast cancer: experience from a large study with long-term follow-up. Histopathology. 1991;19:403–410. [DOI] [PubMed] [Google Scholar]
- 4. Galea MH, Blamey RW, Elston CE, Ellis IO. The Nottingham Prognostic Index in primary breast cancer. Breast Cancer Res Treat. 1992;22:207–219. [DOI] [PubMed] [Google Scholar]
- 5. Sparano JA, Gray RJ, Makower DF, et al. Prospective validation of a 21-gene expression assay in breast cancer. N Engl J Med. 2015;373:2005–2014. doi: 10.1056/NEJMoa1510764. [DOI] [PMC free article] [PubMed] [Google Scholar]
- 6. Cardoso F, van’t Veer LJ, Bogaerts J, et al. 70-gene signature as an aid to treatment decisions in early-stage breast cancer. N Engl J Med. 2016;375:717–729. doi: 10.1056/NEJMoa1602253. [DOI] [PubMed] [Google Scholar]
- 7. Maclin PS, Dempsey J, Brooks J, Rand J. Using neural networks to diagnose cancer. J Med Syst. 1991;15:11–19. [DOI] [PubMed] [Google Scholar]
- 8. Simes RJ. Treatment selection for cancer patients: application of statistical decision theory to the treatment of advanced ovarian cancer. J Chronic Dis. 1985;38:171–186. [DOI] [PubMed] [Google Scholar]
- 9. Cruz JA, Wishart DS. Applications of machine learning in cancer prediction and prognosis. Cancer Inform. 2007;2:59–77. [PMC free article] [PubMed] [Google Scholar]
- 10. Kourou K, Exarchos TP, Exarchos KP, Karamouzis MV, Fotiadis DI. Machine learning applications in cancer prognosis and prediction. Comput Struct Biotechnol J. 2015;13:8–17. doi: 10.1016/j.csbj.2014.11.005. [DOI] [PMC free article] [PubMed] [Google Scholar]
- 11. Tan AC, Gilbert D. Ensemble machine learning on gene expression data for cancer classification. Appl Bioinformat. 2003;2:S75–S83. [PubMed] [Google Scholar]
- 12. Zhao X, Rødland EA, Sørlie T, et al. Combining gene signatures improves prediction of breast cancer survival. PLoS ONE. 2011;6:e17845. doi: 10.1371/journal.pone.0017845. [DOI] [PMC free article] [PubMed] [Google Scholar]
- 13. Shukla N, Hagenbuchner M, Win KT, Yang J. Breast cancer data analysis for survivability studies and prediction. Comput Methods Programs Biomed. 2018;155:199–208. doi: 10.1016/j.cmpb.2017.12.011. [DOI] [PubMed] [Google Scholar]
- 14. Curtis C, Shah SP, Chin S-F, et al. The genomic and transcriptomic architecture of 2,000 breast tumours reveals novel subgroups. Nature. 2012;486:346–352. doi: 10.1038/nature10983. [DOI] [PMC free article] [PubMed] [Google Scholar]
- 15. Cerami E, Gao J, Dogrusoz U, et al. The cBio cancer genomics portal: an open platform for exploring multidimensional cancer genomics data. Cancer Discov. 2012;2:401–404. [DOI] [PMC free article] [PubMed] [Google Scholar]
- 16. Gao J, Aksoy BA, Dogrusoz U, et al. Integrative analysis of complex cancer genomics and clinical profiles using the cBioPortal. Sci Signal. 2013;6:pl1. [DOI] [PMC free article] [PubMed] [Google Scholar]
- 17. Pereira B, Chin S-F, Rueda OM, et al. The somatic mutation profiles of 2,433 breast cancers refines their genomic and transcriptomic landscapes. Nat Commun. 2016;7:11479. doi: 10.1038/ncomms11479. [DOI] [PMC free article] [PubMed] [Google Scholar]
- 18. Huang DW, Sherman BT, Lempicki RA. Systematic and integrative analysis of large gene lists using DAVID bioinformatics resources. Nat Protoc. 2009;4:44–57. doi: 10.1038/nprot.2008.211. [DOI] [PubMed] [Google Scholar]
- 19. Warde-Farley D, Donaldson SL, Comes O, et al. The GeneMANIA prediction server: biological network integration for gene prioritization and predicting gene function. Nucleic Acids Res. 2010;38:W214–W220. doi: 10.1093/nar/gkq537. [DOI] [PMC free article] [PubMed] [Google Scholar]
- 20. McPherson K, Steel CM, Dixon JM. Breast cancer–epidemiology, risk factors, and genetics. BMJ. 2000;321:624–628. [DOI] [PMC free article] [PubMed] [Google Scholar]
- 21. Jovanovic J, Rønneberg JA, Tost J, Kristensen V. The epigenetics of breast cancer. Molec Oncol. 2010;4:242–254. doi: 10.1016/j.molonc.2010.04.002. [DOI] [PMC free article] [PubMed] [Google Scholar]
- 22. Cianfrocca M, Goldstein LJ. Prognostic and predictive factors in early-stage breast cancer. Oncologist. 2004;9:606–616. doi: 10.1634/theoncologist.9-6-606. [DOI] [PubMed] [Google Scholar]
- 23. Delen D, Walker G, Kadam A. Predicting breast cancer survivability: a comparison of three data mining methods. Artif Intell Med. 2005;34:113–127. doi: 10.1016/j.artmed.2004.07.002. [DOI] [PubMed] [Google Scholar]
- 24. Montazeri M, Montazeri M, Montazeri M, Beigzadeh A. Machine learning models in breast cancer survival prediction. Technol Health Care. 2016;24:31–42. doi: 10.3233/THC-151071. [DOI] [PubMed] [Google Scholar]
- 25. Vanneschi L, Farinaccio A, Mauri G, Antoniotti M, Provero P, Giacobini M. A comparison of machine learning techniques for survival prediction in breast cancer. BioData Min. 2011;4:12. doi: 10.1186/1756-0381-4-12. [DOI] [PMC free article] [PubMed] [Google Scholar]
- 26. Moasser MM. The oncogene HER2: its signaling and transforming functions and its role in human cancer pathogenesis. Oncogene. 2007;26:6469–6487. doi: 10.1038/sj.onc.1210477. [DOI] [PMC free article] [PubMed] [Google Scholar]
- 27. Sasaki Y, Koyama R, Maruyama R, et al. CLCA2, a target of the p53 family, negatively regulates cancer cell migration and invasion. Cancer Biol Ther. 2012;13:1512–1521. doi: 10.4161/cbt.22280. [DOI] [PMC free article] [PubMed] [Google Scholar]
- 28. Baselga J, Norton L, Albanell J, Kim YM, Mendelsohn J. Recombinant humanized anti-HER2 antibody (Herceptin) enhances the antitumor activity of paclitaxel and doxorubicin against HER2/neu overexpressing human breast cancer xenografts. Cancer Res. 1998;58:2825–2831. [PubMed] [Google Scholar]
Associated Data
This section collects any data citations, data availability statements, or supplementary materials included in this article.
Supplementary Materials
Supplemental material, Supplemental_Material for Machine Learning With K-Means Dimensional Reduction for Predicting Survival Outcomes in Patients With Breast Cancer by Melissa Zhao, Yushi Tang, Hyunkyung Kim and Kohei Hasegawa in Cancer Informatics


