

Abstract
Aim
Bariatric surgery induces significant weight loss, increases insulin sensitivity, and reduces mortality, but the underlying mechanisms are not clear. It was hypothesized that Roux‐en‐Y gastric bypass (RYGB) surgery improves metabolic profile along with weight loss. The objective of this pilot study was to evaluate changes in serum metabolites and fatty acids (FA) at 2 weeks and 6 months after RYGB.
Materials and Methods
Serum samples were collected pre‐surgery, at 2 weeks and 6 months post‐surgery from 20 patients undergoing RYGB surgery. Serum non‐esterified free FA (NEFA) were measured. Serum metabolites and FA were measured using nuclear magnetic resonance spectroscopy and improved direct fatty acid methyl ester synthesis and the gas chromatography/mass spectrometry method, respectively, in subjects who completed follow‐up at 6 months (n = 8).
Results
Mean (standard deviation) percent total weight loss was 6.70% (1.7) and 24.91% (6.63) at 2 weeks (n = 15) and 6 months (n = 8) post‐surgery, respectively. NEFA were significantly reduced at 6 months post‐surgery (P = 0.001, n = 8). Serum branched chain amino acids, 2‐aminobutyrate, butyrate, 2‐hydroxybutyrate, 3‐hydroxybutyrate, acetone, 2‐methylglutarate, and 2‐oxoisocaproate were significantly reduced, while serum alanine, glycine, pyruvate, and taurine were significantly elevated at 6 months post‐surgery compared with pre‐surgery (n = 8, P < 0.05). Also, serum FA C10:0, C13:0, C14:0, C15:0, and C18:0 increased significantly (n = 8, P < 0.05) by 6 months post‐surgery.
Conclusions
Changes in serum metabolites and FA at 6 months post‐RYGB surgery in this pilot study with limited number of participants are suggestive of metabolic improvement; larger studies are warranted for confirmation.
Keywords: bariatric surgery, branched chain amino acids, fatty acid analysis, metabolomics, obesity, RYGB
Abbreviations
- %TWL
percent total weight loss
- 2‐AB
2‐aminiobutyrate
- 2‐MG
2‐methylglutarate
- 2‐OHB
2‐hydroxybutyrate
- 2‐OXO
2‐ oxoisocaproate
- 3‐OHB
3‐hydroxubutyrate
- Ala
alanine
- BCAA
branched chain amino acids
- BMI
body mass index
- DHA
docosahexaenoic acid
- EPA
eicosapentaenoic acid
- FA
fatty acid
- FAME
fatty acid methyl ester
- FDR
false discovery rate
- GC/MS
gas chromatography/mass spectrometry
- Gly
glycine
- HDL
high density lipoprotein
- HOMA‐IR
homeostatic model assessment of insulin resistance
- KB
ketone bodies
- LDL
low density lipoprotein
- MCFA
medium chain FA
- NEFA
non‐esterified fatty acids
- NMR
national magnetic resonance
- RYGB
Roux‐en‐Y gastric bypass surgery
- SD
standard deviation
- SE
standard error of mean
- STROBE
Strengthening the Reporting of Observational Studies in Epidemiology
1. INTRODUCTION
Roux‐en‐Y gastric bypass (RYGB) surgery results in significant and long‐term weight loss with significant reduction of incidence and remission of type 2 diabetes, hypertension, and dyslipidemia.1 According to a meta‐analysis by Magouliotis et al, glucose, insulin, triglycerides, total cholesterol, low density lipoprotein (LDL), high density lipoprotein (HDL), and homeostatic model assessment of insulin resistance (HOMA‐IR) were significantly lowered, indicating improvement in metabolic health following bariatric surgery.2
Metabolites are small molecules that are substrates, intermediates, or products of biological processes.3 “Metabolomics” refers to comprehensive profiling of metabolites present in cells, tissues, or whole organisms. Thus, analysis of metabolites helps to understand different phenotypes and has the potential to diagnose metabolic diseases as well as assess their severity and monitor their progression and treatment outcomes.4
Impaired glucose disposal via oxidative and non‐oxidative pathways, increased lipolysis and lipid oxidation, and altered energy expenditure are observed in obesity.5 The characteristic metabolic fingerprint of obesity includes elevated branched‐chain amino acids (BCAAs), non‐esterified fatty acids (NEFA), acylcarnitines, and phospholipids.6 Metabolites such as BCAAs and α‐hydroxybutyrate have positive associations with insulin resistance, while glycine has a negative association with insulin resistance.4
Past studies have also investigated changes in metabolism that occur due to bariatric surgery using metabolomics.2, 7 These include investigations of differences between bariatric surgery types,8 serial changes in metabolism post‐surgery at different time points,9, 10, 11, 12, 13 comparison of bariatric surgery vs dietary restrictions,14, 15 prediction of outcomes of bariatric surgery,16 and post‐prandial metabolic changes post‐bariatric surgery.15, 17 Post‐bariatric surgery follow‐up studies have reported various changes in some metabolites in serum/plasma10, 11 or urine.13 Early post‐bariatric surgery metabolite changes in plasma as early as day 3 were studied by Jȕllig et al12 and changes in urine metabolites during the first 9 days were studied by Friedrich et al13 while others investigated changes in circulatory metabolites at 3, 6, and 12 months after bariatric surgery.10, 11 Post‐bariatric surgery changes in metabolomics are surgical procedure dependent.8 However, metabolite changes post‐bariatric surgery are independent of food intake and weight loss.14, 15 The characteristic changes in circulating metabolites following bariatric surgery include increased bile acids, serine, and glycine levels and reduced BCAAs and ceramide levels; these are suggestive of improved glycemic control and reduced inflammation.7
Both gastric restriction and caloric restriction may contribute to weight loss after bariatric surgery.18 Furthermore, bariatric surgery leads to changes in gut hormones, gut microbiota, and bile acid metabolism.18, 19, 20 However, metabolic changes following RYGB are yet to be fully characterized. It was hypothesized that RYGB would improve metabolic and lipidomic profiles along with weight loss, but this is not yet well evidenced. The objective of this study was to analyse early and late changes in metabolism following RYGB surgery. Nuclear magnetic resonance (NMR) spectroscopy‐based metabolomics and improved direct fatty acid methyl ester (FAME) synthesis and gas chromatography/mass spectrometry (GC/MS) based fatty acid (FA) analysis were performed in serum samples collected in a prospective exploratory pilot study.
2. MATERIAL AND METHODS
2.1. Study design
Strengthening the Reporting of Observational Studies in Epidemiology (STROBE) Guideline was used for reporting this study21 (Supplementary Table S1). Patients with obesity undergoing RYGB surgery between January and November 2012 were recruited for this prospective, observational study with convenience sampling. RYGB surgery was performed by two bariatric surgeons at the University of Tennessee Bariatric Center in Knoxville, TN. Jejunum was transected 40 to 50 cm distal to ligament of Treitz, and jejunojejunostomy was performed approximately 100 cm distal to the gastrojejunostomy. Participants were followed up at 2 weeks and 6 months post‐surgery. Post‐surgery care and follow‐up was standardized across all patients in order to minimize variability in patient compliance/obligation, which might lead to unnecessary bias in the data. The primary outcomes were changes in metabolites and FA post‐RYGB at 2 weeks and 6 months.
Approval for this study was obtained from the Institutional Review Board of the University of Tennessee, Graduate School of Medicine, and the University of Tennessee‐Knoxville, Office of Research, Knoxville, TN. Written informed consent was obtained from all study participants. IRB approval was also obtained from Institutional Review Board of Texas Tech University to conduct experiments on the collected specimens.
2.2. Serum analysis
Subjects' weight and height were measured, and body mass index (BMI) was calculated at pre‐surgery and follow‐up visits. Follow‐up visits were at 2 weeks and 6 months post‐surgery; the latter follow‐up was conducted within 2 weeks of the 6‐month time point. Blood was drawn at the time of surgery (pre‐surgery) and during the follow‐up visits; serum was separated immediately and stored at –80°C. The present study is a secondary analysis of serum samples that were collected for a study where post‐bariatric surgery changes in serum adipokines/cytokines were measured.22 Participants with serum samples available for the present analysis at each time point are shown in Figure 1.
Figure 1.
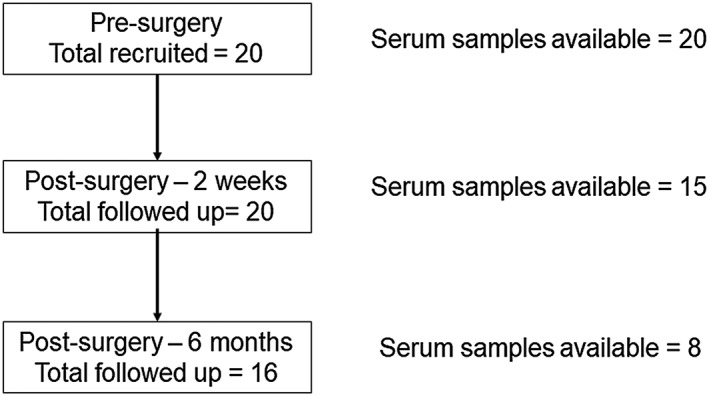
Flow diagram of participants and serum samples studied for each stage. The number of participants used for the present analysis was low due to dropouts during the follow‐up and due to limited sample availability
Serum NEFA was measured using the WAKO NEFA‐HR (2) microtiter procedure (Wako Chemicals USA, Inc., Richmond, VA, USA) in all serum samples available from pre‐surgery and at 2 weeks and 6 months post‐surgery follow‐up visits. Serum glucose levels were measured using the Glucose Oxidase method (Sigma‐Aldrich Co. LLC.MO, USA), and serum metabolomics were performed using NMR spectroscopy to identify metabolites only in subjects with serum samples available for all three time points. (Detailed methodology in the Supplementary Material).
In addition, serum FA were measured using improved direct FAME synthesis and GC‐MS in serum samples of subjects with serum samples available for all three time points. (Detailed methodology in the Supplementary Material).
The primary outcome variables were changes in NMR‐based metabolites, FAME‐based FA, and NEFA at 2 weeks and 6 months post‐RYGB.
2.3. Statistical analyses
Data are presented as mean ± standard deviation (SD) or mean ± standard error of mean (SE). Percent total weight loss (%TWL) was calculated as: %TWL = (Pre‐surgery weight − post‐surgery weight) × 100 / (Pre‐surgery weight).23
Metabolite values were log transformed and compared at pre‐surgery vs 2 weeks and 6 months post‐surgery using paired t‐tests. P‐values less than 0.05 are significant at a nominal 5% level, while P < 0.001 is significant at a Bonferroni‐corrected 5% level. Furthermore, false discovery rate (FDR) controlled lists of significant results at FDRs of 5%, 10%, and 20% were also computed from the P‐values using Storey's q‐value method in order to account for multiple comparisons in a manner that is not overly conservative.24
Pathway analysis module in the Metaboanalyst 3.0 (a web‐based suite for high‐throughput metabolomics analysis) was used to understand pathway enrichment by metabolites.25 For this, the metabolites that significantly changed post‐surgery were entered.
3. RESULTS
Patient demographics are summarized in Table 1. Mean %TWL was 6.70% (SD = 1.70, n = 15) and 24.91% (SD = 6.63, n = 8) by 2 weeks and 6 months post RYGB, respectively.
Table 1.
Characteristics of study subjects whose samples were analysed for metabolites and lipids
| Pre‐Surgery | 2 weeks | 6 months | |
|---|---|---|---|
| Number of subjects (n) | 20 | 15 | 8 |
| Gender | |||
| Males | 5 | 5 | 3 |
| Females | 15 | 10 | 5 |
| Mean age (SD) years | 37.25 (11.68) | 37.60 (11.07) | 37.62(12.92) |
| Mean BMI (SD) kg/m2 | 46.83 (6.21) | 43.65 (6.42) | 34.34 (6.44) |
| Race | |||
| Caucasian | 19 | 14 | 8 |
| African‐American | 1 | 1 | 0 |
| Smoking | |||
| Non‐smoker | 14 | 10 | 6 |
| Ex‐smoker | 6 | 5 | 2 |
| Diagnosed type 2 diabetes pre‐surgery | |||
| Yes | 6 | 5 | 3 |
| No | 14 | 10 | 5 |
| Diagnosed hypertension pre‐surgery | |||
| Yes | 14 | 11 | 7 |
| No | 6 | 4 | 1 |
| Mean % total weight loss post surgery (SD) | 6.7 (1.7) | 24.91% (6.63) | |
Pre‐surgery vs 2 weeks post‐ surgery serum NEFA levels in 15 participants and pre‐surgery vs 6 months post‐surgery serum NEFA levels in eight participants who had samples available for those time points were compared. Serum NEFA levels decreased from pre‐surgery mean value of 0.94 (SD = 0.41) mEq/L to 0.83 (SD = 0.17) mEq/L at 2 weeks post‐surgery, but this was not statistically significant (P = 0.247, n = 15). However, serum NEFA levels significantly decreased from 0.82 (SD = 0.42) mEq/L pre‐surgery to 0.30 (SD = 0.13) mEq/L at 6 months post‐surgery (P = 0.001, q = 0.01, n = 8).
Effects of RYGB on metabolism were investigated using serum samples from the eight patients with complete data for all the three time points (pre‐surgery, 2 weeks post‐surgery and 6 months post‐surgery). None of the metabolites showed a significant change at 2 weeks post‐surgery in comparison to pre‐surgery values (Table 2). However, 14 metabolites significantly changed at 6 months post‐surgery with a less than 10% FDR, and these metabolites were introduced into MetaboAnalyst 3.0 software for pathway analysis (Supplementary Table S2).
Table 2.
Changes in metabolites in serum following RYGB surgery (n = 8)
| Pattern of change | NMR based metabolite | Pre‐surgery (μM) | Post‐surgery | p value for pre‐ vs 6 months post‐surgery | |
|---|---|---|---|---|---|
| 2 weeks (μM) | 6 months (μM) | ||||

|
2‐Aminobutyrate | 15.73 (2.00) | 13.41 (1.20) | 8.24 (0.47) | 0.003*** |
| 2‐Hydroxybutyrate | 29.15 (4.86) | 28.49 (2.36) | 9.44 (0.59) | 0.0001*** | |
| 2‐Methylglutarate | 5.31 (0.62) | 4.83 (0.84) | 2.85 (0.26) | 0.009*** | |
| Leucine | 30.44 (3.99) | 29.70 (2.99) | 19.99 (1.79) | 0.020** | |
| Valine | 54.99 (6.32) | 51.73 (5.29) | 39.31 (2.31) | 0.048** | |

|
3‐Hydroxybutyrate | 144.16 (31.57) | 293.59 (64.47) | 10.70 (2.39) | 0.0002*** |
| Acetone | 25.56 (9.89) | 46.83 (15.10) | 4.90 (0.84) | 0.036** | |

|
Betaine | 19.20 (2.07) | 33.39 (13.31) | 16.43 (2.67) | 0.402 |

|
Acetate | 11.91 (0.87) | 16.08 (1.32) | 14.01 (1.19) | 0.084 |
| Citrate | 16.19 (1.87) | 21.54 (3.75) | 20.83 (2.25) | 0.084 | |
| Glucose | 562.50 (66.22) | 586.51 (68.39) | 576.36 (46.68) | 0.631 | |
| Glutamate | 30.29 (2.96) | 35.94 (2.90) | 30.63 (3.18) | 0.949 | |

|
2‐Oxoisocaproate | 8.54 (1.55) | 9.21 (0.75) | 5.70 (0.32) | 0.009*** |
| Glycerol | 65.09 (7.36) | 76.24 (6.74) | 62.70 (4.88) | 0.995 | |

|
Alanine | 54.13 (4.02) | 52.18 (3.44) | 69.99 (4.07) | 0.013*** |
| Carnitine | 30.15 (3.03) | 31.16 (1.66) | 33.51 (3.65) | 0.167 | |
| Creatinine | 15.93 (1.57) | 15.95 (1.21) | 17.55 (0.73) | 0.288 | |
| Glutamine | 79.10 (6.79) | 79.20 (4.01) | 92.46 (4.83) | 0.065 | |

|
Creatine | 11.81 (1.62) | 10.93 (0.82) | 12.80 (2.32) | 0.705 |
| Tryptophan | 5.21 (0.32) | 4.38 (0.56) | 5.45 (0.43) | 0.730 | |
| Lysine | 39.65 (2.37) | 37.39 (2.74) | 42.68 (1.87) | 0.144 | |
| Phenylalanine | 8.98 (0.79) | 8.30 (0.43) | 9.61 (1.42) | 0.822 | |

|
Butyrate | 9.95 (1.70) | 8.78 (1.66) | 5.31 (0.42) | 0.030** |
| Isoleucine | 20.00 (3.80) | 22.61 (3.95) | 12.73 (1.41) | 0.032** | |
| Threonine | 23.45 (1.64) | 24.89 (2.93) | 21.34 (2.53) | 0.424 | |

|
Glycine | 51.28 (6.23) | 65.21 (3.42) | 67.09 (5.30) | 0.014*** |
| Lactate | 142.40 (14.71) | 173.19 (15.80) | 177.58 (22.77) | 0.098 | |
| Proline | 53.11 (4.24) | 59.18 (3.45) | 63.74 (4.81) | 0.161 | |
| Pyruvate | 13.40 (0.74) | 15.13 (0.73) | 18.58 (1.76) | 0.001*** | |
| Taurine | 61.73 (5.25) | 65.61 (2.99) | 79.24 (6.35) | 0.030** | |

|
Tyrosine | 10.71 (0.71) | 9.70 (1.15) | 9.88 (1.11) | 0.225 |
Mean (standard error of mean) of metabolites measured by NMR spectroscopy are given as μM values relative to the internal standard. Log transformed values at 2 weeks and 6 months post‐surgery were compared with pre‐surgery values using paired t test. Q values were generated for multiple comparisons.
Indicates P values that are statistically significant (P value <0.05) with false discovery rate of less than 5% (q < 0.05).
Indicates statistically significant (P value <0.05) with a false discovery rate less than 10% (q value < 0.1).
P value less than 0.05 is significant at a nominal level, while P < 0.001 is significant at a Bonferroni‐corrected level.
Serum random glucose levels, measured with glucose oxidase method, did not show a significant change and were 79 (SD = 22.65) mg/dL, 75.75 (SD = 20.29) mg/dL, and 79.75 (SD = 16.26) mg/dL at pre‐surgery, at 2 weeks and 6 months post‐surgery, respectively (P > 0.05, n = 8).
Changes in 31 FA in serum following RYGB until 6 months (n = 8) were measured. Five FA (C10:0, C13:0, C14:0, C15:0, and C18:0) significantly increased following RYGB at 6 months, compared with pre‐surgery concentrations (P < 0.05 and FDR of 20%) as shown in Figure 2. Significant changes in eicosapentaenoic acid (EPA) or docosahexaenoic acid (DHA) (P value = 0.59 and 0.65, respectively) in serum following RYGB were not observed.
Figure 2.
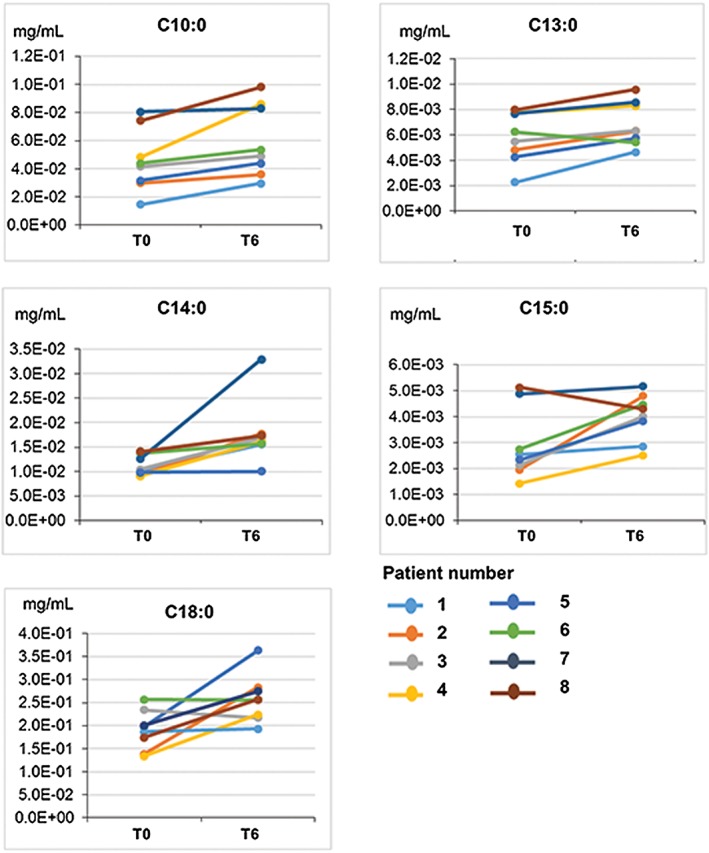
Serum fatty acids that changes following RYGB surgery (n = 8). T0 = pre‐surgery, T6 = at 6 months post‐surgery. C10:10 (P = 0.011), C13:0 (P = 0.017), C15:0 (0.028), C18:0 (P = 0.022). These serum fatty acids changed significantly (P < 0.05) with FDR of <20%
Possible mechanisms by which RYGB may contribute to the improvement of metabolic health based on literature are summarized in Figure 3 and are based on the metabolites and serum lipids that changed significantly at 6 months post‐surgery.
Figure 3.
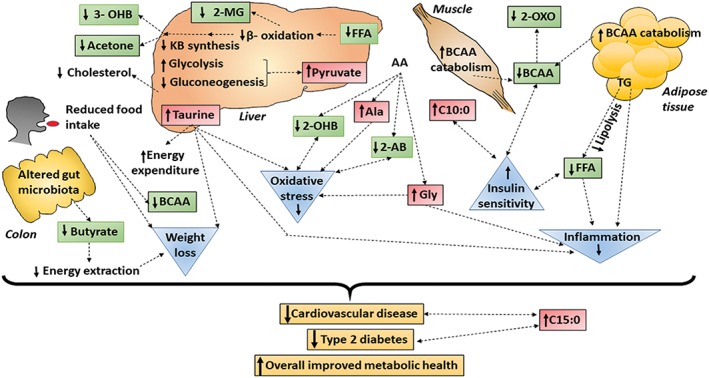
A model summarizing significantly changed metabolites and fatty acids and possible contribution of those to improved metabolic health at 6 months post RYGB surgery. Colour coding: Green—metabolites significantly reduced at 6 months post‐surgery compared with pre‐surgery and red—metabolites significantly increased at 6 months post‐surgery compared with pre‐surgery are our findings. Orange—potential clinical outcomes, blue—potential biological changes that may occur. Double dotted arrow—predicted associations, single dotted arrow—predicted causations are based on literature. Abbreviations; 2‐AB (2‐aminiobutyrate), 2‐MG (2‐methylglutarate), 2‐OHB (2‐hydroxybutyrate), 2‐OXO (2‐ oxoisocaproate), 3‐OHB (3‐hydroxubutyrate), Ala (alanine), BCAA (branched chain amino acids), Gly (glycine), KB (ketone bodies), NEFA (non‐esterified free fatty acids)
4. DISCUSSION
Mechanisms leading to significant clinical improvement following bariatric surgery are not well understood. For the present pilot study, only the subjects with complete sets of serum samples at pre‐surgery, and post‐surgery 2 weeks and 6 months (n = 8) were considered for metabolomics and FA analyses, in order to understand metabolic changes that occur following RYGB. Significant differences in several metabolites and FA were observed at 6 months post‐RYGB surgery compared with pre‐surgery.
Even though serum NEFA level did not change significantly at 2 weeks, significant reduction was observed at 6 months post‐RYGB. Similarly, Luo et al observed a significant reduction of NEFAs by 6 months and 1 year post RYGB in subjects who had remission of diabetes.9 NEFAs are chronically elevated in persons with obesity and type 2 diabetes due to increased lipolysis in the adipose tissue with insulin resistance and mitochondrial dysfunction, corresponding with an inability to switch from fat oxidation to carbohydrate oxidation.26, 27 In addition, high levels of NEFAs induce and/or aggravate insulin resistance mainly in the liver and muscle, creating a vicious cycle.26
We observed an increasing trend in serum 3‐hydroxybutyrate (a ketone body) levels at 2 weeks post RYGB, and significantly lower levels at 6 months post‐RYGB compared with pre‐surgery along with significant reductions of acetone and NEFAs at 6 months post RYGB compared with pre‐surgery. It has been previously reported that 3‐hydroxybutyrate levels are high during the first week post bariatric surgery.13 In obesity, liver ketogenesis is reduced due to hyperinsulinemia.28 Thus, lower 3‐hydroxybutyrate levels are observed in persons with obesity than in individuals with normal weight.29 However, urinary 3‐hydroxybutyrate levels are higher in pre‐operative patients with obesity than in healthy controls,13 since there is increased lipolysis in the adipose tissue with increased β‐oxidation and ketogenesis in the liver due to the low calorie preoperative diet.30 It is likely that the increase in ketones during the early post‐surgery period is due to both surgical stress and caloric restriction since Laferrere et al observed that plasma 3‐hydroxybutyrate similarly increased following ~10‐kg weight loss after RYGB (~1 month post‐surgery) and caloric restriction (~2 months post‐intervention).14 Interestingly, an early increase of 3‐hydrobutyrate is observed with better glycemic control post‐surgery and the 3‐hydroxybutyrate/glucose concentration ratio has been proposed as an indicator of metabolic improvement post‐surgery.7 According to the present study, excessive lipolysis, FA oxidation, and ketone body synthesis all seem to be lowered at 6 months post‐RYGB, and these changes may be due to an improvement in insulin sensitivity due to RYGB.
Five FA increased significantly at 6 months post‐surgery in the present study. Decanoic acid (C10:0) increased at 6 months post‐surgery compared with pre‐surgery values. This is in line with past literature reporting an increase in decanoic acid 42 days after RYGB.31 Decanoic acid is a medium chain FA (MCFA). MCFAs are known to suppress fat deposition via increased thermogenesis and fat oxidation.32 In addition, MCFAs may play a role in preserving insulin sensitivity in type 2 diabetes.32 Hence, elevation of decanoic acid may be related to improvement in insulin sensitivity and fat mass loss post‐RYGB. Serum C15:0 FA increased significantly at 6 months post‐RYGB compared with pre‐surgery values. A similar increase of serum C15:0 at 1 year post‐RYGB has been previously reported.11 Plasma odd chain saturated FA (such as C15:0 and C17:0) have a positive association with dairy fat intake while an inverse association exists with development of cardiovascular disease and type 2 diabetes.33 Therefore, elevation of C15:0 post‐RYGB may be due to changes in dietary patterns and may be associated with improved cardiovascular health. A significant increase in C14:0 and C18:0 FA at 6 months post‐RYGB was also observed in the present study. Similarly, Lopes et al reported significant increase of C14, C18 at 1 year post‐RYGB.11 Significant changes in essential FA or omega 3 FA were not observed following RYGB, even though those are known to be reduced after bariatric surgery.11 However, this pilot study is not sufficiently powered for us to have confidence in these negative results.
BCAA levels were significantly reduced at 6 months post‐RYGB compared with pre‐surgery in the present pilot study. This is comparable to past literature reporting reduction of BCAA at 3 weeks, 3 months,34 6 months,10 and at 1 year post‐bariatric surgery.11 BCAA are the most often changed amino acid group following bariatric surgery.35 Furthermore, a significant reduction of 2‐oxoisocaproate (α‐ketoisocaproate) was detected at 6 months post‐surgery compared with pre‐surgery. 2‐Oxoisocaproate is an intermediate of leucine metabolism.36 Reduction of BCAA levels post‐RYGB may be due to reduced protein intake or increased BCAA catabolism.37 It has been previously shown that BCAA levels are significantly reduced following ~10‐kg weight loss after RYGB and caloric restriction. However, BCAA levels were lower following RYGB,14 suggesting that reduction of BCAA levels post‐RYGB is not purely due to weight loss. Reduction of 2‐oxoisocaproate is comparable with low leucine levels post‐surgery and suggests increased BCAA degradation post‐RYGB. High levels of BCAA (including leucine, isoleucine, and valine) are associated with insulin resistance, diabetes, and coronary artery disease and predict development of diabetes.38 Khoo et al observed that RYGB improves metabolic flexibility with removal of glucose and amino acids including BCAA as early as 2 weeks post‐surgery.15 Furthermore, reduction of plasma BCAAs is associated with improved insulin sensitivity post‐RYGB.7 Hence, it is postulated that significant reduction of BCAAs following RYGB in in the present study suggests improved insulin sensitivity.
In contrast to reduction of BCAAs, a significant increase of serum glycine and alanine following RYGB at 6 months is reported in the present study. Glycine is known to increase following bariatric surgery7, 13 while low serum glycine is an early marker of insulin resistance.39 Furthermore, glycine has anti‐inflammatory properties, reduces kidney damage,40 and lowers oxidative stress.41 Hence, increase of serum glycine suggests reduced insulin resistance, reduced inflammation, and lowered oxidative stress post‐RYGB. Serum alanine levels increased post‐surgery in a rat model of RYGB42 similar to the present study. Elevation of alanine may have protective effects since alanine has anti‐atherogenic action in endothelial cells43 and prevents hepatocellular injury.44 However, some studies have reported reduction of serum alanine post bariatric surgery10 and that reduction of alanine is greater with remission of diabetes.45 However, data on remission of diabetes for the study participants are not available for the present study to comment on this aspect.
According to this pilot study, serum taurine was significantly elevated at 6 months post RYGB than pre‐surgery. However, Mutch et al did not observe a significant increase of taurine at 6 months post‐surgery10 even though obesity and diabetes are taurine‐deficient states.46 Taurine is important for multiple biological functions including excretion of cholesterol, upregulation of hepatic LDL receptors, reduction of blood pressure, and has anti‐oxidant and anti‐inflammatory actions.46 Furthermore, taurine supplementation increases resting energy expenditure, prevents high‐fat diet induced obesity, and has anorectic effect.46 Thus, elevation of taurine at 6 months post‐RYGB may help to increase energy expenditure and reduce oxidative stress and inflammation. Measurement of energy expenditure in future studies will help to assess the validity of this finding.
Significant reduction of 2‐aminobutyric acid and 2‐hydroxybutyrate (α‐hydroxybutyrate) was observed at 6 months post‐RYGB compared with pre‐surgery. Since 2‐aminobutyric acid and 2‐hydroxybutyrate are known to be related to oxidative stress,47, 48 these changes further support reduction of oxidative stress post‐RYGB. However, we do not have data on oxidative stress to confirm this theory. Moreover, 2‐hydroxybutyrate is a marker of insulin resistance/impaired glucose tolerance.49 Shantavasinkul et al observed a decrease in plasma 2‐hydroxybutyrate and a positive correlation between change in insulin resistance and change in 2‐hydroxybutyric acid by 6 months post‐RYGB.50 Hence, reduction in 2‐hydroxybutyrate also points to improved insulin sensitivity in our subjects.
Serum pyruvate, which is formed following glycolysis, was significantly elevated at 6 months post‐RYGB compared with pre‐surgery in the present study, and similar findings were observed in a rat model of RYGB.42, 51 Elevation of pyruvate suggests increased glucose utilization and glycolysis post‐RYGB.42 However, Sarosiek et al observed reduction of pyruvate at 1 month after bariatric surgery,30 and Tulipani et al reported reduction of circulatory pyruvate levels following bariatric surgery in their systematic review and meta‐analysis.7 Furthermore, 2‐methylglutarate, which is a metabolite of citric acid cycle's succinic acid,52 was also significantly reduced following RYGB at 6 months in the present pilot study, and this has not been previously reported.
Another novel finding is a reduction of serum butyrate at 6 months post RYGB compared with pre‐surgery values. Butyrate is an energy source for the colonic epithelium.53 Lower levels of faecal short chain FA including acetate, propionate, and butyrate were observed in subjects following bariatric surgery (after 9 years) compared with subjects with obesity.54 Furthermore, a reduction of butyrate‐producing gut bacteria has been observed following laparoscopic sleeve gastrectomy.55 Hence, lower levels of butyrate post‐RYGB in the present study could be due to either lower consumption of dietary fibre/resistant starch and/or alterations in the gut microbiota following RYGB surgery. However, it is not possible to make strong conclusions along these lines since accurate dietary information or stool specimens were not analysed in the present pilot study.
The strengths of our pilot study include the use of multiple time points to study changes post‐RYGB and the use of both NMR‐based metabolomics and FA analysis. According to our knowledge, significant elevation of taurine and reduction in 3‐hydroxybutyrate, 2‐oxoisocaproate, 2‐aminobutyric acid, 2‐methylglutarate, and butyrate in serum at 6 months post‐RYGB are novel findings.
However, this study also has a few limitations. The sample size was small due to drop outs during the follow‐up and due to limited sample availability. Although not ideal, it is possible to draw some conclusions related to the hypotheses of interest based on eight subjects who had complete set of samples for pre‐surgery, 2 weeks and 6 months post‐surgery, with the following caveats: It is true that power is reduced when the sample size is small and false negative results (type II errors) may be observed due to lack of power.56 This may be one of the driving reasons for not observing significant changes for metabolites and FA at 2 weeks post‐surgery. Additionally, some of the metabolites and the FA that did not show significant change at 6 months post‐surgery might be false negative results, but they could also be true negative results and we are not powered to reliably make such a distinction in that case. Contrariwise, it is possible that some of the statistically significant findings are merely false positives; however, our reported P‐values have indications for FWER and FDR control, in order to account for multiple testing issues: P‐values less than 0.05 are considered as statistically significant at a nominal level of 5%, while P < 0.001 is statistically significant at a Bonferroni‐corrected family‐wise error rate of 5%. Since FWER control may be overly conservative, less‐conservative FDR controlled lists of significant results at FDRs of 5%, 10%, and 20% were computed from the observed P‐values using Storey's q‐value method to account for multiple comparisons (Table 2). With these caveats in mind, one can be as confident about the significant changes in metabolites and FA identified at 6 months post‐RYGB in comparison to the pre‐surgery in this pilot study as in any other study, regardless of sample size concerns. Since the changes in several metabolites and FA post‐RYGB reported here are likely to contribute to improvement in metabolic health, it is worthwhile to report the findings, despite the loss of power from greater‐than‐foreseen loss to follow‐up.
Another limitation of this study is that serum samples collected during the follow‐up were not confirmed as fasting samples, preventing meaningful measurements of insulin resistance. However, Townsend MK et al57 showed that fasting status or time of day of blood collection was not a major source of variability for several metabolites including the amino acids that are reported here. Also, fasting status had minimal effects on non‐triglyceride lipids in blood.58 However, the effect of non‐fasting on some of the metabolites described here has not been rigorously studied. In addition, dietary information of study participants are not available. Thus, it was assumed that nutrient deficiencies have been rectified through the Center's nutritional counselling. Finally, only patients who underwent RYGB were included for the study. Therefore, the post‐RYGB metabolite changes may not be generalized to other types of bariatric surgery.
In summary, this pilot study identified significant changes in metabolic markers and FAs, especially with comparison of pre‐surgery and 6 months after RYGB surgery, and these changes may be linked with improved metabolic health following RYGB.
5. CONCLUSION
Post‐RYGB surgery changes in metabolites and FA in serum were studied using NMR spectroscopy and FAME/GC‐MS. Significant changes in serum metabolites and FA at 6 months post‐RYGB compared with pre‐surgery are suggestive of improved metabolic health following RYGB surgery. Therefore, this pilot study provides a starting point for further, controlled studies with larger sample sizes in order to determine mechanisms linking changes in metabolic profiles to improved metabolic health in patients following RYGB.
FUNDING INFORMATION
This study was funded by the Physicians' Medical Education and Research Foundation at the University of Tennessee Medical Center, Knoxville, TN and by startup research funds from Texas Tech University (College of Human Sciences and Office of the Vice President for Research), Lubbock, TX. This study made use of the National Magnetic Resonance Facility at Madison, (NMRFAM), which is supported by NIH grant P41GM103399 (NIGMS), old number: P41RR002301. Equipment was purchased with funds from the University of Wisconsin‐Madison's National Magnetic Resonance Facility at Madison, (NMRFAM), which was funded by the NIH (grants P41GM103399, S10RR02781, S10RR08438, S10RR023438, S10RR025062, S10RR029220), the NSF (grants DMB‐8415048, OIA‐9977486, BIR‐9214394), and the USDA.
DISCLOSURES
All the authors including Nadeeja N. Wijayatunga, Valerie G. Sams, John A. Dawson, Matthew L. Mancini, Gregory J. Mancini, and Naima Moustaid‐Moussa declare that they have no competing interests.
Supporting information
Supplementary Table S1. STROBE Statement—Checklist
Supplementary Table S2. Contd.
ACKNOWLEDGEMENTS
We thank F. Assadi‐Porter (PhD), who was previously at Texas Tech University, for her assistance in facilitating the services provided by the NMRFAM facility. We also, thank Dennis R. Van Dorp (MD), Instructor, Department of Surgery, University of Tennessee Medical Center, University of Tennessee Graduate School of Medicine, Knoxville, TN for his help with compiling data collected during follow‐up. We thank Nalin Siriwardhana (PhD) for his assistance at the early stages of this project, and Yehia Mechrif (PhD) and Kazimierz Surowiec (PhD) for their valuable assistance with the fatty acid analyses.
Wijayatunga NN, Sams VG, Dawson JA, Mancini ML, Mancini GJ, Moustaid‐Moussa N. Roux‐en‐Y gastric bypass surgery alters serum metabolites and fatty acids in patients with morbid obesity. Diabetes Metab Res Rev. 2018;34:e3045 10.1002/dmrr.3045
REFERENCES
- 1. Adams TD, Davidson LE, Litwin SE, et al. Weight and metabolic outcomes 12 years after gastric bypass. N Engl J Med. 2017;377(12):1143‐1155. [DOI] [PMC free article] [PubMed] [Google Scholar]
- 2. Magouliotis DE, Tasiopoulou VS, Sioka E, Chatedaki C, Zacharoulis D. Impact of bariatric surgery on metabolic and gut microbiota profile: a systematic review and meta‐analysis. Obes Surg. 2017;27(5):1345‐1357. [DOI] [PubMed] [Google Scholar]
- 3. Zhang A, Sun H, Wang X. Emerging role and recent applications of metabolomics biomarkers in obesity disease research. RSC Adv. 2017;7(25):14966‐14973. [Google Scholar]
- 4. Newgard CB. Metabolomics and metabolic diseases: where do we stand? Cell Metab. 2017;25(1):43‐56. [DOI] [PMC free article] [PubMed] [Google Scholar]
- 5. Camastra S, Gastaldelli A, Mari A, et al. Early and longer term effects of gastric bypass surgery on tissue‐specific insulin sensitivity and beta cell function in morbidly obese patients with and without type 2 diabetes. Diabetologia. 2011;54(8):2093‐2102. [DOI] [PubMed] [Google Scholar]
- 6. Rauschert S, Uhl O, Koletzko B, Hellmuth C. Metabolomic biomarkers for obesity in humans: a short review. Ann Nutr Metab. 2014;64(3‐4):314‐324. [DOI] [PubMed] [Google Scholar]
- 7. Tulipani S, Griffin J, Palau‐Rodriguez M, et al. Metabolomics‐guided insights on bariatric surgery versus behavioral interventions for weight loss. Obesity. 2016;24(12):2451‐2466. [DOI] [PubMed] [Google Scholar]
- 8. Gralka E, Luchinat C, Tenori L, Ernst B, Thurnheer M, Schultes B. Metabolomic fingerprint of severe obesity is dynamically affected by bariatric surgery in a procedure‐dependent manner. Am J Clin Nutr. 2015;102(6):1313‐1322. [DOI] [PubMed] [Google Scholar]
- 9. Luo P, Yu H, Zhao X, et al. Metabolomics study of Roux‐en‐Y gastric bypass surgery (RYGB) to treat type 2 diabetes patients based on ultraperformance liquid chromatography‐mass spectrometry. J Proteome Res. 2016;15(4):1288‐1299. [DOI] [PubMed] [Google Scholar]
- 10. Mutch DM, Fuhrmann JC, Rein D, et al. Metabolite profiling identifies candidate markers reflecting the clinical adaptations associated with Roux‐en‐Y gastric bypass surgery. PLoS One. 2009;4(11):e7905. [DOI] [PMC free article] [PubMed] [Google Scholar]
- 11. Lopes TI, Geloneze B, Pareja JC, Calixto AR, Ferreira MM, Marsaioli AJ. Blood metabolome changes before and after bariatric surgery: a 1H NMR‐based clinical investigation. OMICS. 2015;19(5):318‐327. [DOI] [PubMed] [Google Scholar]
- 12. Jüllig M, Yip S, Xu A, et al. Lower fetuin‐A, retinol binding protein 4 and several metabolites after gastric bypass compared to sleeve gastrectomy in patients with type 2 diabetes. PLoS One. 2014;9(5):e96489. [DOI] [PMC free article] [PubMed] [Google Scholar]
- 13. Friedrich N, Budde K, Wolf T, et al. Short‐term changes of the urine metabolome after bariatric surgery. OMICS. 2012;16(11):612‐620. [DOI] [PubMed] [Google Scholar]
- 14. Laferrère B, Reilly D, Arias S, et al. Differential metabolic impact of gastric bypass surgery versus dietary intervention in obese diabetic subjects despite identical weight loss. Sci Transl Med. 2011;3(80):80re82‐80re82. [DOI] [PMC free article] [PubMed] [Google Scholar]
- 15. Khoo CM, Muehlbauer MJ, Stevens RD, et al. Postprandial metabolite profiles reveal differential nutrient handling after bariatric surgery compared to matched caloric restriction. Ann Surg. 2014;259(4):687‐693. [DOI] [PMC free article] [PubMed] [Google Scholar]
- 16. Kwon HN, Lee YJ, Kang J‐H, et al. Prediction of glycated hemoglobin levels at 3 months after metabolic surgery based on the 7‐day plasma metabolic profile. PLoS One. 2014;9(11):e109609. [DOI] [PMC free article] [PubMed] [Google Scholar]
- 17. Lopes TI, Geloneze B, Pareja JC, Calixto AR, Ferreira MM, Marsaioli AJ. “Omics” prospective monitoring of bariatric surgery: Roux‐en‐Y gastric bypass outcomes using mixed‐meal tolerance test and time‐resolved (1)H NMR‐based metabolomics. OMICS. 2016;20(7):415‐423. [DOI] [PMC free article] [PubMed] [Google Scholar]
- 18. Madsbad S, Dirksen C, Holst JJ. Mechanisms of changes in glucose metabolism and bodyweight after bariatric surgery. Lancet Diabetes Endocrinol. 2(2):152‐164. [DOI] [PubMed] [Google Scholar]
- 19. Arble DM, Sandoval DA, Seeley RJ. Mechanisms underlying weight loss and metabolic improvements in rodent models of bariatric surgery. Diabetologia. 2015;58(2):211‐220. [DOI] [PMC free article] [PubMed] [Google Scholar]
- 20. Ionut V, Bergman RN. Mechanisms responsible for excess weight loss after bariatric surgery. J Diabetes Sci Technol. 2011;5(5):1263‐1282. [DOI] [PMC free article] [PubMed] [Google Scholar]
- 21. von Elm E, Altman DG, Egger M, Pocock SJ, Gotzsche PC, Vandenbroucke JP. The strengthening the reporting of observational studies in epidemiology (STROBE) statement: guidelines for reporting observational studies. J Clin Epidemiol. 2008;61(4):344‐349. [DOI] [PubMed] [Google Scholar]
- 22. Sams VG, Blackledge C, Wijayatunga N, et al. Effect of bariatric surgery on systemic and adipose tissue inflammation. Surg Endosc. 2016;30(8):3499‐3504. [DOI] [PubMed] [Google Scholar]
- 23. van de Laar A, de Caluwe L, Dillemans B. Relative outcome measures for bariatric surgery. Evidence against excess weight loss and excess body mass index loss from a series of laparoscopic Roux‐en‐Y gastric bypass patients. Obes Surg. 2011;21(6):763‐767. [DOI] [PubMed] [Google Scholar]
- 24. Storey JD. A direct approach to false discovery rates. J R Stat Soc Series B Stat Methodology. 2002;64(3):479‐498. [Google Scholar]
- 25. Xia J, Wishart DS. Using MetaboAnalyst 3.0 for comprehensive metabolomics data analysis. Curr Protoc Bioinformatics. 2016;55:14.10.11‐14.10.91. [DOI] [PubMed] [Google Scholar]
- 26. Delarue J, Magnan C. Free fatty acids and insulin resistance. Curr Opin Clin Nutr Metab Care. 2007;10(2):142‐148. [DOI] [PubMed] [Google Scholar]
- 27. Bjørndal B, Burri L, Staalesen V, Skorve J, Berge RK. Different adipose depots: their role in the development of metabolic syndrome and mitochondrial response to hypolipidemic agents. J Obes. 2011;2011:490650. [DOI] [PMC free article] [PubMed] [Google Scholar]
- 28. Cotter DG, Schugar RC, Crawford PA. Ketone body metabolism and cardiovascular disease. Am J Physiol Heart Circ Physiol. 2013;304(8):H1060‐H1076. [DOI] [PMC free article] [PubMed] [Google Scholar]
- 29. Vice E, Privette JD, Hickner RC, Barakat HA. Ketone body metabolism in lean and obese women. Metabolism. 2005;54(11):1542‐1545. [DOI] [PubMed] [Google Scholar]
- 30. Sarosiek K, Pappan KL, Gandhi AV, et al. Conserved metabolic changes in nondiabetic and type 2 diabetic bariatric surgery patients: global metabolomic pilot study. J Diabetes Res. 2016;2016:3467403. [DOI] [PMC free article] [PubMed] [Google Scholar]
- 31. Arora T, Velagapudi V, Pournaras DJ, et al. Roux‐en‐Y gastric bypass surgery induces early plasma metabolomic and lipidomic alterations in humans associated with diabetes remission. PLoS One. 2015;10(5):e0126401. [DOI] [PMC free article] [PubMed] [Google Scholar]
- 32. Nagao K, Yanagita T. Medium‐chain fatty acids: functional lipids for the prevention and treatment of the metabolic syndrome. Pharmacol Res. 2010;61(3):208‐212. [DOI] [PubMed] [Google Scholar]
- 33. Jenkins B, West JA, Koulman A. A review of odd‐chain fatty acid metabolism and the role of pentadecanoic acid (C15: 0) and heptadecanoic acid (C17: 0) in health and disease. Molecules. 2015;20(2):2425‐2444. [DOI] [PMC free article] [PubMed] [Google Scholar]
- 34. Lips MA, Van Klinken JB, van Harmelen V, et al. Roux‐en‐Y gastric bypass surgery, but not calorie restriction, reduces plasma branched‐chain amino acids in obese women independent of weight loss or the presence of type 2 diabetes. Diabetes Care. 2014;37(12):3150‐3156. [DOI] [PubMed] [Google Scholar]
- 35. Samczuk P, Ciborowski M, Kretowski A. Application of metabolomics to study effects of bariatric surgery. J Diabetes Res. 2018;2018:6270875. [DOI] [PMC free article] [PubMed] [Google Scholar]
- 36. Adeva MM, Calviño J, Souto G, Donapetry C. Insulin resistance and the metabolism of branched‐chain amino acids in humans. Amino Acids. 2012;43(1):171‐181. [DOI] [PubMed] [Google Scholar]
- 37. She P, Van Horn C, Reid T, Hutson SM, Cooney RN, Lynch CJ. Obesity‐related elevations in plasma leucine are associated with alterations in enzymes involved in branched‐chain amino acid metabolism. Am J Physiol Endocrinol Metab. 2007;293(6):E1552‐E1563. [DOI] [PMC free article] [PubMed] [Google Scholar]
- 38. Newgard Christopher B. Interplay between lipids and branched‐chain amino acids in development of insulin resistance. Cell Metab. 2012;15(5):606‐614. [DOI] [PMC free article] [PubMed] [Google Scholar]
- 39. Wang‐Sattler R, Yu Z, Herder C, et al. Novel biomarkers for pre‐diabetes identified by metabolomics. Mol Syst Biol. 2012;8:615. [DOI] [PMC free article] [PubMed] [Google Scholar]
- 40. Perez‐Torres I, Ibarra B, Soria‐Castro E, et al. Effect of glycine on the cyclooxygenase pathway of the kidney arachidonic acid metabolism in a rat model of metabolic syndrome. Can J Physiol Pharmacol. 2011;89(12):899‐910. [DOI] [PubMed] [Google Scholar]
- 41. Sekhar RV, McKay SV, Patel SG, et al. Glutathione synthesis is diminished in patients with uncontrolled diabetes and restored by dietary supplementation with cysteine and glycine. Diabetes Care. 2011;34(1):162‐167. [DOI] [PMC free article] [PubMed] [Google Scholar]
- 42. Wu Q, Li JV, Seyfried F, et al. Metabolic phenotype‐microRNA data fusion analysis of the systemic consequences of Roux‐en‐Y gastric bypass surgery. Int J Obes (Lond). 2015;39(7):1126‐1134. [DOI] [PMC free article] [PubMed] [Google Scholar]
- 43. Grosser N, Oberle S, Berndt G, Erdmann K, Hemmerle A, Schröder H. Antioxidant action of l‐alanine: heme oxygenase‐1 and ferritin as possible mediators. Biochem Biophys Res Commun. 2004;314(2):351‐355. [DOI] [PubMed] [Google Scholar]
- 44. Ishizaki‐Koizumi S, Sonaka I, Fujitani S, Nishiguchi S. Mechanisms of the protective effect of L‐alanine to D‐galactosamine‐induced hepatocellular injury: comparative studies of L‐alanine and pyruvate. Biochem Biophys Res Commun. 2002;291(4):738‐743. [DOI] [PubMed] [Google Scholar]
- 45. Narath SH, Mautner SI, Svehlikova E, et al. An untargeted metabolomics approach to characterize short‐term and long‐term metabolic changes after bariatric surgery. PLoS One. 2016;11(9):e0161425. [DOI] [PMC free article] [PubMed] [Google Scholar]
- 46. Murakami S. Role of taurine in the pathogenesis of obesity. Mol Nutr Food Res. 2015;59(7):1353‐1363. [DOI] [PubMed] [Google Scholar]
- 47. Soga T, Baran R, Suematsu M, et al. Differential metabolomics reveals ophthalmic acid as an oxidative stress biomarker indicating hepatic glutathione consumption. J Biol Chem. 2006;281(24):16768‐16776. [DOI] [PubMed] [Google Scholar]
- 48. Lord RS, Bralley JA. Clinical applications of urinary organic acids. Part I: detoxification markers. Altern Med Rev. 2008;13(3):205‐215. [PubMed] [Google Scholar]
- 49. Gall WE, Beebe K, Lawton KA, et al. α‐Hydroxybutyrate is an early biomarker of insulin resistance and glucose intolerance in a nondiabetic population. PLoS One. 2010;5(5):e10883. [DOI] [PMC free article] [PubMed] [Google Scholar]
- 50. Shantavasinkul PC, Muehlbauer MJ, Bain JR, et al. Improvement in insulin resistance after gastric bypass surgery is correlated with a decline in plasma 2‐hydroxybutyric acid. Surg Obes Relat Dis. 10.1016/j.soard.2018.03.033 [DOI] [PMC free article] [PubMed] [Google Scholar]
- 51. Ashrafian H, Li JV, Spagou K, et al. Bariatric surgery modulates circulating and cardiac metabolites. J Proteome Res. 2014;13(2):570‐580. [DOI] [PubMed] [Google Scholar]
- 52. Wishart DS, Jewison T, Guo AC, et al. HMDB 3.0—the human metabolome database in 2013. Nucleic Acids Res. 2013;41(Database issue:D801‐D807. [DOI] [PMC free article] [PubMed] [Google Scholar]
- 53. Neis EPJG, Dejong CHC, Rensen SS. The role of microbial amino acid metabolism in host metabolism. Nutrients. 2015;7(4):2930‐2946. [DOI] [PMC free article] [PubMed] [Google Scholar]
- 54. Tremaroli V, Karlsson F, Werling M, et al. Roux‐en‐Y gastric bypass and vertical banded gastroplasty induce long‐term changes on the human gut microbiome contributing to fat mass regulation. Cell Metab. 2015;22(2):228‐238. [DOI] [PMC free article] [PubMed] [Google Scholar]
- 55. Damms‐Machado A, Mitra S, Schollenberger AE, et al. Effects of surgical and dietary weight loss therapy for obesity on gut microbiota composition and nutrient absorption. Biomed Res Int. 2015;2015:806248. [DOI] [PMC free article] [PubMed] [Google Scholar]
- 56. Jones SR, Carley S, Harrison M. An introduction to power and sample size estimation. Emerg Med J. 2003;20(5):453‐458. [DOI] [PMC free article] [PubMed] [Google Scholar]
- 57. Townsend MK, Bao Y, Poole EM, et al. Impact of pre‐analytic blood sample collection factors on metabolomics. Cancer Epidemiol Biomarkers Prev. 2016;25(5):823‐829. [DOI] [PMC free article] [PubMed] [Google Scholar]
- 58. Langsted A, Freiberg JJ, Nordestgaard BG. Fasting and nonfasting lipid levels. Influence of normal food intake on lipids, lipoproteins, apolipoproteins, and cardiovascular risk prediction. Circulation. 2008;118(20):2047‐2056. [DOI] [PubMed] [Google Scholar]
Associated Data
This section collects any data citations, data availability statements, or supplementary materials included in this article.
Supplementary Materials
Supplementary Table S1. STROBE Statement—Checklist
Supplementary Table S2. Contd.