

Abstract
Background
To identify potential therapeutic target in clear cell renal cell carcinoma (ccRCC), we performed a transcriptome analysis. Our analysis showed that fatty acid binding protein 7 (FABP7) has the highest mean differential overexpression in ccRCC compared to normal kidney. We aimed to investigate the significance of FABP7 in ccRCC.
Methods
Immunohistochemical staining for 40 advanced ccRCC cases was performed to investigate correlation between clinicopathological parameters and FABP7. They were composed of 40–83 years old cases with 33 male, 22 cases with pT ≥ 3, 19 cases with M1, and 16 cases with grade 3. The effect of gene knockdown was analysed by a cell viability assay and invasion assay in FABP7-overexpressing cell lines (SKRC7 and SKRC10).
Results
Our immunohistochemical analysis showed that higher FABP7 expression significantly correlated with distant metastasis and poor cancer-specific survival (CSS; both p < 0.05). Functional suppression of FABP7 significantly inhibited SKRC10 cell growth (p < 0.05) and resulted in a significant reduction of the invasive potential (p < 0.01), but did not cause growth inhibition of SKRC7 cells. We found that The Cancer Genome Atlas Research Network (TCGA) database shows FABP6 and 7 as equally overexpressed in the FABP family. Functional suppression of fatty acid binding protein 6 (FABP6) resulted in significant growth inhibition of SKRC7 cells (p < 0.005).
Conclusions
Functional suppression of FABP7 significantly reduced cell viability and invasive potential in a ccRCC cell line. FABP7 may play a role in progression in some metastatic ccRCCs. The suppressed function may be compensated by another FABP family member.
Keywords: Fatty acid binding protein 7, Clear cell renal cell carcinoma, Prognostic marker, Therapeutic target, Fatty acid binding protein 6
Background
Renal cell carcinoma (RCC) accounts for 3% of all cancer cases in adults, and it is the 11th most common cancer in men and the 14th most common in women. Its worldwide incidence and associated mortality in 2012 were ~ 337,000 new cases and 143,000 deaths [1], both of which have increased steadily over the years [2, 3].
Clear cell RCC (ccRCC) is the most prevalent pathological subtype of this cancer, accounting for 80% of all cases. Recent advances in our understanding of the underlying genetic events leading to ccRCC have given rise to treatment modalities targeting the vascular endothelial growth factor (VEGF) signaling axis and its related pathways. Although VEGF tyrosine kinase inhibitors (VEGF-TKIs) and mammalian target of rapamycin (mTOR) inhibitors significantly extend the progression free survival of patients with metastatic RCC [4], drug resistance invariably occurs.
Recently, cabozantinib, an inhibitor of tyrosine kinases including MET, VEGF receptor, and Anexelekto [5], and nivolumab, an immune check point inhibitor targeting programmed cell death 1 on tumor-infiltrating lymphocytes [6], became available for clinical use. But it is still necessary to identify new molecular targets for the treatment of patients with metastatic ccRCC to improve the treatment outcome. To identify new therapeutic targets, we performed a transcriptome analysis of ccRCC and normal kidney samples. Among the up-regulated genes in ccRCC, we focused on the five most differentially expressed genes; prolyl hydroxylase 3 (PHD3), fatty acid binding protein 7 (FABP7), carbonic anhydrase IX (CAIX), NADH dehydrogenase 1 alpha subcomplex, 4-like 2 (NDUFA4L2), and monocarboxylate transporter 4 (MCT4).
FABP7 is known to be upregulated in brain tissue, and its function is well studied in glioblastoma cell lines. Zhou et al. reported that FABP7 is significantly up-regulated in ccRCC and that the expression of FABP7 positively correlates with advanced clinical stage and poor survival of patients with ccRCC [7]. Overexpression of FABP7 in RCC cells enhances cell growth and cell cycle progression, which activates both extracellular-signal-regulated kinases (ERK) and signal transducer and activator of transcription 3 (Stat3) signaling.
To the best of our knowledge, this is the first report about the complementary role of fatty acid binding protein 6 (FABP6) for FABP7 in ccRCC.
Methods
Transcriptome analysis
Total RNA was extracted from 60 ccRCC samples (49 cases without metastasis, and 11 cases with synchronous metastasis at nephrectomy), and 20 corresponding normal kidney samples using the TRIzol Reagent (Invitrogen®). The tumor samples contained > 70% tumor cells as estimated by microscopy. Gene expression analysis was performed on the Genechip Human Gene 1.0 ST Array (Affymetrix®), according to the manufacturers’ instructions. The expression profiles were analyzed using an unsupervised hierarchical average linkage-clustering algorithm. The analysis was ethically approved at our institution (Radboud University Medical Center, Nijmegen).
Antibodies
The following primary antibodies were used: anti-CAIX monoclonal antibody M75 (HB-11128, ATCC), rabbit anti-NDUFA4L2 (Proteintech®), anti-PHD3 monoclonal antibody (Novus Biologicals®), rabbit anti-MCT4 (Millipore®), rabbit anti-FABP7 polyclonal antibody (produced by a co-author, YO [8]), and a mouse anti-Stat3 monoclonal antibody (Abcam®). Primary antibodies were detected using a horseradish peroxidase (HRP)-conjugated rabbit anti-mouse immunoglobulin antibody) (DAKO®) and HRP-conjugated swine anti-rabbit immunoglobulin antibody (DAKO®) (secondary antibodies).
Immunohistochemistry
For immunohsitochemical analysis, we used the slides of paraffin-embedded ccRCC and normal kidney samples extracted from the same cases used in our transcriptome analysis.
Slides of paraffin-embedded ccRCC samples were deparaffinized in xylene, followed by incubation in a graded series of ethanol (100, 70 and 50%) and re-hydration in PBS. The slides were immersed in 3% H2O2 for 30 min at room temperature to block endogenous peroxidase activity. After a PBS wash, the slides were immersed in 10 mM citrate buffer (pH 6.0) and heated in a microwave oven for 10 min at 100 °C. After cooling to room temperature, the slides were blocked in 20% normal goat serum for 10 min. The tissue slices were then incubated with the mouse anti-CAIX monoclonal M75 antibody (1600 dilution), rabbit anti-NDUFA4L2 polyclonal antibody (12,000 dilution), mouse anti-PHD3 monoclonal antibody (1200 dilution), rabbit anti-MCT4 polyclonal antibody (1200), or the rabbit anti-FABP7 polyclonal antibody (11000) for 90 min at room temperature, washed in PBS, and then incubated with the appropriate secondary antibody for 1 h at room temperature (1100 dilution). After washing with PBS, the slides were incubated in a PowerVision DAB solution (40 μl of Solution A + 40 μl of Solution B + 5 μl of Tween 20 brought up to 1 ml with PBS, ImmunoLogic®) for 10 min at room temperature, washed again in tap water, counterstained with hematoxylin, and mounted in Permount (Fisher Scientific®).
Patients’ characteristics in the cases analyzed by FABP7 immunohistochemical staining
We retrospectively reviewed the clinical data of 40 patients with metastatic ccRCC who had undergone nephrectomy, followed by systemic therapy using either a cytokine, VEGF-TKIs, or mTOR inhibitors in Yamaguchi University Hospital. The analysis was ethically approved at our institution (Yamaguchi University Hospital).
Evaluation of FABP7 expression status in ccRCC specimens
We scored the FABP7 staining index based on the staining intensity (Fig. 2a, low: 1, intermediate: 2, high: 3, and nuclear staining: 4 points) and the number of the cells as calculated by the formula: (staining intensity 1, 2, 3, or 4) × cell counts per 500 cells in each sample of ccRCC specimen. The mean value of the index was 11 in all the cases analyzed. We defined the case with more than mean value of the index as high FABP7 expression case, and also defined the case with less than mean value of the index as low FABP7 expression case.
Fig. 2.

FABP7 expression in ccRCC samples. a Immunohistochemical staining for FABP7. Different immunohistochemical staining intensities in paraffin-imbedded tissues slices (magnification: × 400) are shown. Vertical axis shows the FABP7 staining index. Eleven is the mean value of the index in 40 cases. The horizontal axis shows the number of cases. b Distribution of FABP7 expression in clinical cases. Vertical axes show the FABP7 staining index. Eleven is the mean value of the index in 40 cases. The horizontal axis shows the number of the cases. ●: Male case, ●: Female case. c Correlation between FABP7 expression and cancer-specific survival. Vertical axis shows the cancer-specific survival rate. The horizontal axis shows the days after treatment
RNA extraction and real-time quantitative RT-PCR
Total RNA was extracted from the cultured cells using the TRIzol Reagent (Invitrogen®). RNA was used for reverse transcription with SuperScript II RNase Hˉ Reverse Transcriptase (Invitrogen®). The cDNA synthesis was performed using 2 μg of RNA with a mix of reverse transcriptase, 5× first-strand buffer, DTT, dNTPs, and random hexamers.
qRT-PCR was run using a LightCycler 480 Real-Time PCR System (Roche®). The SYBR Green method was used to measure hypoxanthine phosphoribosyltransferase 1 (HPRT), CAIX, MCT4, FABP7 and FABP6 mRNA expression and the TaqMan method to measure HPRT, PHD3-, and NDUFA4L2 mRNA expression levels. The primer sequences were as follows:
-
HPRT
Forward primer sequence: 5’CTCAACTTTAACTGGAAAGAATGTC3’
Reverse primer sequence: 5’TCCTTTTCACCAGCAAGCT3’
Probe sequence: 5’TTGCTTTCCTTGGTCAGGCAGTATAATC3’
-
CAIX
Forward primer sequence: 5’TAAGCAGCTCCACACCCTCT3’
Reverse primer sequence: 5’TCTCATCTGCACAAGGAACG3’
-
MCT4
Forward primer sequence: 5’GCACCCACAAGT TCTCCAGT3’
Reverse primer sequence: 5’CAAAATCAGGGAGGAGGTGA3’
-
PHD3
Forward primer sequence: 5’GAATTGGGATGCCAAGCTACA3’
Reverse primer sequence: 5’TGACCAGAAGAACAGGAGTCTGTC3’
Probe sequence: 5’ATGGGCTCCACATCTGCTATGAATGATTTC3’
-
NDUFA4L2
Forward primer sequence: 5’GACGTCTGCTGGGACAGAAAG3’
Reverse primer sequence: 5’AGTGGAAACTGCAAGGAACTTGTA3’
Probe sequence: 5’CCGGAGCCCTGGAACCGC3’
-
FABP7
Forward primer sequence: 5’CTCAGCACATTCAAGAACACG3’
Reverse primer sequence: 5’CCATCCAGGCTAACAACAGAC3’
-
FABP6
Forward primer sequence: 5’ACTACTCCGGGGGCCACACCAT3’
Reverse primer sequence: 5’GTCTCTTGCTCACGCGCTCATAGG3’
HPRT mRNA expression served as an internal control. All the measurements were repeated at least twice to confirm reproducibility. The expression of the target mRNA was quantified relative to that of the HPRT mRNA and untreated controls were used as a reference according to the model described by Pfaffl [9].
Cell culture
Human ccRCC-derived cell lines (SKRC1, SKRC7, SKRC10, SKRC12, SKRC17, SKRC59, and CaKi1) were cultured in the RPMI 1640 medium supplemented with 10% of fetal calf serum and ʟ-glutamate (Gibco®) in a humidified atmosphere containing 5% of CO2 at 37 °C.
Western blot analysis
Protein expression levels were determined by western blot analysis. In brief, cells were lysed in a buffer consisting of 20 mM Tris-HCl (pH 7.5), 150 mmol/l NaCl, 0.1% SDS, 5 mmol/l EDTA, 1% of Triton X-100 (Sigma-Aldrich®), and 1 tablet of a protease inhibitor cocktail (cOmplete Mini, Roche®) per 10 mL of the buffer. The lysates were centrifuged at 13,200 rpm for 15 min at 4 °C, and the supernatants were collected to determine protein concentration using the BSA protein assay reagent. Total protein (10 or 20 μg) was separated by SDS-PAGE in a 10% gel and transferred to a filter using a semidry blotter. After blocking with 1% skimmed milk powder dissolved in PBS, the blots were incubated with the appropriate primary and secondary antibodies: the rabbit anti-FABP7 polyclonal antibody (1,5000) and mouse anti-Stat3 monoclonal antibody (110000). Detection was performed using the Amersham ECL Plus Western Blotting Detection Reagents kit (Amersham®), and protein expression levels were quantified in the ImageJ software (NIH, USA).
The knockdown with small interfering RNA (siRNA)
A commercially available mixture of 4 single-stranded 19-bp siRNAs (ON-TARGETplus SMARTpool, Invitrogen®) was used to transfect SKRC7 and SKRC10 cells according to the manufacturer’s instructions. The sequences of the siRNAs were 5’CAACGGUAAUUAUCAGUCA3’, 5’GUCAGAACUUUGAUGAGUA3’, 5’GAACACGGAGAUUAGUUUC3’, and 5’GAUGAUAGAAACUGUAAGU3’ for FABP7, 5’UCGGAGGCGUGACCUAUGA3’, 5’CCUCAGAGAUCGUGGGUGA3’, 5’GUGAGAAGAAUUAUGAUGA3’, and 5’GCAAGGAAAGCAACAUACA3’ for FABP6.
The final concentration of siRNA for transfection was 33 nmol/L. A scrambled siRNA served as a negative control (Invitrogen®). Transfection was carried out using Lipofectamine 2000 (Invitrogen®).
Cell viability assay
Cell viability was tested by a 3-(4,5-dimethylthiazol-2-yl)-2,5-diphenyltetrazolium bromide (MTT) assay.
SKRC7 and SKRC10 cells transfected with scrambled siRNA, FABP7 siRNA, or FABP6 siRNA were seeded in triplicate in 96-well plates at 4000 cells per well and cultured at 37 °C and 5% CO2 for up to 7 days. On the day of measurement, 30 μL of MTT Thiazolyl Blue (5 mg/mL: Sigma-Aldrich®) was added into each well, and the cells were incubated for an additional 4 h. Subsequently, 100 μL of DMSO was added, and the plate was shaken for 5 min at room temperature to dissolve the formazan crystals. Finally, optical density (OD) at 595 nm was measured (3550 Microplate Reader, Bio-rad®).
Cell invasion assay
This assay was conducted using a BD BioCoat Matrigel Invasion Chamber (BD-Biosciences®).
SKRC10 cells were harvested 48 h after transfection at 37 °C. The transfected cells were re-suspended in serum-free Dulbecco’s modified Eagle’s medium and then added to the upper chamber at a density of 2 × 10⁵ cells/well. After 24 h of incubation at 37 °C, cells migrating through the membrane were stained. The results are expressed as invading cells quantified at OD 560 nm.
Statistical analysis
Student’s t test was used for statistical analysis using commercially available software (JMP version 4, SAS). A different with a p-value less than 0.05 was considered significant.
Results
Transcriptome analysis
This analysis revealed numerous genes that were over-expressed in ccRCC samples compared to normal kidney tissues (Table 1). Five genes (PHD3, FABP7, CAIX, NDUFA4L2, and MCT4) were expressed approximately 10-fold higher in ccRCC specimens compared to normal kidney samples (Fig. 1a). Higher expression levels of these genes were also observed in The Cancer Genome Atlas Research Network (TCGA) database. The mRNA expression levels of PHD3, CAIX, NDUFA4L2, and MCT4 were equally high in most ccRCC samples, and did not depend on cancer progression. In contrast, the levels of FABP7 mRNA varied. Among the overexpressed genes, FABP7 had the highest mean expression level at the mRNA level, and the expression levels varied depending on the ccRCC cases.
Table 1.
Highly mRNA overexpression in ccRCC compared to normal kideny
| Gene Symbol | Ref Seq | LSMean (NK) | LSMean (RCC) | Fold-Change (RCC/NK) |
|---|---|---|---|---|
| FABP7 | NM_001446 | 3.20163 | 9.76575 | 94.6231 |
| NDUFA4L2 | NM_020142 | 5.26123 | 10.5235 | 38.3803 |
| CP | NM_000096 | 5.94544 | 10.8426 | 29.7987 |
| HIG2 | NM_013332 | 4.40522 | 9.16447 | 27.0818 |
| ANGPTL4 | NM_139314 | 3.92434 | 8.28295 | 20.5151 |
| CA9 | NM_001216 | 4.36817 | 8.66135 | 19.6054 |
| ANGPT2 | NM_001147 | 4.81109 | 8.97052 | 17.8695 |
| EGLN3 | NM_022073 | 5.49587 | 9.45616 | 15.5656 |
| C3 | NM_000064 | 7.32719 | 11.2612 | 15.2848 |
| AHNAK2 | NM_138420 | 3.73036 | 7.61734 | 14.7944 |
| NETO2 | NM_018092 | 4.68377 | 8.51052 | 14.1895 |
| ENO2 | NM_001975 | 4.74515 | 8.47351 | 13.254 |
| NNMT | NM_006169 | 5.63127 | 9.29046 | 12.6335 |
| LOX | NM_002317 | 6.23912 | 9.89302 | 12.5873 |
| CYP2J2 | NM_000775 | 4.48354 | 8.08306 | 12.1217 |
| TNFAIP6 | NM_007115 | 3.21484 | 6.78895 | 11.9101 |
| PNMA2 | NM_007257 | 4.42318 | 7.86148 | 10.8401 |
| RRM2 | NM_001034 | 3.95228 | 7.36327 | 10.6368 |
| VWF | NM_000552 | 5.54317 | 8.90743 | 10.2978 |
| CXCL10 | NM_001565 | 4.73448 | 8.09726 | 10.2872 |
| NPTX2 | NM_002523 | 4.07029 | 7.42967 | 10.263 |
| TMEM45A | NM_018004 | 3.75004 | 7.07615 | 10.029 |
| CXCL11 | NM_005409 | 3.39841 | 6.6673 | 9.63905 |
| SLC16A3 | NM_001042422 | 4.92069 | 8.18727 | 9.62364 |
| IGFBP3 | NM_001013398 | 7.18489 | 10.4391 | 9.54115 |
| ENPP3 | NM_005021 | 6.77557 | 9.96963 | 9.15181 |
| DNAH11 | NM_003777 | 3.34526 | 6.53492 | 9.12395 |
| SCD | NM_005063 | 6.71436 | 9.89784 | 9.08496 |
| CXCL9 | NM_002416 | 4.06238 | 7.23311 | 9.00504 |
| FCGR3A | NM_000569 | 4.98514 | 8.13677 | 8.88659 |
| BHLHE41 | NM_030762 | 5.29995 | 8.40999 | 8.63406 |
| HK2 | NM_000189 | 4.30467 | 7.39848 | 8.53744 |
| PCSK6 | NM_002570 | 4.33254 | 7.34167 | 8.05077 |
| GBP5 | NM_052942 | 4.17666 | 7.1851 | 8.04697 |
| ESM1 | NM_007036 | 6.14498 | 9.1468 | 8.0101 |
| PDK1 | NM_002610 | 6.19808 | 9.19637 | 7.99055 |
Fig. 1.

Highly overexpressed molecules in ccRCC samples. a Highly upregulated genes based on the transcriptome analysis. The figure shows fold- changes of differential expression for highly upregulated genes. ●: normal kidney, ■: RCC that never metastasized, ▴: RCC that metastasized after nephrectomy, ×: RCC with metastasis prior to nephrectomy, ✳: metastatic RCC.Vertical and horizontal axes indicate fold changes in mRNA expression and numbers of cases, respectively. b Immunohistochemical staining for PHD3, CAIX, NDUFA4L2, and MCT4. Representative cases of immunohistochemical staining in paraffin-imbedded tissues slices (magnification: × 400)
Immunohistochemistry
Immunohistochemical staining was used to determine whether the differential mRNA expression of these genes was reflected in differential protein expression in the ccRCC and normal kidney samples. Homogenous staining was observed in ccRCC samples for PHD3, CAIX, NDUFA4L2, and MCT4, while the staining level of FABP7 varied among the cases. Representative cases of differential immunohistochemical staining for PHD3, CAIX, NDUFA4L2, and MCT4 in ccRCC and normal kidney samples are shown in Fig. 1b. CAIX was not expressed in normal kidneys. PHD3 expression was weak in all epithelial cells of the kidney, whereas MCT4 and NDUFA4L2 expression was restricted to the distal tubuli.
FABP7 immunohistochemical staining as a prognostic marker
We retrospectively reviewed the clinical data of 40 patients with metastatic ccRCC who had undergone nephrectomy, followed by systemic therapy using either a cytokine, VEGF-TKIs, or mTOR inhibitors in Yamaguchi University Hospital. The analysis was ethically approved at our institution (Yamaguchi University Hospital).
To evaluate the efficacy of FABP7 as a biomarker, we retrospectively reviewed the clinical data of 40 patients with metastatic ccRCC who had undergone nephrectomy, followed by systemic therapy using either a cytokine, VEGF-TKIs, or mTOR inhibitors in Yamaguchi University Hospital. The expression pattern of FABP7 was consistent in the cytoplasm, while nuclear expression varied. The expression of FABP7 was frequently observed in the peripheral lesion of the tumor with viable cancer cell, while was not in the central lesion with necrotic tissue. The expression level of FABP7 depended on the cases in agreement with transcriptome analysis. Distribution status of the FABP7 staining index among the 40 ccRCC cases is shown in Fig. 2b. We classified the cases into those with higher or lower expression of FABP7 based on the FABP7 staining index.
Table 2 depicts the relation of patient characteristics to FABP7 expression. The cases with higher FABP7 expression significantly correlated with distant metastasis and corrected calcium level (both, p < 0.05). Then we analysed the role of FABP7 expression as a prognostic marker. In our cohort, other known prognostic factors (pT stage, grade, Hb, neutrophil, LDH, CRP, Na, corrected calcium) could not show significant correlation with cancer-specific survival (CSS), while FABP7 could be a prognostic marker (Fig. 2c). Cases with higher FABP7 expression significantly correlated with poor CSS as compared to those with lower expression (p < 0.05).
Table 2.
Correlation between clinicopathological characteristics and FABP7 expression
| FABP7 index | ||||
|---|---|---|---|---|
| Characteristics | Criteria | High (> 11) | High (< 11) | P value |
| Age (years) | High (≥65) | 9 | 12 | 0.5273 |
| Low (< 65) | 11 | 8 | ||
| Gender | Male | 15 | 18 | 0.4075 |
| Female | 5 | 2 | ||
| Grade | High (3) | 10 | 6 | 0.3332 |
| Low (1 or 2) | 10 | 13 | ||
| pT stage | High (3) | 11 | 11 | 1 |
| Low (1 or 2) | 8 | 9 | ||
| N stage | + | 1 | 0 | 1 |
| – | 18 | 19 | ||
| M stage | + | 13 | 6 | < 0.05 |
| – | 4 | 11 | ||
| Natrium (mEq/l) | High (> 142) | 1 | 4 | 0.3398 |
| Low (≤142) | 18 | 15 | ||
| Albumin (g/dl) | High (≥3.7) | 8 | 12 | 0.5027 |
| Low (< 3.7) | 9 | 7 | ||
| Corrected Calcium (mg/dl) | High (≥10) | 9 | 3 | < 0.05 |
| Low (< 10) | 8 | 15 | ||
Functional effects of a FABP7 knockdown
The mRNA and protein expression levels of FABP7 were evaluated in 7 ccRCC-derived cell lines: SKRC1, SKRC7, SKRC10, SKRC12, SKRC17, SKRC59, and Caki1. The mRNA levels are shown in Fig. 3a. SKRC1, SKRC7, and SKRC10 showed higher expression levels of FABP7 compared to the other cell lines.
Fig. 3.

FABP7 expression in ccRCC cell lines. a Relative mRNA expression of FABP7 in ccRCC cell lines. Relative mRNA expression levels in ccRCC cell lines are shown. Vertical bars indicate the ratio of crossing point (CP) values (FABP7/HPRT). b Relative mRNA expression levels after a knockdown of FABP7. Relative mRNA expression levels after FABP7- siRNA transfection of SKRC10 cells are shown. Vertical bars indicate the ratio of crossing point (CP) values (FABP7/HPRT). c FABP7 protein expression after the FABP7 knockdown. Expression of FABP7 and Stat3 (molecular weights 15 and 88 kDa, respectively) decreased after FABP7- siRNA transfection into SKRC10 cells
We transfected FABP7- siRNA into SKRC10 cells to knock down the expression of FABP7. This transfection resulted in a > 90% reduction of mRNA expression for 7 days as compared to scramble transfection (Fig. 3b), and the protein level was also reduced (Fig. 3c). Interestingly, FABP7 knockdown reduced the expression of Stat3 (Fig. 3c).
We evaluated the effect of the FABP7 knockdown on SKRC10 cells by the MTT assay. Functional suppression of FABP7 resulted in significant growth inhibition of SKRC10 cells at 7 days after transfection (p < 0.05, Fig. 4a). A Matrigel invasion assay indicated a significant reduction in the invasive potential by the functional suppression of FABP7 (p < 0.01, Fig. 4b).
Fig. 4.

Effect of FABP7 knockdown in a ccRCC cell line. a The cell viability assay after the FABP7 knockdown. Proliferating SKRC10 cells after the knockdown of FABP7 expression were assessed by an MTT assay. Vertical bars indicate the value of optical density (OD) of the cells at 595 nm. *p < 0.05. b Invasion assay after the FABP7 knockdown. Invading SKRC10 cells after the knockdown of FABP7 were analyzed by the Matrigel Invasion assay. Vertical axis indicates the value of optical density (OD) of the cells at 560 nm. **p < 0.01
FABP6 expression
Although higher expression of FABP7 was observed in SKRC7 cells than in SKRC10 cells, suppression of FABP7 in SKRC7 cells did not affect the cell viability as shown in Fig. 5b. Therefore, we analysed relative mRNA expression of FABP6, a member of the FABP family, in ccRCC cell lines and showed high expression of FABP6 mRNA in SKRC7 cells, while SKRC10 cells had low expression of FABP6 mRNA (Fig. 5a).
Fig. 5.
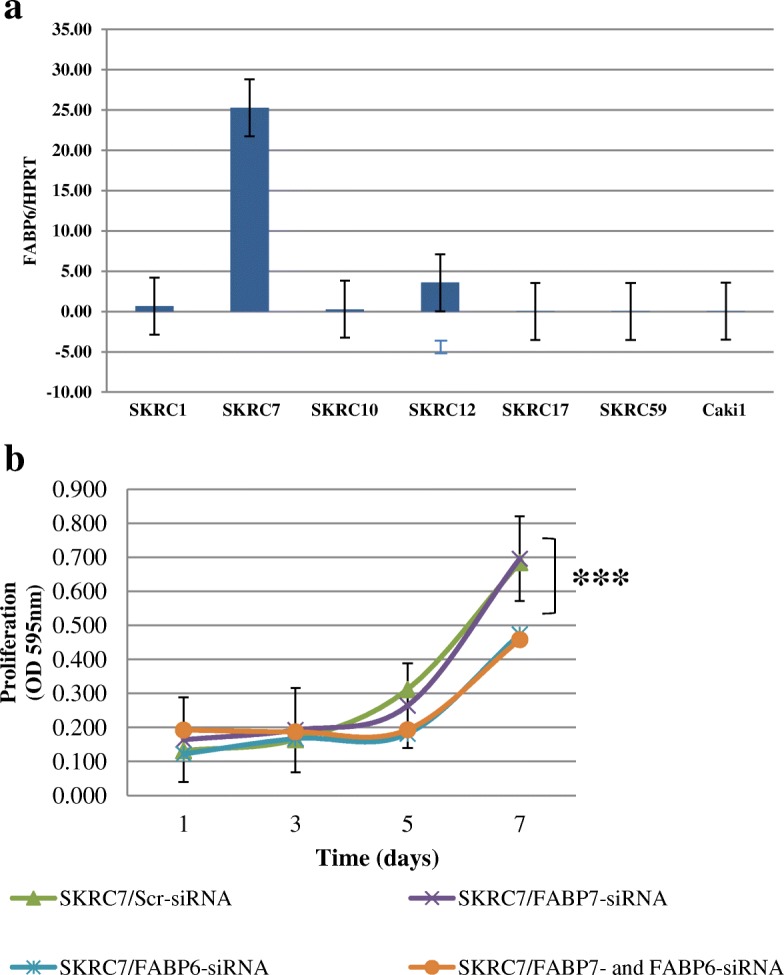
Effect of FABP7 knockdown in ccRCC cell lines. a Relative mRNA expression of FABP6 in ccRCC cell lines. Relative mRNA expression levels in ccRCC cell lines are shown. Vertical axis indicates the ratio of CP values (FABP6/HPRT). b Cell viability assay after FABP7 or/and FABP6 knockdown. Proliferating SKRC7 cells after the knockdown of FABP7 or/and FABP6 were analyzed by the MTT assay. Vertical axis indicates the value of optical density (OD) of the cells at 560 nm. **p < 0.05
We evaluated the effect of the FABP6 knockdown on SKRC7 cells by the MTT assay. Functional suppression of FABP6 resulted in significant growth inhibition of SKRC10 cells at 7 days after transfection (p < 0.05, Fig. 5b), while combined knock down of FABP7 and FABP6 did not inhibit the cell growth more than knock down of FABP6 alone. In SKRC7 cells, FABP6 seemed to compensate the role of FABP7 in cell proliferation.
Discussion
Most cancer cells undergo a metabolic shift from electron transport chain to glycolysis in producing energy, which resulted in synthesizing proteins and lipids. Increased glucose uptake and the accumulation of lactate are common features of cancer cells even under normoxic conditions named as the Warburg effect [10, 11]. HIF-1α promotes angiogenesis by inducing VEGF [12], which upregulates the transcription of various glycolytic genes to mediate a metabolic shift that shunts glucose metabolites away from mitochondria [13]. In ccRCC, hypoxia-inducible factor- 1α (HIF-1α) is overexpressed due to functional loss of the von Hippel-Lindau (VHL) protein. Recent studies showed that the Warburg Effect in cancer cells can be targeted by inhibition of glucose transporter 1, [14], or conversion of lactate to pyruvate by lactate dehydrogenase A (LDH-A) [15]. HIF-1a was reported to regulate the expression of fatty acid synthase (FASN) [16], which facilitate fatty acid synthesis and lipid storage [17]. Recently, several FASN inhibitors were reported to show antitumor effect against breast [18], ovarian [19], and prostate cancers [20] in preclinical models.
Based on our transcriptome analysis, we focused on the five most differentially expressed genes: PHD3, FABP7, CAIX, NDUFA4L2, and MCT4. All the genes have been regarded as working downstream of HIF in relation to hypoxia, metabolism, and pH regulation in cancer, which are supposed to induce the Warburg effect [21]. Our results are in good agreement with a meta-analysis of 5 ccRCC expression datasets available in Oncomine [22], in which NDUFA4L2, PHD3, CAIX, and MCT4 showed the 1st, 2nd, 7th, and 11th highest expression level, respectively. In addition, our data indicate that these genes are equally highly expressed in tumor samples of non-metastatic and metastatic cases, which revealed that these genes are stably over-expressed in the vast majority of ccRCCs compared to normal kidney tissue regardless of the metastatic potential or tumor stage. In contrast, heterogeneous distribution of mRNA expression of FABP7 with a higher average value leads to the hypothesis that FABP7 may be involved in cancer progression in ccRCC.
FABP7 is a member of the FABP family, which is known to have family members 1 to 7 in cancer tissue. Bensaad et al. showed that a knockdown of FABP3, FABP7, or Adipophilin impaired lipid droplet formation under hypoxic conditions in glioblastoma and breast cancer cell lines [23]. They supposed that inhibition of lipid storage may reduce the ability in protecting the cancer cells from toxicity by reactive oxygen and decrease the survival of the cancer cells under the condition of hypoxia-reoxygenation. Liu et al. reported that FABP7 is significantly up-regulated in triple-negative breast cancer and that the high expression level of FABP7 is associated with poor prognosis [24]. They also showed that depletion of FABP7 significantly reduced the growth rate of cancer cells, which leads to sensitize the growth inhibition by omega-3 docosahexaenoic acid (DHA). We also added DHA to the FABP7- knockdown SKRC10 cells in a cell viability assay, but growth inhibition was not affected (data not shown). In FABP7-overexpressing RCC cells, Zou et al. showed that overexpression of FABP7 in RCC cells promotes cell growth by the activation of ERK and Stat3 signaling pathways [7]. In our study, it was also confirmed that the knockdown of FABP7 reduced Stat3 expression, which may result in growth inhibition and reduction of the invasive potential.
On the other hand, Takaoka et al. reported that the levels of FABP7 expressed in a ccRCC cell line (TUHR14TKB) and their doubling times decreased during passage. They also reported that the proliferation and the cell migration property of the cell line decreased when FABP7 was overexpressed. They concluded that the difference in FABP7 function between RCC cell lines suggests that FABP7 affects cell proliferation depending on cell phenotype [25].
Although FABP6 mRNA was not highly differentially expressed in our transcriptome analysis, it does have high differential expression in ccRCC tissues compared to normal tissue according to TCGA database (Table 3) [26]. The expression level of FABP6 mRNA is reported to be comparable to that of FABP7 mRNA, while there are no reports showing prognostic significance of FABP6 in ccRCC. Ohmachi et al. reported that the expression of FABP6 is higher in primary colorectal cancers than in normal epithelium, but is decreased in lymph node metastases. They supposed that FABP6 may play an important role in early carcinogenesis [27]. Our study showed that FABP6 can complement FABP7 in a cell type-dependent manner and indicates that a knockdown of FABP7 and/or FABP6 can reduce viability and invasive potential of ccRCC cells. Specific inhibition of fatty acid binding proteins may be a novel strategy against ccRCC.
Table 3.
mRNA expression level of FABP family in ccRCC
| Gene | LSMean (Tumor) | LSMean (Normal Kidney) | Fold-Change (RCC/NK) |
|---|---|---|---|
| FABP1 | 605,588 | 14,528,517 | 0.04 |
| FABP2 | 6465 | 37,070 | 0.17 |
| FABP3 | 13,401,684 | 19,556,421 | 0.69 |
| FABP4 | 1,330,864 | 2,052,261 | 0.65 |
| FABP5 | 938,428 | 236,739 | 3.96 |
| FABP6 | 4,804,806 | 65,430 | 73.43 |
| FABP7 | 56,445,770 | 809,368 | 69.74 |
Cancer Genome Atlas Research Network
Comprehensive molecular characterization of clear cell renal cell carcinoma
Nature. 2013 Jul 4;499(7456):43–9
Conclusions
Functional suppression of FABP7 significantly reduced cell viability and invasive potential in a ccRCC cell line. FABP7 may play a role in progression in some metastatic ccRCCs. The suppressed function may be compensated by another FABP family member.
Acknowledgments
Dr. Yuki Yasumoto kindly provided us the FABP7 polyclonal antibody produced by YO, a co-author of this article.
Funding
There is no specific funding for the study.
Financial support was obtained from internal funding of Department of Urology, Graduate School of Medicine, Yamaguchi University and Department of Urology, Radboud University Medical Center.
Availability of data and materials
The datasets used and/or analyzed during the current study are available from the corresponding author, KN, on reasonable request.
Authors’ contributions
KN and NS carried out the molecular biological studies (immunohistochemistry, western blotting, qRT-PCR, and knock-down experiment) and drafted the manuscript. FS, MD and SJ carried out the transcriptome analysis and performed instruction for qRT-PCR. YO carried out the comprehension of the acquired data in the study and instruction for immunohistochemistry. PM and EO supervised the design, methods and results of the study and helped to draft the manuscript. HM participated in its design and coordination of the study and helped to draft the manuscript. All authors read and approved the final manuscript.
Ethics approval and consent to participate
Written informed consent was obtained from all the participants and the analysis was ethically approved at our institution. The approval number from the ethics committee is CWOM9803–0060 in Radboud University Medical Center. The approval number from the ethics committee is H27–023-3 in Yamaguchi University Hospital.
Consent for publication
Not applicable.
Competing interests
The authors declare that they have no competing interests.
Publisher’s Note
Springer Nature remains neutral with regard to jurisdictional claims in published maps and institutional affiliations.
Contributor Information
Kazuhiro Nagao, Email: knag4112@yamaguchi-u.ac.jp.
Nachi Shinohara, Email: leftina371@yahoo.co.jp.
Frank Smit, Email: Frank.Smit@mdxhealth.com.
Mirjam de Weijert, Email: M.deWeijert@uro.umcn.nl.
Sander Jannink, Email: sanderjannink@hotmail.com.
Yuji Owada, Email: owada@med.tohoku.ac.jp.
Peter Mulders, Email: Peter.Mulders@radboudumc.nl.
Egbert Oosterwijk, Email: Egbert.Oosterwijk@radboudumc.nl.
Hideyasu Matsuyama, Email: hidde@yamaguchi-u.ac.jp.
References
- 1.International for Research on Cancer, World Health Organization. GLOBOCAN . Estimated Cancer Incidence, Mortality and prevalence Worldwide. 2012. [Google Scholar]
- 2.Hollingsworth JM, Miller DC, Daignault S, Hollenbeck BK. Rising incidence of small renal masses: a need to reassess treatment effect. J Natl Cancer Inst. 2006;98:1331–1334. doi: 10.1093/jnci/djj362. [DOI] [PubMed] [Google Scholar]
- 3.Hollingsworth JM, Miller DC, Daignault S, Hollenbeck BK. Five-year survival after surgical treatment for kidney cancer: a population–based competing risk analysis. Cancer. 2007;109:1763–1768. doi: 10.1002/cncr.22600. [DOI] [PubMed] [Google Scholar]
- 4.Pal SK, Ghate SR, Li N, Swallow E, Peeples M, et al. Real-World Survival Outcomes and Prognostic Factors Among Patients Receiving First Targeted Therapy for Advanced Renal Cell Carcinoma: A SEER-Medicare Database Analysis. Clin Genitourin Cancer. 2017;15(4):e573–e582. doi: 10.1016/j.clgc.2016.12.005. [DOI] [PubMed] [Google Scholar]
- 5.Choueiri TK, Halabi S, Sanford BL, Hahn O, Michaelson MD, et al. Cabozantinib versus sunitinib as initial targeted therapy for patients with metastatic renal cell carcinoma of poor or intermediate risk: the alliance A031203 CABOSUN trial. J Clin Oncol. 2017;35(6):591–597. doi: 10.1200/JCO.2016.70.7398. [DOI] [PMC free article] [PubMed] [Google Scholar]
- 6.Motzer RJ, Escudier B, McDermott DF, George S, Hammers HJ, et al. Nivolumab versus Everolimus in Advanced Renal-Cell Carcinoma. N Engl J Med. 2015;373(19):1803–1813. doi: 10.1056/NEJMoa1510665. [DOI] [PMC free article] [PubMed] [Google Scholar]
- 7.Zhou J, Deng Z, Chen Y, Gao Y, Wu D, et al. Overexpression of FABP7 promotes cell growth and predicts poor prognosis of clear cell renal cell carcinoma. Urol Oncol. 2015;33(3):113.e9–113.17. doi: 10.1016/j.urolonc.2014.08.001. [DOI] [PubMed] [Google Scholar]
- 8.Morihiro Y, Yasumoto Y, Vaidyan LK, Sadahiro H, Uchida T, et al. Fatty acid binding protein 7 as a marker of glioma stem cells. Pathol Int. 2013;63(11):546–553. doi: 10.1111/pin.12109. [DOI] [PubMed] [Google Scholar]
- 9.Pfaffl MW. A new mathematical model for relative quantification in real-time RT-PCR. Nucleic Acids Res. 2001;29(9):e45. doi: 10.1093/nar/29.9.e45. [DOI] [PMC free article] [PubMed] [Google Scholar]
- 10.Warburg O. On the origin of cancer cells. Science. 1956;123(3191):309–314. doi: 10.1126/science.123.3191.309. [DOI] [PubMed] [Google Scholar]
- 11.Vander Heiden MG, Cantley LC, Thompson CB. Understanding the Warburg effect: the metabolic requirements of cell proliferation. Science. 2009;324(5930):1029–1033. doi: 10.1126/science.1160809. [DOI] [PMC free article] [PubMed] [Google Scholar]
- 12.Semenza GL. Defining the role of hypoxia-inducible factor 1 in cancer biology and therapeutics. Oncogene. 2010;29(5):625–634. doi: 10.1038/onc.2009.441. [DOI] [PMC free article] [PubMed] [Google Scholar]
- 13.Kim JW, Tchernyshyov I, Semenza GL, Dang CV. HIF-1-mediated expression of pyruvate dehydrogenase kinase: a metabolic switch required for cellular adaptation to hypoxia. Cell Metab. 2006;3(3):177–185. doi: 10.1016/j.cmet.2006.02.002. [DOI] [PubMed] [Google Scholar]
- 14.Chan DA, Sutphin PD, Nguyen P, Turcotte S, Lai EW, et al. Targeting GLUT1 and the Warburg effect in renal cell carcinoma by chemical synthetic lethality. Sci Transl Med. 2011;3(94):94ra70. doi: 10.1126/scitranslmed.3002394. [DOI] [PMC free article] [PubMed] [Google Scholar]
- 15.Le A, Cooper CR, Gouw AM, Dinavahia R, Dinavahi R, Maitra A, et al. Inhibition of lactate dehydrogenase a induces oxidative stress and inhibits tumor progression. Proc Natl Acad Sci U S A. 2010;107(5):2037–2042. doi: 10.1073/pnas.0914433107. [DOI] [PMC free article] [PubMed] [Google Scholar]
- 16.Furuta E, Pai SK, Zhan R, Bandyopadhyay S, Watabe M, et al. Fatty acid synthase gene is up-regulated by hypoxia via activation of Akt and sterol regulatory element binding protein-1. Cancer Res. 2008;68:1003–1011. doi: 10.1158/0008-5472.CAN-07-2489. [DOI] [PubMed] [Google Scholar]
- 17.Menendez JA, Lupu R. Fatty acid synthase and the lipogenic phenotype in cancer pathogenesis. Nat Rev Cancer. 2007;7(10):763–777. doi: 10.1038/nrc2222. [DOI] [PubMed] [Google Scholar]
- 18.Alwarawrah Y, Hughes P, Loiselle D, Carlson DA, Darr DB, et al. Fasnall, a selective FASN inhibitor, shows potent anti-tumor activity in the MMTV-Neu model of HER2(+) breast cancer. Cell Chem Biol. 2016;23(6):678–688. doi: 10.1016/j.chembiol.2016.04.011. [DOI] [PMC free article] [PubMed] [Google Scholar]
- 19.Wagner R, Stübiger G, Veigel D, Wuczkowski M, Lanzerstorfer P, et al. Multi-level suppression of receptor-PI3K-mTORC1 by fatty acid synthase inhibitors is crucial for their efficacy against ovarian cancer cells. Oncotarget. 2017;8(7):11600–11613. doi: 10.18632/oncotarget.14591. [DOI] [PMC free article] [PubMed] [Google Scholar]
- 20.Wright C, Iyer AKV, Kaushik V, Azad N. Anti-tumorigenic potential of a novel Orlistat-AICAR combination in prostate cancer cells. J Cell Biochem. 2017;118(11):3834–3845. doi: 10.1002/jcb.26033. [DOI] [PMC free article] [PubMed] [Google Scholar]
- 21.Wilson WR, Hay MP. Targeting hypoxia in cancer therapy. Nat Rev Cancer. 2011;11(6):393–410. doi: 10.1038/nrc3064. [DOI] [PubMed] [Google Scholar]
- 22.Gerlinger M, Santos CR, Spencer-Dene B, Martinez P, Endesfelder D, et al. Genome-wide RNA interference analysis of renal cell carcinoma survival regulators identifies MCT4 as a Warburg effect metabolic target. J Pathol. 2012;227(2):146–156. doi: 10.1002/path.4006. [DOI] [PMC free article] [PubMed] [Google Scholar]
- 23.Bensaad K, Favaro E, Lewis CA, Peck B, Lord S, et al. Fatty acid uptake and lipid storage induced by HIF-1α contribute to cell growth and survival after hypoxia-reoxygenation. Cell Rep. 2014;9(1):349–365. doi: 10.1016/j.celrep.2014.08.056. [DOI] [PubMed] [Google Scholar]
- 24.Liu RZ, Graham K, Glubrecht DD, Lai R, Mackey JR, et al. A fatty acid-binding protein 7/RXRβ pathway enhances survival and proliferation in triple-negative breast cancer. J Pathol. 2012;228(3):310–321. doi: 10.1002/path.4001. [DOI] [PubMed] [Google Scholar]
- 25.Takaoka N, Takayama T, Ozono S. Functional analysis of fatty acid binding protein 7 and its effect on fatty acid of renal cell carcinoma cell lines. BMC Cancer. 2017;17(1):192. doi: 10.1186/s12885-017-3184-x. [DOI] [PMC free article] [PubMed] [Google Scholar]
- 26.Cancer Genome Atlas Research Network Comprehensive molecular characterization of clear cell renal cell carcinoma. Nature. 2013;499(7456):43–49. doi: 10.1038/nature12222. [DOI] [PMC free article] [PubMed] [Google Scholar]
- 27.Ohmachi T, Inoue H, Mimori K, Tanaka F, Sasaki A, et al. Fatty acid binding protein 6 is overexpressed in colorectal cancer. Clin Cancer Res. 2006;12(17):5090–5095. doi: 10.1158/1078-0432.CCR-05-2045. [DOI] [PubMed] [Google Scholar]
Associated Data
This section collects any data citations, data availability statements, or supplementary materials included in this article.
Data Availability Statement
The datasets used and/or analyzed during the current study are available from the corresponding author, KN, on reasonable request.