Abstract
Background
Chronic spinal cord injury (CSCI) is a worldwide clinical problem. We aimed to reveal differentially expressed (DE) lncRNAs and to find associated pathways that may function as targets for CSCI therapy.
Material/Methods
After a CSCI rat model was confirmed by the Basso Beattie Bresnahan (BBB) scale and the Magnetic Resonance Imaging (MRI) test, microarray analysis was used to obtain the expression profile of DE lncRNAs between CSCI rats and corresponding control rats. Then, bioinformatics analyses, including GO and KEGG pathway analysis, DE lncRNAs-mRNAs co-expression analysis, and several databases, were used to examine the function of these DE lncRNAs. Finally, quantitative real-time PCR (qRT-PCR) was used to evaluate the expressions of the 5 most significantly changed lncRNAs, Col6a1, and miR-330-3p.
Results
Our study identified 1266 DE lncRNAs and 847 DE mRNAs, among which lncRNA6032 was significant up-regulated. Furthermore, the expressions of miR-330-3p and Col6a1 associated with lncRNA6032 were down-regulated and up-regulated, respectively.
Conclusions
Our results showed that the abundance of DE lncRNAs may be associated with the risk of CSCI outcome and revealed a potential competitive endogenous RNA (ceRNA) pathway involved in CSCI. Further experiments in vivo and in vitro were essential to uncover the exact mechanism of this ceRNA pathway.
MeSH Keywords: Microarray Analysis; RNA, Long Noncoding; Spinal Cord Injuries
Background
Chronic spinal cord injury (CSCI), a devastating neurological disease, is the chronic phase of spinal cord injury (SCI) resulting in impaired motor, sensory, and autonomic functions. As is well known, SCI includes primary mechanical compression and secondary damage. Our CSCI model is a good simulation of the mechanical compression of the spinal cord and its secondary changes. Because SCI occurs frequently in young adults and dramatically improved treatment therapies have greatly increased life expectancy, the morbidity rate of CSCI is more than 50 times the annual prevalence of acute SCI [1]. In China, CSCI affects millions of people and approximately 120 000 new CSCI cases occur every year [2]. Although a number of studies have documented that inflammation after CSCI is a process contributing to both tissue injury and repair [3,4], the precise cellular and molecular mechanisms, especially the transcriptional or translational regulation of them, is still unknown.
With the rapid development of transcriptomics, we have established that no more than 2% of the human genome encodes for proteins, whereas approximately 75–90% of them are actively transcribed as non-coding RNAs (ncRNAs), most of which are lncRNAs (>200 nucleotides) [5–8]. Recently, increasing research has indicated that lncRNAs have critical roles in all biological processes, including central nervous system development and diseases [9–13]. To date, studies focused on lncRNAs under CSCI are still in their infancy.
Owing to a subdued neural regenerative response, established astrocytic scars, and suspended spontaneous functional recovery, rodents 4 weeks after SCI can be used as a chronic model of SCI [14–16]. In the present study, we conducted a comprehensive transcriptome analysis in rats from the CSCI group and the control (CON) group using Clariom D Rat genechip array and identified differentially expressed (DE) lncRNAs, mRNAs, and pre-miRNAs. In order to discover the function of DE lncRNAs, we then put associated DE mRNAs into the Kyoto Encyclopedia of Genes and Genomes (KEGG) and gene ontology (GO) for further analysis. Then, a co-expression network associated with lncRNAs and mRNAs was constructed. In addition, there is a hypothesis that lncRNAs may function as competing endogenous RNAs (ceRNAs) in modulating the function of mRNAs via competitive binding with miRNAs. The expressions of transcripts of specific mRNAs can be up-regulated through sharing miRNA response elements (MREs) with these lncRNAs. In combination with our previous pre-miRNA profile, we found its corresponding mature miRNA profile through UCSC database and miRBase database. Moreover, we obtained target miRNAs of DE lncRNAs from the UCSC database and RegRNA 2.0 database. Eventually, we discovered that MTA_TC0600001799.mm (which we named lncRNA6032) sequesters miR-330-3p to promote Col6a1 expression, which was established by quantitative real-time PCR (qRT-PCR). In summary, our results reveal a potential ceRNA pathway involved in CSCI.
Material and Methods
Animal
Thirty-two adult male Sprague-Dawley rats (200–250 g) were purchased from Beijing Huafukang Biotechnology Co., Ltd. (Beijing, China). The care of animals and experimental procedures complied with the Animal Ethical and Welfare Committee of the Chinese Academy of Medical Sciences Institute of Radiation Medicine and conformed to internationally recognized guidelines. All rats were maintained under a condition with standard temperature and diurnal light control and had free access to water and food.
Model establishment and motor function
Rats were divided into the CSCI group (n=16) and the CON group (n=16). Simply, rats were intraperitoneally anesthetized using 4% chloral hydrate (10 ml/kg) [17]. Then, rats in the CON group underwent a unilateral laminectomy left at the C6 level. Rats in the CSCI group underwent laminectomy the same as in the CON group and then 1.2×1.2×2 mm dried water-absorbing polyurethane polymer sheets coated with a sustained-release membrane, which was kindly provided by Dr. Yong Hu, and which can reach the maximum volume in 24 h through progressive compression and remain at the maximal expansion, were implanted into the C5 epidural space on the left dorsolateral side. Then, rats were individually housed for 28 days in the environment described previously.
Locomotor activity was evaluated every day after injury using the Basso Beattie Bresnahan (BBB) scale [18]. Double-blinded methods were used by 2 trained researchers and the average score of each group was counted. Moreover, MRI was performed at 28 days after surgery on a 1.5 T clinical MR imaging system (GE Signal HDxt; General Electric Company; USA), with a 4.7-cm surface coil. The ventral recumbent position was preferred for scanning after general anesthesia. The imaging protocol involved T1-weighted imaging (T1WI) (TR/TE range, 480/20 ms; slice thickness 2.0 mm; intersection gap 0.1 mm; FOV 26 cm) and T2-weighted imaging (T2WI) (TR/TE range, 2300/120 ms; slice thickness 2.0 mm; intersection gap 0.1 mm; FOV 26 cm).
Samples collection and total RNAs isolation
Deeply anesthetized rats were perfused through the ascending aorta with phosphate-buffered saline on the 28th day. After that, spinal cords of C5 were harvested. Purified total RNAs were synthesized from spinal cord segments by using TRIzol reagent (Invitrogen, Carlsbad, CA, USA) according to the manufacturer’s instructions.
Microarray assay
Synthetization of labelled cDNA and cRNA, Clariom D Rat GeneChips hybridization, and washing, staining, and scanning after hybridization were performed according to Affymetrix protocols. The standardization of hybridization data was processed by Affymetrix GeneChip Operating Software (GCOS). Transcripts with more than 1.1 change folds (FC) and P values of <0.05 were considered as DE. This microarray assay was carried out by Tianjin St. Regis Biotechnology Co., Ltd, Tianjin, China.
Bioinformatics analysis
As the function of lncRNAs was associated with upstream and downstream coding regions (within 10 kb), GO analysis and KEGG pathway analysis were employed for DE mRNAs. Furthermore, co-expression analysis of DE lncRNAs and mRNAs was used if the correlation coefficient between them was more than 0.98. In addition, we obtained DE mature miRNAs according to DE pre-miRNAs through the UCSC database and miRbase database, and target miRNAs of the most significantly changed lncRNAs were obtained from the UCSC database and RegRNA 2.0 database. Among these miRNAs, we searched target mRNAs of common miRNAs by use of several databases, including miRbase and Targetscan.
qRT-PCR validation array
The purified total RNAs described above were reverse-transcribed to cDNAs by using the PrimeScript™ RT Reagent Kit (Takara, Otsu, Japan) in accordance with the standard instructions. Then, we used the DeNovix DS-11 Spectrophotometer (DeNovix, USA) with SYBR Premix Ex Taq™ (Takara, Otsu, Japan) for qRT-PCR testing. The expressions of lncRNAs, including MTA_TC1000000323.mm, lncRNA6032, kakla, lncRNA (chr18: 29647839-29647979) and lncRNA (chr10: 55656404-55656541), miRNA miR-330-3p, and mRNA Col6a1, in the spinal cord were normalized to the expression of the housekeeping gene with the 2−ΔΔCT method [19]. lncRNAs and Col6a were normalized to β-actin and miR-330-3p was normalized to U 6. All experiments were performed 3 times. The primers used are shown in Table 1.
Table 1.
List of primers for qRT-PCR.
| Gene name | Primer sequence (5′to 3′) | Product length (bp) |
|---|---|---|
| MTA_TC1000000323.mm | FW: CCACCTGACGACAATGGAGC | 20 |
| RV: CACAGAAATGGCGTAGGTAGAAG | 23 | |
| lncRNA6032 | FW: TGCGACTTTGTGACTGCTT | 19 |
| RV: TCCTTTCTGGTCCATCTCC | 19 | |
| kakla | FW: GGGAGGGACTTGAATGTGGA | 20 |
| RV: GCTTGCCTTGGTGAACGCTAT | 21 | |
| lncRNA (chr18: 29647839-29647979) | FW: GGCCAGCTTTAGCTCAGCG | 19 |
| RV: CGAACCAACCACTCACCAGATAG | 23 | |
| lncRNA (chr10: 55656404-55656541) | FW: TCCTTACCTGTTCCTCCTCT | 20 |
| RV: TCAGGATGTTGTCAGGTCC | 19 | |
| miR-330-3p | FW: TGCGGGCAAAGCACAGGGCCTGCAG | 25 |
| RV: CCAGTGCAGGGTCCGAGGT | 19 | |
| Col6a1 | FW: ACTTGATCGTGGTGACTGACG | 21 |
| RV: TGGCGATGATGCTTAGACG | 19 | |
| β-actin | FW: AGGGAAATCGTGCGTGACAT | 20 |
| RV: CCTCGGGGCATCGGAA | 16 | |
| U6 | FW: GCTCGCTTCGGCAGCACA | 18 |
| RV: AACGCTTCACGAATTTGCGTG | 21 |
FW – forward; RV – reverse.
Statistical analysis
R and Bioconductor programs were utilized to analyze microarray data. The BBB scores were analyzed by multivariate analysis of variance (MANOVA). All continuous variables are expressed as mean ± SD or mean ±SEM, and Mann-Whitney U test and unpaired t test were performed for comparison analysis. The criterion of P<0.05 was statistical significance.
Results
Validation of CSCI model
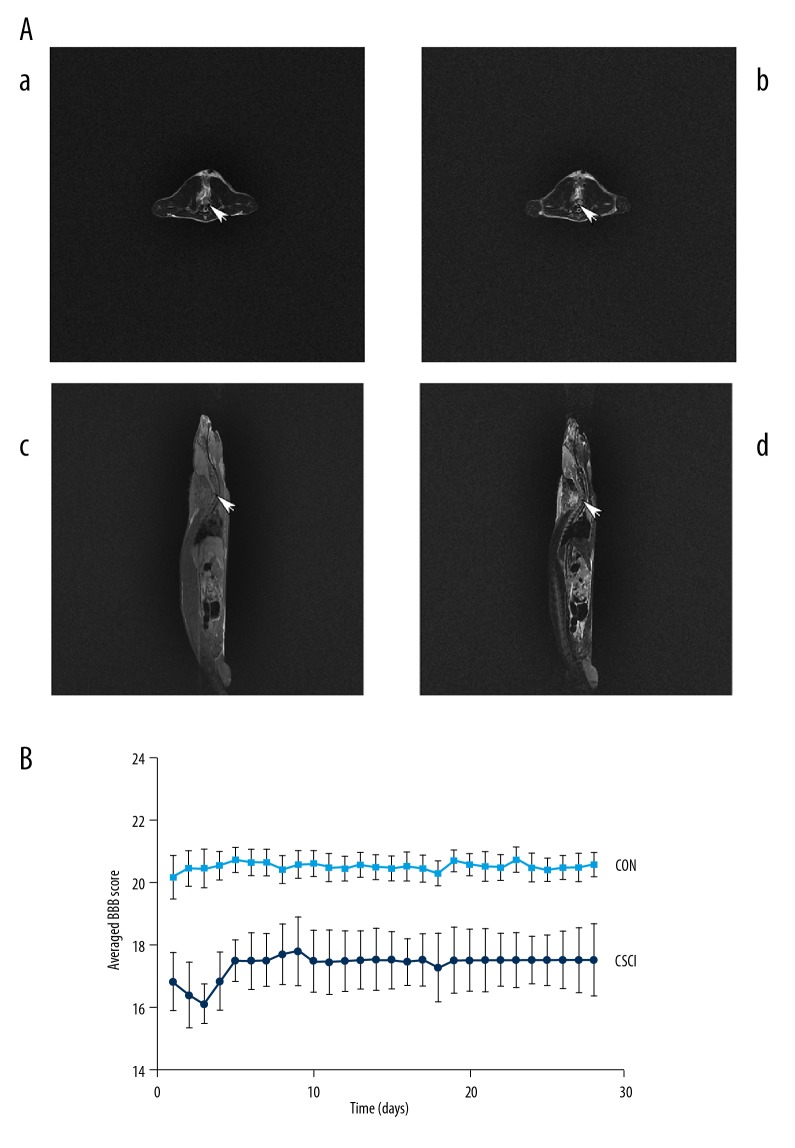
In our recent research, the animal model was established according to previous reports [20–22]. All rats from the CSCI group were paralyzed in the left forelimb from the first postoperative day, while rats from the CON group were almost normal. As indicated in Figure 1B, locomotor activity of rats in the CSCI group were first worsened and then improved gradually thereafter. However, movements of the CON group rats were regular during the experimental process, as evaluated by BBB scale scores.
Figure 1.
(A) T2-weighted transverse (a) cervical MRI of the CON group at C5 spinal cord is normal, while T2-weighted transverse (b) and T1- and T2-weighted sagittal (c, d) cervical MRI of the CSCI group show compression at C5 level with low spinal signal 28 days after surgery. (B) Line graph demonstrates the mean ±SD of the averaged BBB score of the CSCI group (n=16) vs. the CON group (n=16). *** P<0.001.
MRI was used to assess the spinal cord of C5 28 days postoperatively following behavioral tests. Compared to the CON group, the C5 spinal cord of the CSCI group was significantly compressed on the left with weighted sagittal and transverse imaging (Figure 1A).
DE lncRNAs and mRNAs
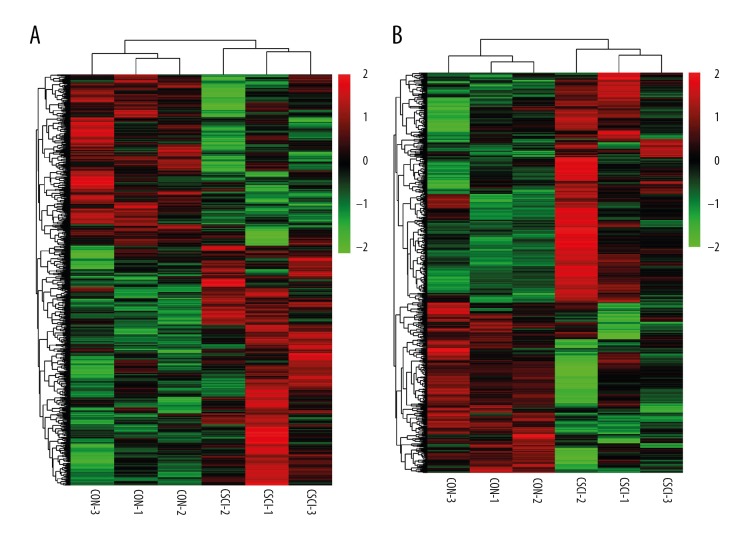
A graphical outline of the expression characteristics of lncRNAs and mRNAs is shown in heatmap through hierarchical clustering analysis. The heatmap of DE lncRNAs (Figure 2A) or mRNAs (Figure 2B) indicated a high concordance in either CSCI or CON samples. Compared to the control group, 1266 lncRNAs (738 up-regulated and 528 down-regulated) and 847 mRNAs (487 up-regulated and 360 down-regulated), were significantly changed in the CSCI group. We present the top 10 up-regulated and down-regulated lncRNAs and mRNAs in Tables 2 and 3.
Figure 2.
Heatmap showing hierarchical clustering of lncRNAs (A) or mRNAs (B) between the CSCI group and the CON group. In clustering analysis, compared to the CON group, up- and down-regulated genes are colored in red and green, respectively.
Table 2.
Details of the top 10 up-regulated (A) and 10 down-regulated (B) lncRNAs.
| (A) Gene symbol | Identified lncRNA | Gene location | Fold change | P-value |
|---|---|---|---|---|
| NA | NA | chr10: 55656404-55656541 | 4.370121079 | 0.00283592 |
| NA | NA | chr18: 29647839-29647979 | 2.531533674 | 3.48684828 |
| MTA_TC1000000323.mm | MTA_TR1000000963.mm | chr20: 44102881-44103700 | 2.446035343 | 0.03056308 |
| kakla | kakla.aSep08-unspliced | chr1: 221200474-221204272 | 2.44155652 | 0.02868856 |
| MTA_TC0600001799.mm | MTA_TR0600006032.mm | chr4: 29564290-29571817 | 2.331055367 | 0.00086609 |
| NA | NA | chr6: 141344474-141345232 | 2.274962867 | 0.02572412 |
| XLOC_002175 | TCONS_00002938 | chr1: 225202604-225214883 | 2.23071736 | 0.01884398 |
| MTA_TC0X00000333.mm | MTA_TR0X00000930.mm | chrX: 123705239-123707266 | 2.082480188 | 0.00219299 |
| MTA_TC1000001396.mm | MTA_TR1000004367.mm | chr9: 17954218-17954244 | 2.065710328 | 0.0063028 |
| MTA_TC0600002866.mm | MTA_TR0600009351.mm | chr4: 133918125-133919091 | 2.059081008 | 0.00476291 |
| (B) Gene symbol | Identified lncRNA | Gene location | Fold change | P-value |
|---|---|---|---|---|
| MTA_TC1600001360.mm | MTA_TR1600004752.mm | chr11: 83489887-83489912 | −2.128404794 | 0.026189908 |
| MTA_TC1800001268.mm | MTA_TR1800003930.mm | chr18: 37706516-37709787 | −2.040078252 | 0.03631665 |
| MTA_TC1000000945.mm | MTA_TR1000003181.mm | chr7: 26464110-26464134 | −2.039182102 | 0.014653006 |
| MTA_TC0900002141.mm | MTA_TR0900006852.mm | chr8: 48386225-48386651 | −2.006777645 | 0.019561879 |
| MTA_TC1100002787.mm | MTA_TR1100010385.mm | chr10: 40846389-40848909 | −1.870436967 | 0.003840454 |
| MTA_TC1800000481.mm | MTA_TR1800001445.mm | chr18: 40604887-40605472 | −1.708460993 | 0.006465048 |
| RGD7555511_1 | mRNARGD7555512_1 | chr2: 237494519-237509639 | −1.684042914 | 0.000496333 |
| MTA_TC0600002100.mm | MTA_TR0600007000.mm | chr4: 66163521-66164736 | −1.672222171 | 0.001409912 |
| MTA_TC0800000451.mm | MTA_TR0800001347.mm | chr16: 59310934-59313422 | −1.64766913 | 0.003686691 |
| RGD7743684_1 | mRNARGD7743686_1 | chr3: 52533372-52642383 | −1.616079993 | 0.006521954 |
Table 3.
Details on the top 10 up-regulated (A) and 10 down-regulated (B) mRNAs.
| (A) Gene symbol | Identified lncRNA | Gene location | Fold change | P-value |
|---|---|---|---|---|
| Cxcl13 | NM_001017496 | chr14:15253146-15258220 | 6.955265872 | 0.001050302 |
| Postn | NM_001108550 | chr2:143656812-143688087 | 6.076214816 | 0.000576185 |
| Serpina3n | NM_031531 | chr6:128073337-128082355 | 3.526377745 | 0.023874686 |
| Ms4a6bl | NM_001006975 | chr1:227240417-227254198 | 2.778223887 | 0.018778863 |
| Abca1 | NM_178095 | chr5:69859632-69952466 | 2.64754434 | 0.000123318 |
| Ms4a4a | ENSRNOT00000074966 | chr1:227217960-227236580 | 2.557907489 | 0.043518789 |
| Slfn2 | NM_001107031 | chr10:70370354-70376718 | 2.325841943 | 0.042159484 |
| Hmox1 | NM_012580 | chr19:14507938-14515457 | 2.316866342 | 0.028461287 |
| Ms4a6b | ENSRNOT00000032937 | chr1:227798223-227818291 | 2.227668253 | 0.030770288 |
| Fbn1 | NM_031825 | chr3:117569589-117766141 | 2.076941594 | 0.04070993 |
| (B) Gene symbol | Identified lncRNA | Gene location | Fold change | P-value |
|---|---|---|---|---|
| Vsnl1 | NM_012686 | chr6: 37001360-37122283 | −2.372215369 | 0.034705057 |
| Ahnak2 | ENSRNOT00000039631 | chr6: 137336306-137338612 | −2.135709453 | 0.008652922 |
| Elmod1 | NM_001191579 | chr8: 58486078-58542874 | −2.119824182 | 0.04520902 |
| Glra1 | NM_013133 | chr10: 40855211-40954358 | −2.075082513 | 0.035440845 |
| Hba2 | ENSRNOT00000048977 | chr10: 15589334-15590213 | −2.006964452 | 0.038707037 |
| Stmn2 | NM_053440 | chr2: 95424251-95472212 | −1.854421746 | 0.020427078 |
| Tspyl4 | NM_001012075 | chr20: 41100044-41104309 | −1.854334942 | 0.004438489 |
| Dync1i1 | NM_019234 | chr4: 30807565-31121100 | −1.841901455 | 0.044209806 |
| Asah2 | NM_053646 | chr1: 250557042-250665083 | −1.830845709 | 0.036783012 |
| Chn1 | NM_032083 | chr3: 60512361-60668397 | −1.798361176 | 0.016431555 |
GO and KEGG enrichment analysis
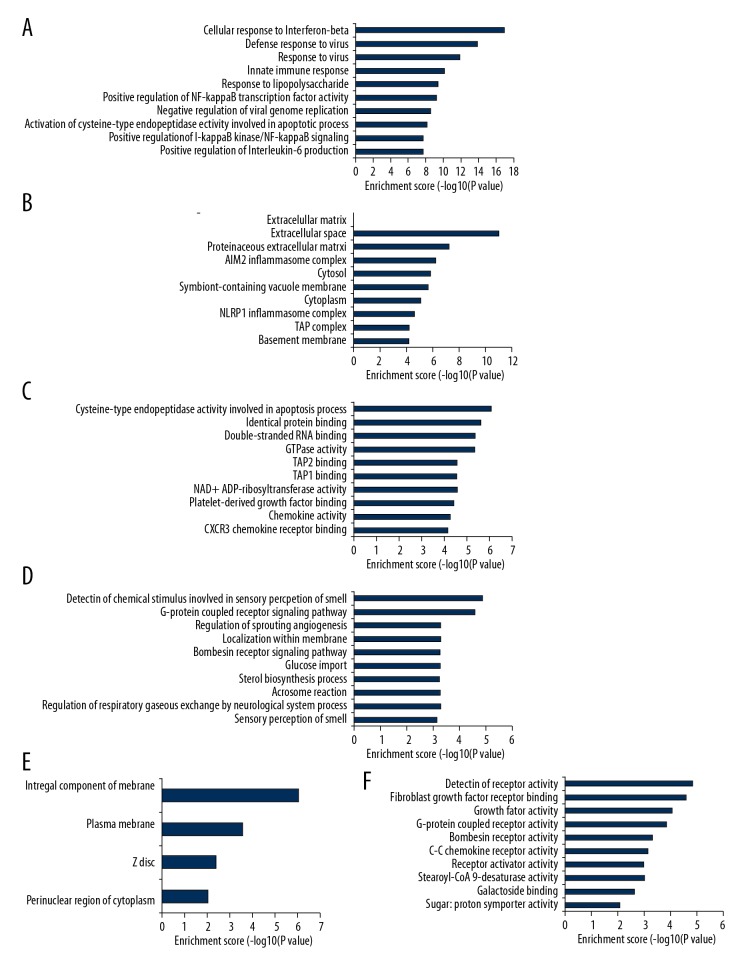
GO and KEGG enrichment analysis of deregulated genes between the CSCI group and the CON group was completed to explore the molecular mechanism of CSCI. GO terms included biological process (BP), cellular component (CC), and molecular function (MF). The top 10 most significantly enriched BP, CC, and MF of up-regulated genes are shown in Figure 3A–3C, respectively. The top 10 most enriched BP, CC, and MF of down-regulated genes are displayed in Figure 3D–3F, respectively. Analogously, the top 10 most significant pathways for up-regulated and down-regulated genes are shown in Figure 4.
Figure 3.
Biological functions of DE mRNAs. The significant biological process (A), cellular component (B), and molecular function (C) of up-regulated mRNAs. The significant biological process (D), cellular component (E), and molecular function (F) of down-regulated mRNAs.
Figure 4.
KEGG pathway analysis for up-regulated and down-regulated mRNAs. (A) The significant pathway for up-regulated genes. (B) The significant pathway for down-regulated genes.
lncRNA6032-centered lncRNA-mRNA co-expression network
Our previous studies identified several lncRNAs and mRNAs are related to inflammation in CSCI. Therefore, a lncRNA-mRNA co-expression network and a ceRNA network were constructed to investigate potential lncRNAs contributing to inflammation in CSCI rats. By calculating the correlation coefficient value of 519 DE lncRNAs and 562 DE mRNAs, we confirmed that 787 lncRNA-mRNA pairs and 740 lncRNA-mRNA pairs were positively co-expressed and negatively co-expressed, respectively. Based on the 2 distinct co-expression patterns of lncRNA-mRNA associated with inflammation after CSCI, a corresponding lncRNA6032-centered lncRNA-mRNA co-expression network was then constructed (Figure 5).
Figure 5.
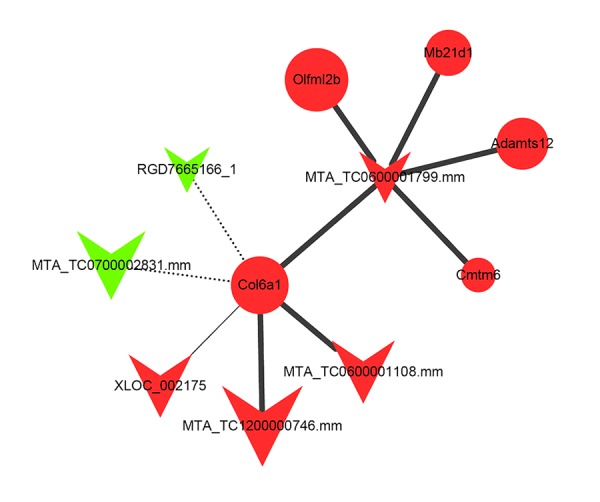
lncRNA6032-centered lncRNA-mRNA co-expression network. The triangle node and the round node represent lncRNA and mRNA, respectively. The red color shows that the lncRNA or mRNA is significantly up-regulated in the CSCI group compared to the CON group, otherwise indicated as down-regulated with a green color. The positive and negative correlations between lncRNAs and mRNAs are indicated as solid and dashed lines, respectively. The size of the lines represents the significance of the correlations, and the number of single genes that regulate other genes represents the size of the node.
qRT-PCR validation
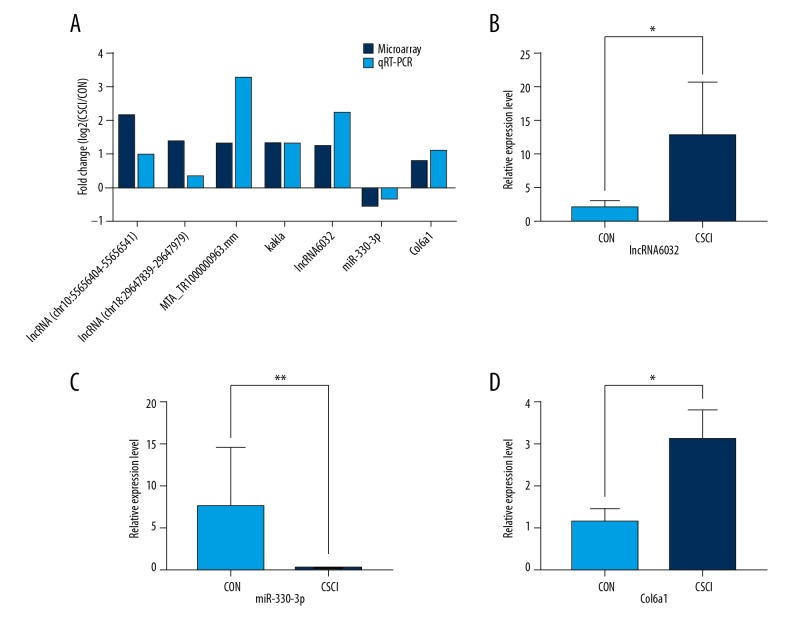
To validate the reliability of the microarray results, 5 highly expressed DE lncRNAs were selected and validated by qRT-PCR. Col6a1 and miR-330-3p were also chosen to be tested. As shown in Figure 6, qRT-PCR data were in good accordance with the microarray results, further supporting the dependability of the microarray results. Furthermore, compared to the CON group, it was significantly discriminate that the expressions of lncRNA6032 and Col6a1 were considerably higher in the CSCI group while the level of miR-330-3p expression was markedly lower.
Figure 6.
Validation of microarray date by qRT-PCR analysis. (A) The 5 highly expressed DE lncRNAs, Col6a1, and miR-330-3p in CSCI in comparison with control by microarray were confirmed by qRT-PCR. The relative expression levels of lncRNA6032 (B), miR-330-3p (C), and Col6a1 (D) in the CSCI group and the CON group by qRT-PCR. Each sample was assessed in 3 technical replicates. The height of each box represents the mean average of sample-specific 2−ΔΔCT values, while associated error bars denote the SEM. * P<0.05, ** P<0.01.
A potential competitive endogenous RNA pathway
Macrophages, which are critical for the inflammatory response, can promote peripheral nerve regeneration and collagen VI generation [23]. Collagen VI, which is essential for nerve myelination, is critical for the migration and polarization of macrophages during peripheral nerve regeneration [24]. In the central nervous system, Collagen VI was also reported to play a neuroprotective role [25,26]. Furthermore, Col6a1, which is expressed by Schwann cells and is an encoding gene for collagen VI, is related to inflammation [27]. According to several databases mentioned above, miR-330-3p is the common target miRNA of lncRNA6032 and Col6a. Generally speaking, we predicted that the suppression of miR-330-3p to Col6a1 can be reduced by lncRNA6032.
Discussion
The pathomechanisms responsible for the high morbidity and disability associated with CSCI are still unknown. lncRNAs, which were initially deemed transcriptional noise [28], were first reported in mice during the extensive sequencing of full-length cDNA libraries [29]. With the development of transcriptomics, it has nevertheless become obvious that lncRNAs regulate gene expression and molecular networks.
Remarkably, 4000–20 000 lncRNA are specifically expressed in the brain [30]. Increasing emerging evidence indicates that lncRNAs exert critical roles in the development of neurological diseases. Therefore, the modulation of lncRNAs may be developed into innovative therapeutic strategies for CSCI. Despite the continuing scientific focus on lncRNAs, very few researchers have concentrated on changes in lncRNAs after CSCI. In our study, a derivation group of 6 rats (the CSCI group and the CON group, n=3 each) was utilized to obtain DE profiles of lncRNAs and mRNAs by using microarray analysis. Then, DE lncRNAs and mRNAs were used for GO and KEGG enrichment analysis and differential co-expression analysis. Furthermore, a ceRNA network was constructed according to bioinformatics. A validation group of 26 rats (the CSCI group and the CON group, n=13) was used to confirm microarray data as well as members of the ceRNA network through qRT-PCR. The design of this experiment supported the robustness of our findings.
The emerging evidence for the function of most lncRNAs was not available to fully understand the regulatory mechanism of CSCI. Consistent with this, the roles of DE lncRNAs identified in the current study were almost unknown. We first used the combination of “GO and KEGG enrichment analysis” with “differential co-expression analysis” [31] as our strategy to research deeper into the biological functions of DE lncRNAs in CSCI. Second, we described 2 different co-expression patterns related to CSCI – positive and negative co-expression networks – which suggested distinct underlying regulation mechanisms. Finally, mRNA Col6a1 associated with inflammation was found to be co-expressed with lncRNA6032. In addition, bioinformatics analysis indicated that miR-330-3p was the target miRNA of both lncRNA6032 and Col6a1. Hence, we speculated that the miR-330-3p-lncRNA6032-Col6a1 interaction may play a critical role in CSCI. Finally, our search of the lncLocator database revealed that lncRNA6032 was located in the cytoplasm.
Increasing reports have proved that lncRNAs can function as ceRNAs [32] or as molecular sponges [33,34] to regulate the function of miRNAs. Our study is the first time to show that lncRNA6032, as a ceRNA, modulates the expression of Col6a1 through competition for miR-330-3p. Based on our findings, significant insights were provided into CSCI pathogenesis, and new treatment strategies could be developed to alleviate it. However, the precise role of these DE lncRNAs in the pathogenesis of CSCI needs to be clarified in our future work. The sample size for the microarray was small, which was a limitation of this study. Research with larger sample sizes and further experiments need to be conducted to confirm this conclusion.
Conclusions
Our results showed that the abundance of DE lncRNAs may be associated with the risk of CSCI outcome and revealed a potential ceRNA pathway involved in CSCI. Further in vivo and in vitro experiments were needed to uncover the exact mechanism of this ceRNA pathway.
Footnotes
Conflict of interest
None.
Source of support: Departmental sources
References
- 1.Shinozaki M, Iwanami A, Fujiyoshi K, et al. Combined treatment with chondroitinase ABC and treadmill rehabilitation for chronic severe spinal cord injury in adult rats. Neurosci Res. 2016;113:37–47. doi: 10.1016/j.neures.2016.07.005. [DOI] [PubMed] [Google Scholar]
- 2.Feng Y, Zhu H, Liu Y, Shen C. Status of the treatment of spinal cord injury. Chinese Journal of Neurosurgical Disease Research. 2008;7(3):279–80. [in Chinese] [Google Scholar]
- 3.Chen Q, Smith GM, Shine HD. Immune activation is required for NT-3-induced axonal plasticity in chronic spinal cord injury. Exp Neurol. 2008;209(2):497–509. doi: 10.1016/j.expneurol.2007.11.025. [DOI] [PMC free article] [PubMed] [Google Scholar]
- 4.Torres-Espin A, Forero J, Fenrich KK, et al. Eliciting inflammation enables successful rehabilitative training in chronic spinal cord injury. Brain. 2018;141(7):1946–62. doi: 10.1093/brain/awy128. [DOI] [PMC free article] [PubMed] [Google Scholar]
- 5.Djebali S, Davis C, Merkel A, et al. Landscape of transcription in human cells. Nature. 2012;489(7414):101–8. doi: 10.1038/nature11233. [DOI] [PMC free article] [PubMed] [Google Scholar]
- 6.Birney E, Stamatoyannopoulos J, Dutta A, et al. Identification and analysis of functional elements in 1% of the human genome by the ENCODE pilot project. Nature. 2007;447(7146):799–816. doi: 10.1038/nature05874. [DOI] [PMC free article] [PubMed] [Google Scholar]
- 7.Harrow J, Frankish A, Gonzalez J, et al. GENCODE: The reference human genome annotation for The ENCODE Project. Genome Res. 2012;22(9):1760–74. doi: 10.1101/gr.135350.111. [DOI] [PMC free article] [PubMed] [Google Scholar]
- 8.Kapranov P, Cawley SE, Drenkow J, et al. Large-scale transcriptional activity in chromosomes 21 and 22. Science. 2002;296(5569):916–19. doi: 10.1126/science.1068597. [DOI] [PubMed] [Google Scholar]
- 9.Ding Y, Song Z, Liu J. Aberrant LncRNA expression profile in a contusion spinal cord injury mouse model. Biomed Res Int. 2016;2016(9):1–10. doi: 10.1155/2016/9249401. [DOI] [PMC free article] [PubMed] [Google Scholar]
- 10.Mercer TR, Dinger ME, Mattick JS. Long non-coding RNAs: Insights into functions. Nat Rev Genet. 2009;10(3):155–59. doi: 10.1038/nrg2521. [DOI] [PubMed] [Google Scholar]
- 11.Mercer TR, Dinger ME, Sunkin SM, et al. Specific expression of long noncoding RNAs in the mouse brain. Proc Natl Acad Sci USA. 2008;105(2):716–21. doi: 10.1073/pnas.0706729105. [DOI] [PMC free article] [PubMed] [Google Scholar]
- 12.Ponting CP, Oliver PL, Reik W. Evolution and functions of long noncoding RNAs. Cell. 2009;136(4):629–41. doi: 10.1016/j.cell.2009.02.006. [DOI] [PubMed] [Google Scholar]
- 13.Qureshi I, Mehler M. Emerging roles of non-coding RNAs in brain evolution, development, plasticity and disease. Nat Rev Neurosci. 2012;13(8):528–41. doi: 10.1038/nrn3234. [DOI] [PMC free article] [PubMed] [Google Scholar]
- 14.Houle JD, Tessler A. Repair of chronic spinal cord injury. Exp Neurol. 2003;182(2):247–60. doi: 10.1016/s0014-4886(03)00029-3. [DOI] [PubMed] [Google Scholar]
- 15.Nakano N, Nakai Y, Seo TB, et al. Effects of bone marrow stromal cell transplantation through CSF on the subacute and chronic spinal cord injury in rats. PLoS One. 2013;8(9):e73494. doi: 10.1371/journal.pone.0073494. [DOI] [PMC free article] [PubMed] [Google Scholar]
- 16.Yang Y, Thompson JF, Taheri S, et al. Early inhibition of MMP activity in ischemic rat brain promotes expression of tight junction proteins and angiogenesis during recovery. J Cereb Blood Flow Metab. 2013;33(7):1104–14. doi: 10.1038/jcbfm.2013.56. [DOI] [PMC free article] [PubMed] [Google Scholar]
- 17.Li B, Zheng Z, Wei Y, et al. Therapeutic effects of neuregulin-1 in diabetic cardiomyopathy rats. Cardiovascular Diabetology. 2011;10(1):1–8. doi: 10.1186/1475-2840-10-69. [DOI] [PMC free article] [PubMed] [Google Scholar]
- 18.Basso D, Beattie M, Bresnahan J. A sensitive and reliable locomotor rating scale for open field testing in rats. J Neurotrauma. 1995;12(1):1–21. doi: 10.1089/neu.1995.12.1. [DOI] [PubMed] [Google Scholar]
- 19.Livak K, Schmittgen T. Analysis of relative gene expression data using real-time quantitative PCR and the 2(−Delta Delta C(T)) method. Methods. 2001;25(4):402–8. doi: 10.1006/meth.2001.1262. [DOI] [PubMed] [Google Scholar]
- 20.Xu J, Long H, Chen W, et al. Ultrastructural features of neurovascular units in a rat model of chronic compressive spinal cord injury. Front Neuroanat. 2017;11:136. doi: 10.3389/fnana.2017.00136. [DOI] [PMC free article] [PubMed] [Google Scholar]
- 21.Hu Y, Wen CY, Li TH, et al. Somatosensory-evoked potentials as an indicator for the extent of ultrastructural damage of the spinal cord after chronic compressive injuries in a rat model. Clin Neurophysiol. 2011;122(7):1440–47. doi: 10.1016/j.clinph.2010.12.051. [DOI] [PubMed] [Google Scholar]
- 22.Kasahara K, Nakagawa T, Kubota T. Neuronal loss and expression of neurotrophic factors in a model of rat chronic compressive spinal cord injury. Spine. 2006;31(18):2059–66. doi: 10.1097/01.brs.0000231893.21964.f2. [DOI] [PubMed] [Google Scholar]
- 23.Horie H, Kadoya T, Hikawa N, et al. Oxidized galectin-1 stimulates macrophages to promote axonal regeneration in peripheral nerves after axotomy. J Neurosci. 2004;24(8):1873–80. doi: 10.1523/JNEUROSCI.4483-03.2004. [DOI] [PMC free article] [PubMed] [Google Scholar]
- 24.Chen P, Cescon M, Zuccolotto G, et al. Collagen VI regulates peripheral nerve regeneration by modulating macrophage recruitment and polarization. Acta Neuropathol. 2015;129(1):97–113. doi: 10.1007/s00401-014-1369-9. [DOI] [PubMed] [Google Scholar]
- 25.Cheng IH, Lin YC, Hwang E, et al. Collagen VI protects against neuronal apoptosis elicited by ultraviolet irradiation via an Akt/phosphatidylinositol 3-kinase signaling pathway. Neuroscience. 2011;183:178–88. doi: 10.1016/j.neuroscience.2011.03.057. [DOI] [PubMed] [Google Scholar]
- 26.Cheng JS, Dubal DB, Kim DH, et al. Collagen VI protects neurons against Abeta toxicity. Nat Neurosci. 2009;12(2):119–21. doi: 10.1038/nn.2240. [DOI] [PMC free article] [PubMed] [Google Scholar]
- 27.Vitale P, Braghetta P, Volpin D, et al. Mechanisms of transcriptional activation of the col6a1 gene during Schwann cell differentiation. Mech Dev. 2001;102(1–2):145–56. doi: 10.1016/s0925-4773(01)00303-3. [DOI] [PubMed] [Google Scholar]
- 28.Struhl K. Transcriptional noise and the fidelity of initiation by RNA polymerase II. Nat Struct Mol Biol. 2007;14(2):103–5. doi: 10.1038/nsmb0207-103. [DOI] [PubMed] [Google Scholar]
- 29.Okazaki Y, Furuno M, Kasukawa T, Okazaki Y, et al. Analysis of the mouse transcriptome based on functional annotation of 60,770 full-length cDNAs. Nature. 2003;420:563–73. doi: 10.1038/nature01266. [DOI] [PubMed] [Google Scholar]
- 30.Derrien T, Johnson R, Bussotti G, et al. The GENCODE v7 catalog of human long noncoding RNAs: Analysis of their gene structure, evolution, and expression. Genome Res. 2012;22(9):1775–89. doi: 10.1101/gr.132159.111. [DOI] [PMC free article] [PubMed] [Google Scholar]
- 31.Liao Q, Liu CN, Yuan XY, et al. Large-scale prediction of long non-coding RNA functions in a coding-non-coding gene co-expression network. Nucleic Acids Res. 2011;39(9):3864–78. doi: 10.1093/nar/gkq1348. [DOI] [PMC free article] [PubMed] [Google Scholar]
- 32.John-Aryankalayil M, Palayoor ST, Makinde AY, et al. Fractionated radiation alters oncomir and tumor suppressor miRNAs in human prostate cancer cells. Radiat Res. 2012;178(3):105–17. doi: 10.1667/rr2703.1. [DOI] [PMC free article] [PubMed] [Google Scholar]
- 33.Fejes-Toth K, Sotirova V, Sachidanandam R, et al. Post-transcriptional processing generates a diversity of 5′-modified long and short RNAs. Nature. 2009;457(7232):1028–32. doi: 10.1038/nature07759. [DOI] [PMC free article] [PubMed] [Google Scholar]
- 34.Karreth FA, Pandolfi PP. ceRNA cross-talk in cancer: When ce-bling rivalries go awry. Cancer Discov. 2013;3(10):1113–21. doi: 10.1158/2159-8290.CD-13-0202. [DOI] [PMC free article] [PubMed] [Google Scholar]


