 A robust chip-based SERS concept for quantitative on-demand metabolite screening is established.
Abstract
Reliable and user-friendly sensing of target analytes in complex biofluids is of fundamental importance to biological science and medicine. Surface-enhanced Raman spectroscopy (SERS) has proven to be capable of detecting molecules with high sensitivity, but achieving robust quantitative detection remains a challenge mainly because of the severe signal fluctuation at electromagnetic hot spots. Here, we describe an on-demand and quantitative SERS strategy for metabolite profiling based on a chip-based sensing device that adopts stable and surface-tethered small-molecule probes as Raman reporters. These probes with a ratiometric response allow for sensitive and reproducible SERS detection by offering an internal calibration to correct the signal fluctuation caused by the spatiotemporal variation of assay conditions. Meanwhile, the chip-based sensing scheme makes time-separated on-demand detection possible. Ultimately, due to the flexibility in choosing diverse ratiometric Raman probes, we expect the proposed quantitative SERS sensing concept to be useful for studies in the fields of cell biology and clinical diagnosis.
Introduction
Reliable and quantitative sensing of chemicals and biological species is important in a wide range of scientific fields from analytical chemistry and molecular diagnostics to the inspection of cell functions and activities.1–3 Among diverse advanced techniques, surface-enhanced Raman spectroscopy (SERS) can yield vibrational spectra of molecules with ultrahigh sensitivity down to the single-molecule level.4–9 As such, SERS has been considered a promising analytical tool for label-free molecular diagnostics.10,11 However, there still remains a grand challenge to employ SERS as a reliable quantitative technique. This is mainly caused by the heterogeneous distribution of the highly localized plasmonically active regions (hot spots) on a SERS substrate. Only the molecules placed within (or very close to) the hot spots can be really accounted for. For this reason, while the potential of SERS in chemical and biological sensing applications has been widely recognized and accepted, studies focusing on reliable quantitative SERS analysis have been rarely demonstrated.12–15
One of the strategies for achieving quantitative SERS detection is to control and manipulate enhancing units uniformly arranged on a substrate surface using different nanofabrication techniques.16 Among them, the self-assembly of nanoparticles (NPs) into close-packed superlattices directed by organic ligand-mediated surface chemistry is the most successful technique.17 However, some accompanying problems may limit its scope of application: (1) the structural dispersion of enhancing units (e.g., varied size and shape) is unavoidable, which compromises the uniformity of the SERS substrate; (2) the ligands occupy the surface sites of NPs, preventing the access of target molecules.
The ratiometric method offers an alternative way to resolve the issue of signal fluctuation. Over the past years, many ratiometric fluorescence and electrochemical assays have been developed that enabled signal rationing and provided built-in correction for the fluctuation of samples and measuring environments.18–20 Although a few ratiometric SERS detection methods were also proposed recently, most of them involved the aggregation of metal colloids to form the hot spots.21–23 Such aggregation based detection methods have to face difficulties to get a reproducible SERS response for quantitative assessment because of many uncontrollable factors, including the difference in aggregation degree, the inherent heterogeneity in particle structure, the random adsorption and orientation of the SERS reporter molecules on the metal surfaces, and so forth. Additionally, the thermodynamic instability of the aggregated colloidal NPs adds further complications by requiring the test results to be read within a specified time interval to guarantee their validity. To conquer these challenges, a ratiometric, on-demand testing scheme that not only establishes reliability and accuracy in quantitative SERS detection, but also allows signal readout at any point in time to improve the stability of the detected signals is highly desirable.
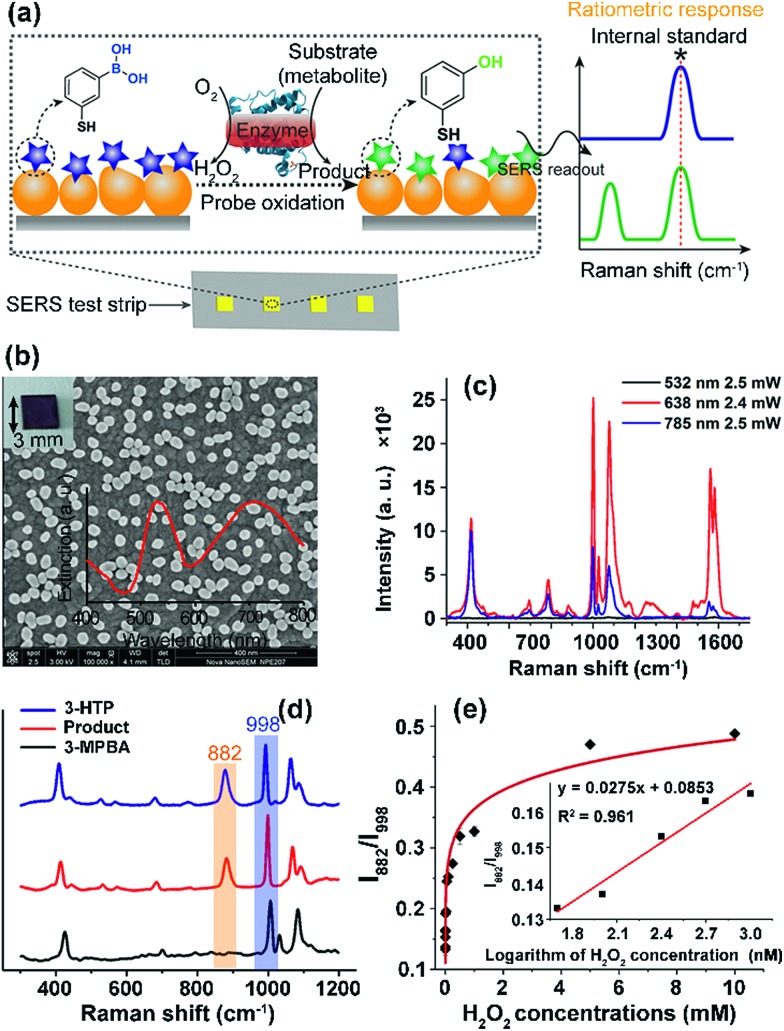
Here, we developed a new chip-based SERS sensing platform that employs ratiometric Raman probes immobilized on a gold NP (GNP) layered surface to enable reliable and on-demand target quantification. As an initial demonstration, we chose lactate, glucose and cholesterol, a series of indispensable molecules at the center of cellular metabolism, as the target biomolecules to demonstrate the feasibility of our design.24–26 A H2O2-responsive Raman probe, 3-mercaptophenylboronic acid (3-MPBA), was used to report the presence of metabolites by combining with an oxidase that catalyzes the corresponding substrate (metabolite) to yield H2O2 (Fig. 1a).27 The stable small-molecule probe with a built-in internal standard peak makes it possible to eliminate the environmental influence during analysis and to suspend, store and recover the detection of metabolites after enzyme reaction and probe recognition, thereby allowing quantitative signal readout and analysis at a later time.
Fig. 1. Quantitative SERS detection of metabolites on a non-uniform plasmonic chip using a ratiometric Raman probe. (a) Schematic illustration of the detection principle: metabolite molecules are catalysed by the corresponding oxidase to generate H2O2 which specifically oxidizes the probe 3-MPBA to 3-HTP, yielding a ratiometric SERS response. (b) Field-emission scanning electron microscopy (FESEM) image of a SERS chip (insets: transmission photograph of a SERS chip and the extinction spectrum). (c) SERS spectra of 3-MPBA adsorbed on a gold chip collected at different wavelengths. (d) SERS spectra of gold chips modified with 3-HTP (blue curve) and 3-MPBA before (black curve) and after (red curve) reaction with H2O2. (e) SERS intensity ratio (I882/I998) of the probe 3-MPBA as a function of H2O2 concentration (inset: linear response obtained for H2O2 concentrations between 50 and 250 nM). Error bars represent the standard error of the mean of triplicate measurements.
Results and discussion
To enable on-chip analysis, we assembled two-dimensional (2D) arrays of GNPs on an indium tin oxide-coated glass slide via the aminosilane-assisted adsorption route (Fig. 1b and S1–S6†). This type of SERS substrate is easy to prepare and inexpensive, and offers a high enhancement factor of 2.4 × 10⁷ under excitation with a 638 nm laser due to the collective plasmon resonance of the assembled GNPs, and thus is potentially useful for bioanalysis (Fig. 1b, c, S7 and S8†). However, due to the irregular distribution of metal NPs in combination with the small size (∼1.5 μm in diameter for this study) of the focused laser spot of a commonly used Raman spectrometer, obtaining reproducible SERS spectra from such a chip surface is hard. To test if quantitative SERS detection can be achieved on this non-uniform surface by the ratiometric method, we initially added different concentrations of H2O2 onto the 3-MPBA modified plasmonic chips to oxidize the boronate probe into 3-hydroxythiophenol (3-HTP) which was accompanied by the appearance of a new peak at 882 cm–1 corresponding to benzene ring stretching in the SERS spectrum (Fig. 1d and S9†).28 Although the intensity (I882) of this band showed irregular variation, thus making it incapable of quantifying the concentration of H2O2, we found that the ratio between I882 and the intensity (I998) of the 998 cm–1 band, an internal standard band that is assigned to the C–C in-plane bending,27 which was undisturbed in the presence of H2O2, was consistently enhanced with an increase in the concentration of H2O2 over a wide dynamic range of six orders of magnitude. The SERS ratio (I882/I998) increased linearly with the logarithm of H2O2 concentration, leading to a detectable range from 50 to 1000 nM with a correlation coefficient (R) of 0.98 (Fig. 1e, S10 and S11†).
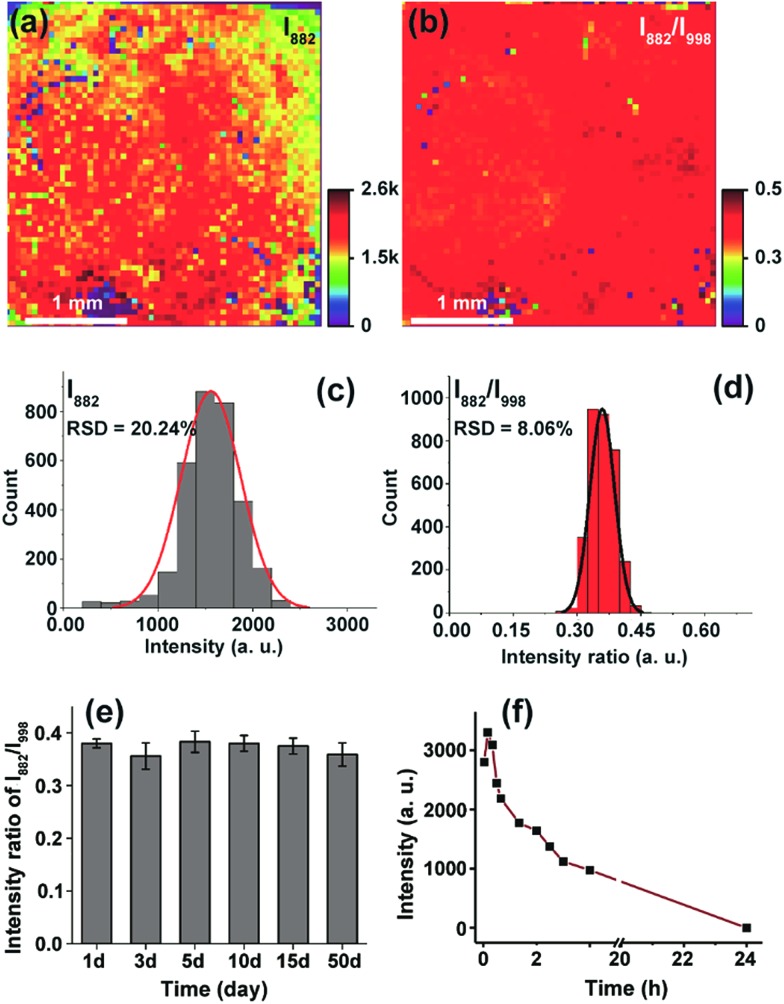
To further demonstrate the capability of the ratiometric sensing method for largely improving spectral uniformity on the assembled gold chip, we treated a 3-MPBA modified SERS chip (3 × 3 mm2) with 5 mM H2O2 and mapped the chip surface with the intensity of the peak at 882 cm–1. As expected, strong fluctuations of SERS intensities with a relative standard deviation (RSD) of >20% were observed (Fig. 2a and c). The same chip was then imaged with the intensity ratio of bands at 882 cm–1 and 998 cm–1. As depicted in Fig. 2b and d, every imaging pixel in the Raman map exhibited a uniform relative peak intensity with a 2.5-fold decrease in the variation coefficient. We next largely reduced the sampling numbers on the chip where fourteen spots, a sampling level adopted in common SERS bioassays, were measured via the above two detection modes. In contrast to the more irreproducible SERS spectra offered by the absolute intensity measurement (RSD of >35 for both I998 and I882), the intensity ratios of the two peaks remained unchanged, showing a RSD of 7.8% (Fig. S12†). Analogously, using the ratio of I882/I998 as a readout also led to improved inter-assay reproducibility, as evidenced by an obvious decrease in the variation coefficient from 14.1% to 5.6% (Fig. S13†).
Fig. 2. Reproducibility and stability characterization of the chip-based ratiometric SERS method. (a) SERS mapping over a large area (3 × 3 mm2) obtained with the Raman intensity at 882 cm–1. (b) SERS image of the same chip acquired by scanning with the ratio of I882/I998. (c and d) Standard deviation was improved from 20.24% to 8.06%. (e) Relative intensity of the SERS chip after different storage times. (f) SERS intensity at 882 cm–1 determined from gold colloids aggregated by potassium chloride.
After validating the feasibility of reproducible SERS analysis on the disordered GNP chips, we then wondered if this chip-based ratiometric methodology could provide a robust and stable test result. The probe 3-MPBA functionalized chip was stored after incubation with H2O2. SERS spectra of the probe molecules were analyzed after the specified duration (1–50 days). As can be seen in Fig. 2e, the ratio value of the 882 cm–1 band intensity to that of the 998 cm–1 peak was almost unchanged (RSD of 3.2%). This result indicated that the assay system was tolerant to long storage times, which was attributed to two factors: first, the good stability of 3-MPBA and its oxidation product 3-HTP under the storage conditions (in sealed brown bottles at 4 °C) (Fig. S14 and S15†), and more importantly, the static nature of hot spots due to GNP immobilization. For comparison, we incubated the 3-MPBA modified gold colloids with H2O2 followed by the addition of potassium chloride to aggregate the metal particles. The colloids were then subjected to SERS detection at different time intervals. As shown in Fig. 2f, the peak intensity at 882 cm–1 decreased to 30% of the maximum value after the aggregated colloids were stored for just 2 h, and dropped to zero after 24 h of storage, indicating that the aggregated colloids were kinetically unstable and gradually lost their Raman enhancing property during storage. Overall, the above results demonstrated that, by using the chip-based ratiometric detection strategy, the assay could be suspended and restored after a long “waiting” time.
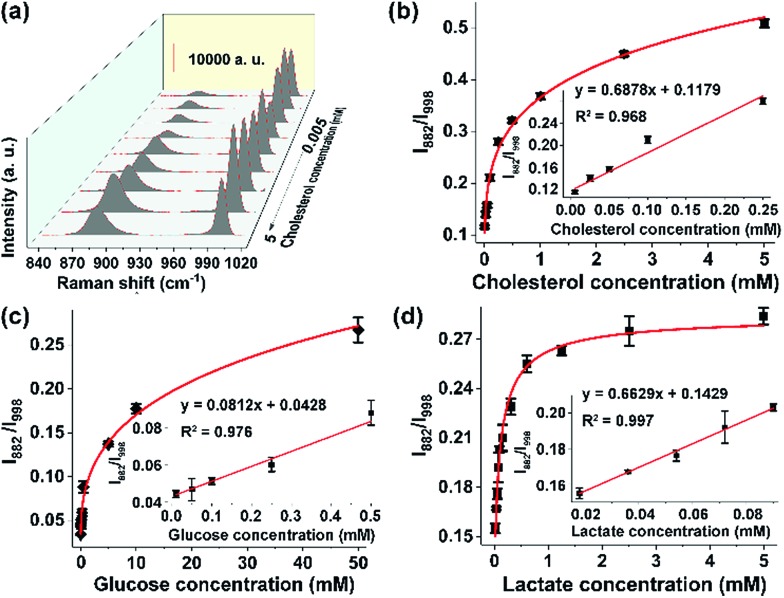
Given the sensitive response of the probe 3-MPBA toward H2O2, we envisaged that the proposed SERS method could be used to detect any substrate of oxidases or reductases, including various metabolites in the human body, as long as the enzymatic reaction yields H2O2. Here as the proof-of-concept study, we analyzed three kinds of metabolites, namely cholesterol (reference value in blood: 3.1–6.0 mM), glucose (3.89–6.11 mM) and lactate (0.5–1.7 mM).29,30 The abnormal metabolism of these species is closely associated with many disorders including cancer.31 For instance, it was reported that the cholesterol metabolic pathway was up-regulated in pancreatic adenocarcinoma.32 The quantitative analysis of these metabolites in biological samples is thereby important in the fields of basic biomedical research and clinical diagnosis and treatment. For the detection of cholesterol, cholesterol oxidase was added into the sample solution. The results, summarized in Fig. 3a, showed that the band intensity at 882 cm–1 fluctuated at different cholesterol concentrations, leading to a failure in establishing a reliable working curve. By contrast, the ratio values of I882/I998 increased along with the increment of cholesterol concentrations from 5 μM to 5 mM. Moreover, a good linear response (R2 = 0.992) was obtained in the concentration range of 5 μM to 100 μM (Fig. 3b). Similarly, in the presence of glucose oxidase or lactate oxidase, our ratiometric SERS chips could sensitively and selectively detect glucose with a linear range from 10 μM to 500 μM (Fig. 3c and S16†), and detect lactate with a linear range from 18 μM to 72 μM (Fig. 3d). It is worth mentioning that the above sensing performance was obtained without optimization of the experimental conditions such as the reaction time and the enzyme amount. Nevertheless, these results indicated that, when combining oxidoreductases with the surface-tethered Raman probe 3-MPBA, our on-chip ratiometric SERS method was sensitive enough to quantitatively detect a large variety of metabolites.
Fig. 3. Chip-based ratiometric SERS analysis of metabolites. (a) Cholesterol concentration-dependent SERS spectra. (b) Plot of relative Raman intensity (I882/I998) as a function of cholesterol concentration from 5 μM to 5 mM. The inset shows the linear response for cholesterol (5 μM to 100 μM). Plots of relative Raman intensity (I882/I998) as a function of (c) glucose and (d) lactate concentration. The insets show the linear curves for (c) glucose (10 μM to 500 μM) and (d) lactate (18 μM to 72 μM).
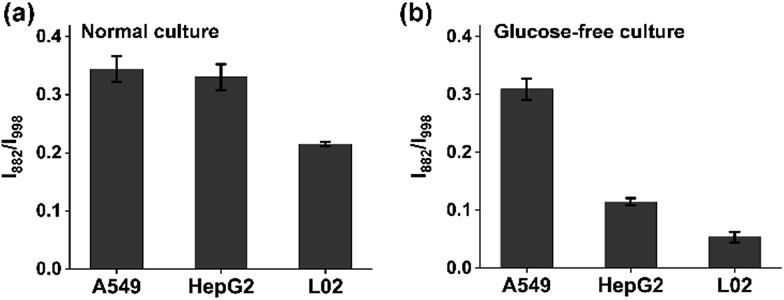
A hallmark of cancer-cell metabolism is the deregulated uptake of nutrients such as glucose and glutamine, leading to massive secretion of lactate in the extracellular environment.33 The reliable quantification of lactate in cell cultures is highly essential for the study of the energy metabolism of cancer cells. For advanced detection methods such as mass spectrometry, careful sample pretreatment is needed for accurate determination, which prolongs the assay time. Here, we applied the chip-based ratiometric SERS platform, without sample purification, for the rapid detection of lactate excreted by three cell lines (the adenocarcinomic human alveolar basal epithelial cell line A549, the hepatocellular carcinoma cell line HepG2, and the normal live cell line L02) under two different culture conditions: glucose (+)-glutamine (–) and glucose (–)-glutamine (+) cultures. As expected, the cancer cells exhibited significantly enhanced lactate efflux in comparison with the normal liver L02 cells in both situations, which was fully consistent with literature reports (Fig. 4a and b).34 The results indicated that: (1) cancer cells possess a higher metabolic rate than non-proliferative normal cells; (2) in the presence of sufficient glucose, cancer cells consume glucose as an energy and biosynthetic material to promote their proliferation, accompanied by the release of lactate; (3) to deal with glucose depletion, cancer cells undergo metabolic reprogramming by taking up other nutrients such as glutamine as the essential fuel.
Fig. 4. Extracellular lactate detection via the ratiometric SERS method. Relative SERS intensity (I882/I998) showing the efflux of lactate by A549, HepG2 and L02 cells cultured in (a) glucose (+)-glutamine (–) and (b) glucose (–)-glutamine (+) media.
Conclusions
In summary, we have demonstrated a facile chip-based quantitative SERS approach. Tethering ratiometric Raman reporters onto the enhancing substrate surface corrected the signal fluctuation arising from the random distribution of hot spots since the reporter itself played the role of an internal standard. The small molecule-based Raman probe combined with the chip-based assay scheme improved the signal stability, enabling on-demand quantitative analysis. Although the current work focused on the diagnosis of metabolites, we believe that the proposed detection principle could be extended to the analysis of many other targets such as pH values and hypochlorous acid due to the flexibility in choosing Raman probes (Fig. S17 and S18†). Future improvements to the method described here will be needed to widen the application scope of the available probes and to screen new ratiometric reporters with a high reaction specificity.
Conflicts of interest
There are no conflicts to declare.
Supplementary Material
Acknowledgments
We are grateful for the financial support from the National Science Foundation of China (21605025, 21175028, and 21375022).
Footnotes
†Electronic supplementary information (ESI) available. See DOI: 10.1039/c8sc03263g
References
- Arya S. K., Bhansali S. Chem. Rev. 2011;111:6783–6809. doi: 10.1021/cr100420s. [DOI] [PubMed] [Google Scholar]
- Liu Y., Zhou J., Wang L., Hu X., Liu X., Liu M., Cao Z., Shangguan D., Tan W. J. Am. Chem. Soc. 2016;138:12368–12374. doi: 10.1021/jacs.6b04048. [DOI] [PubMed] [Google Scholar]
- Chen W. W., Freinkman E., Wang T., Birsoy K., Sabatini D. M. Cell. 2016;166:1324–1337. doi: 10.1016/j.cell.2016.07.040. [DOI] [PMC free article] [PubMed] [Google Scholar]
- Chikkaraddy R., de Nijs B., Benz F., Barrow S. J., Scherman O. A., Rosta E., Demetriadou A., Fox P., Hess O., Baumberg J. J. Nature. 2016;535:127–130. doi: 10.1038/nature17974. [DOI] [PMC free article] [PubMed] [Google Scholar]
- Li J. F., Huang Y. F., Ding Y., Yang Z. L., Li S. B., Zhou X. S., Fan F. R., Zhang W., Zhou Z. Y., Wu D. Y., Ren B., Wang Z. L., Tian Z. Q. Nature. 2010;464:392–395. doi: 10.1038/nature08907. [DOI] [PubMed] [Google Scholar]
- Le Ru E. C., Etchegoin P. G. Annu. Rev. Phys. Chem. 2012;63:65–87. doi: 10.1146/annurev-physchem-032511-143757. [DOI] [PubMed] [Google Scholar]
- Zrimsek A. B., Chiang N., Mattei M., Zaleski S., McAnally M. O., Chapman C. T., Henry A.-I., Schatz G. C., Van Duyne R. P. Chem. Rev. 2017;117:7583–7613. doi: 10.1021/acs.chemrev.6b00552. [DOI] [PubMed] [Google Scholar]
- Schlücker S. Angew. Chem., Int. Ed. 2014;53:4756–4795. doi: 10.1002/anie.201205748. [DOI] [PubMed] [Google Scholar]
- Laing S., Jamieson L. E., Faulds K., Graham D. Nat. Rev. Chem. 2017;1:1–19. [Google Scholar]
- Pallaoro A., Hoonejani M. R., Braun G. B., Meinhart C. D., Moskovits M. ACS Nano. 2015;9:4328–4336. doi: 10.1021/acsnano.5b00750. [DOI] [PubMed] [Google Scholar]
- Cialla-May D., Zheng X.-S., Weberabc K., Popp J. Chem. Soc. Rev. 2017;46:3945–3961. doi: 10.1039/c7cs00172j. [DOI] [PubMed] [Google Scholar]
- Sackmann M., Materny A. J. Raman Spectrosc. 2006;37:305–310. [Google Scholar]
- Chuong T. T., Pallaoro A., Chaves C. A., Li Z., Lee J., Eisensteine M., Stucky G. D., Moskovitsa M., Sohe H. T. Proc. Natl. Acad. Sci. U. S. A. 2017;114:9056–9061. doi: 10.1073/pnas.1700317114. [DOI] [PMC free article] [PubMed] [Google Scholar]
- Zong C., Xu M., Xu L.-J., Wei T., Ma X., Zheng X.-S., Hu R., Ren B. Chem. Rev. 2018;118:4946–4980. doi: 10.1021/acs.chemrev.7b00668. [DOI] [PubMed] [Google Scholar]
- Goodacre R., Graham D., Faulds K. TrAC, Trends Anal. Chem. 2018;102:359–368. [Google Scholar]
- Kleinman S. L., Frontiera R. R., Henry A.-I., Dieringer J. A., Van Duyne R. P. Phys. Chem. Chem. Phys. 2013;15:21–36. doi: 10.1039/c2cp42598j. [DOI] [PubMed] [Google Scholar]
- Chen H.-Y., Lin M.-H., Wang C.-Y., Chang Y.-M., Gwo S. J. Am. Chem. Soc. 2015;137:13698–13705. doi: 10.1021/jacs.5b09111. [DOI] [PubMed] [Google Scholar]
- Lee M. H., Kim J. S., Sessler J. L. Chem. Soc. Rev. 2015;44:4185–4191. doi: 10.1039/c4cs00280f. [DOI] [PMC free article] [PubMed] [Google Scholar]
- Wu P., Hou X., Xu J.-J., Chen H.-Y. Nanoscale. 2016;8:8427–8442. doi: 10.1039/c6nr01912a. [DOI] [PubMed] [Google Scholar]
- Luo Y., Zhang L., Liu W., Yu Y., Tian Y. Angew. Chem., Int. Ed. 2015;54:14053–14056. doi: 10.1002/anie.201508635. [DOI] [PubMed] [Google Scholar]
- Shen W., Lin X., Jiang C., Li C., Lin H., Huang J., Wang S., Liu G., Yan X., Zhong Q., Ren B. Angew. Chem., Int. Ed. 2015;54:7308–7312. doi: 10.1002/anie.201502171. [DOI] [PubMed] [Google Scholar]
- Peng R., Si Y., Deng T., Zheng J., Li J., Yang R., Tan W. Chem. Commun. 2016;52:8553–8556. doi: 10.1039/c6cc03412h. [DOI] [PubMed] [Google Scholar]
- Wu Y., Xiao F., Wu Z., Yu R. Anal. Chem. 2017;89:2852–2858. doi: 10.1021/acs.analchem.6b04010. [DOI] [PubMed] [Google Scholar]
- Chen Y. J., Mahieu N. G., Huang X., Singh M., Crawford P. A., Johnson S. L., Gross R. W., Schaefer J., Patti G. J. Nat. Chem. Biol. 2016;12:937–943. doi: 10.1038/nchembio.2172. [DOI] [PMC free article] [PubMed] [Google Scholar]
- Denko N. C. Nat. Rev. Cancer. 2008;8:705–713. doi: 10.1038/nrc2468. [DOI] [PubMed] [Google Scholar]
- Chang T. Y., Chang C. C., Ohgami N., Yamauchi Y. Annu. Rev. Cell Dev. Biol. 2006;22:129–157. doi: 10.1146/annurev.cellbio.22.010305.104656. [DOI] [PubMed] [Google Scholar]
- Gu X., Wang H., Schultz Z. D., Camden J. P. Anal. Chem. 2016;88:7191–7197. doi: 10.1021/acs.analchem.6b01378. [DOI] [PMC free article] [PubMed] [Google Scholar]
- Lee H. M., Kim M. S., Kim K. Vib. Spectrosc. 1994;6:205–214. [Google Scholar]
- Chen Z., Mao L., Yu C., Blake J. R., Zheng D. Sci. Rep. 2014;4:6685. doi: 10.1038/srep06685. [DOI] [PMC free article] [PubMed] [Google Scholar]
- van Noord D., Mensink P. B. F., de Knegt R. J., Ouwendijk M., Francke J., van Vuuren A. J., Hansen B. E., Kuipers E. J. Dig. Dis. Sci. 2011;56:506–512. doi: 10.1007/s10620-010-1303-5. [DOI] [PMC free article] [PubMed] [Google Scholar]
- DeBerardinis R. J., Lum J. J., Hatzivassiliou G., Thompson C. B. Cell Metab. 2008;7:11–20. doi: 10.1016/j.cmet.2007.10.002. [DOI] [PubMed] [Google Scholar]
- Guillaumond F., Bidaut G., Ouaissi M., Servais S., Gouirand V., Olivares O., Lac S., Borge L., Roques J., Gayet O., Pinault M., Guimaraes C., Nigri J., Loncle C., Lavaut M.-N., Garcia S., Tailleux A., Staels B., Calvo E., Tomasini R., Iovanna J. L., Vasseur S. Proc. Natl. Acad. Sci. U. S. A. 2015;112:2473–2478. doi: 10.1073/pnas.1421601112. [DOI] [PMC free article] [PubMed] [Google Scholar]
- Ward P. S., Thompson C. B. Cancer Cell. 2012;21:297–308. doi: 10.1016/j.ccr.2012.02.014. [DOI] [PMC free article] [PubMed] [Google Scholar]
- Vincent E. E., Sergushichev A., Griss T., Gingras M.-C., Samborska B., Ntimbane T., Coelho P. P., Blagih J., Raissi T. C., Choinière L., Bridon G., Loginicheva E., Flynn B. R., Thomas E. C., Tavaré J. M., Avizonis D., Pause A., Elder D. J. E., Jones R. G. Mol. Cell. 2015;60:195–207. doi: 10.1016/j.molcel.2015.08.013. [DOI] [PubMed] [Google Scholar]
Associated Data
This section collects any data citations, data availability statements, or supplementary materials included in this article.


