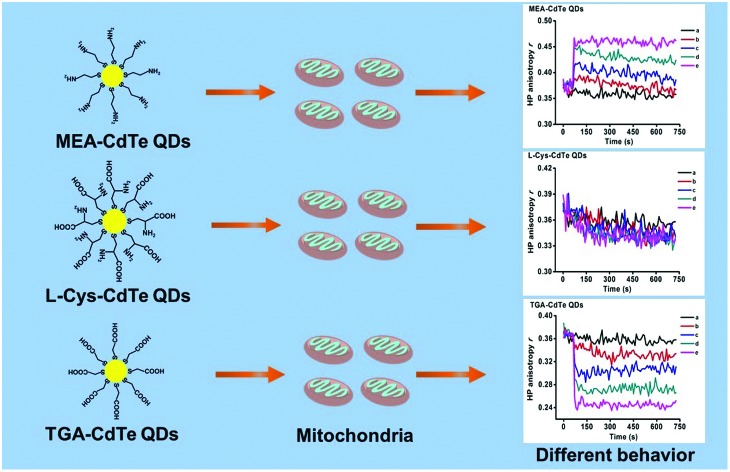
 CdTe QDs functionalized with different groups showed different effects on mitochondrial membrane fluidity.
Abstract
Quantum dots (QDs) are used in the bio-medical area because of their excellent optical properties. Their biomedical utilization has remained a serious biosecurity concern. Cytotoxicity experiments have shown that QD toxicity is connected to the properties of the QDs. In this paper, the toxicity of QDs was studied from the aspect of surface functional groups at the mitochondrial level. Three types of ligands, thioglycollic acid (TGA), mercaptoethylamine (MEA) and l-cysteine (l-Cys), which have similar structures but different functional groups were used to coat CdTe QDs. The effects of the three types of CdTe QDs on mitochondria were then observed. The experimental results showed the three types of CdTe QDs could impair mitochondrial respiration, destroy membrane potential and induce mitochondrial swelling. Interestingly, MEA-CdTe QDs showed similar effects on membrane potential and mitochondrial swelling as did l-Cys-CdTe QDs, while TGA-CdTe QDs showed stronger effects than that of the two other QDs. Moreover, the three types of CdTe QDs showed significantly different effects on mitochondrial membrane fluidity. MEA-CdTe QDs decreased mitochondrial membrane fluidity, l-Cys-CdTe QDs showed no obvious influence on mitochondrial membrane fluidity and TGA-CdTe QDs increased mitochondrial membrane fluidity. The interaction mechanism of CdTe QDs on mitochondrial permeability transition (MPT) pores as well as Cd2+ release by CdTe QDs were checked to determine the reason for their different effects on mitochondria. The results showed that the impact of the three types of CdTe QDs on mitochondria was not only related to the released metal ion, but also to their interaction with MPT pore proteins. This work emphasizes the importance of surface functional groups in the behavior of CdTe QDs at the sub-cellular level.
1. Introduction
Quantum dots (QDs) are also called semiconductor nanocrystals. They have many excellent optical properties such as broadband excitation, narrow bandwidth emission, high quantum yield and resistance to photobleaching, which make them the perfect bio-medical fluorescence probe.1,2 Their biomedical utilization has remained a serious biosecurity concern.3,4
Mitochondria are important organelles in eukaryocytes. They have many important physiological functions such as energy production, calcium homeostasis and apoptosis regulation.5–7 Many diseases are related to mitochondrial dysfunction.8–11 Some studies have shown that mitochondria were the potentially relevant target organelles for QDs toxicity.12–15
Cytotoxicity experiments have shown that the toxicity of QDs was connected to their properties such as size, surface charge and functional group.16,17 How these properties affect QD behavior at mitochondrial level is unclear. To illuminate this question, our group discussed the effects of surface ligand length as well as particle size on the toxicity of CdTe QDs at the mitochondrial level.18,19 In this work, we further investigated the action mechanism of CdTe QDs on mitochondria from the aspect of the surface functional group. –COOH and –NH2 are two of the most commonly used functional groups when QDs are used in bio-systems. Thioglycollic acid (TGA) contains –COOH and mercaptoethylamine (MEA) contains –NH2. l-Cysteine (l-Cys) contains both –COOH and –NH2. Except for these functional groups, the three compounds have similar structures, which make them the perfect choice to study the effects of the surface functional group on mitochondria. CdTe QDs were coated by the three types of compounds, and then their effects on mitochondrial physiological functions were studied. This work helps us to better understand the toxicity mechanism of QDs at the subcellular level.
2. Experimental section
2.1. Materials and reagents
CdCl2 (99.99%), tellurium powder (99.999%), NaBH4 (99%), NaOH, thioglycollic acid (TGA), mercaptoethylamine (MEA), l-cysteine (l-Cys), rhodamine 123 (Rh123), hematoporphyrin (HP), dithoithreitol (DTT), Ethylene Diamine Tetraacetic Acid (EDTA), Ethylene Glycol Tetraacetic Acid (EGTA), cyclosporin A (CsA), ruthenium red (RR) and ADP were purchased from Sigma-Aldrich Chemical Co. and used without further purification. All other reagents were of analytical grade. Solutions were prepared using ultrapure water (18.2 MΩ cm–1, Millipore).
Buffer A: 100 mM sucrose, 10 mM Tris-MOPS, 1 mM EDTA, 50 mM KCl, 2 mM MgCl2, 10 mM KH2PO4 and 2 mM rotenone, pH 7.4. Buffer B: 200 mM sucrose, 5 mM succinate, 1 μM EGTA-Tris, 1 mM Tris-MOPS, 2 μM rotenone and 3 μg mL–1 oligomycin, pH 7.4.
2.2. Preparation of TGA-CdTe QDs
0.2 mol Te powder and 0.5 mol NaBH4 were added to 20 mL ultrapure water. The mixture was stirred on an ice bath for 4 h under N2 flow. The NaHTe solution was thus prepared. The solution was stored at 4 °C for further use.
0.48 mmol CdCl2 and 0.2 mmol TGA were dissolved in 100 mL ultrapure water. The pH of solution was adjusted to 8.0. N2 flow was used to remove the oxygen in the solution and the experimental apparatus for 30 min 4 mL freshly prepared NaHTe solution (40 mmol) was injected into the solution with vigorous stirring at room temperature. The stirring continued for 15 min, the solution was then heated to 100 °C and refluxed for 6 h. TGA-CdTe QDs solution was thus prepared.
2-Propanol was added to the solution to separate the TGA-CdTe QD particles by centrifugation. Later, the particles were dissolved in water and re-precipitated. This process was repeated 3 times to obtain pure TGA-CdTe QDs. The products were finally dispersed in water and stored at 4 °C for further experiments.
2.3. Preparation of MEA-CdTe QDs
The pH of CdCl2 and MEA solution was adjusted to 5.5 and the reflux time was changed to 45 min. Rest of the reaction conditions and purification process were the same as stated above for the preparation of TGA-CdTe QDs.
2.4. Preparation of l-Cys-CdTe QDs
The pH of CdCl2 and l-Cys solution was adjusted to 10 and the reflux time was changed to 50 min. Rest of the reaction conditions and purification process were the same as stated above for the preparation of TGA-CdTe QDs.
2.5. Characterization of QDs
UV-visible absorption spectra of QDs were obtained by a Mapada TU1900 UV-vis spectrophotometer at room temperature. Fluorescence spectroscopy measurements of QDs were performed on a PerkinElmer LS55 spectrophotometer with an excitation wavelength of 385 nm at room temperature. Transmission electron microscopy (TEM) of QDs was conducted on a JEOL JEM-2100 electron microscope. Size distributions of QDs were calculated from the results of TEM. ζ-Potential and hydrodynamic size of the QDs were tested on a Malvern Zetasizer Nano ZS. The concentrations of QDs were quantified by their extinction coefficients according to a ref. 20.
2.6. Isolation of mitochondria
Experimental mitochondria were isolated from the liver tissue of female Wistar rats (150–200 g) by a commonly used differential centrifugation method.21 The detailed isolation process was described in our previous work.18 Concentration of mitochondria was quantified by biuret method using BSA as standard agent.
2.7. Mitochondrial respiratory rate
Mitochondrial respiratory rate was measured by checking the oxygen consumption of 1 mL mitochondrial suspensions (1 mg mL–1) in buffer A with a Clark oxygen electrode (Hansatech, UK) at 25 °C.22 5 mM succinate served as the respiratory substrate. State 4 of mitochondrial respiratory rate was detected in the condition of substrate. State 3 of mitochondrial respiratory rate was detected in the condition of substrate and 2.5 mM ADP. Uncoupled state of mitochondrial respiratory rate was detected in the condition of substrate and 30 μM DNP. Respiratory control ratio (RCR) was the ratio of state 3 to state 4. The effects of different concentrations of QDs on mitochondrial respiratory rate were tested.
2.8. Mitochondrial swelling
Mitochondria were dispersed in buffer B (1 mg mL–1). The absorbance of 200 μL mitochondrial suspensions at 540 nm were recorded on a multifunctional enzyme marking instrument (BiTech, China) at 25 °C.21 Mitochondrial swelling was reflected by the change in absorbance. The effects of different concentrations of QDs on mitochondrial swelling were measured.
2.9. Interaction mechanism of QDs on mitochondrial permeability transition (MPT) pore
The interaction mechanism of QDs on MPT pore was measured by the protective effects of several MPT inhibitors on mitochondrial swelling. Inhibitors CsA, ADP, EDTA, EGTA, RR and DTT were pre-incubated with mitochondria for 3 min before adding 400 nM QDs.
2.10. Mitochondrial membrane potential
200 μL mitochondrial suspensions (1 mg mL–1) were pre-incubated with 1 μM Rh123 in buffer B for 3 min. Different concentrations of QDs were then added into the mixture. The fluorescence intensity at λex = 488 nm and λem = 525 nm was recorded on a multifunctional enzyme marking instrument (BiTech, China) at 25 °C. The change in mitochondrial membrane potential was assessed by the fluorescence intensity of Rh123.23
2.11. Mitochondrial membrane fluidity
2 mL mitochondrial suspensions (0.5 mg mL–1) were pre-incubated with 5 μM HP in buffer B for 3 min. Different concentrations of QDs were then added into the mixture. The anisotropy value (r) of the system was recorded at λex = 520 nm and λem = 626 nm on a LS-55 fluorophotometer (PerkinElmer, USA) at 25 °C. The change in mitochondrial membrane fluidity was reflected by the anisotropy value.24,25
2.12. Cd2+ released by CdTe QDs
3 mL mitochondrial suspensions (0.5 mg mL–1) were co-incubated with 100 nM CdTe QDs in buffer B for 30 min at 25 °C. Mitochondria and un-decomposed CdTe QDs were separated from the system by high speed centrifugation (11 000 rpm) for 30 min. Supernatant was collected and re-centrifuged (11 000 rpm) for 1 h in a 3 kDa Amicon (Millipore). The filter liquor was collected, nitrified and then quantified to 10 mL with ultrapure water. The Cd2+ content was measured using Inductively Coupled Plasma-Atomic Emission Spectrometry (ICP-AES, IRIS Intrepid II XSP, Thermo Electron, USA). The initial content of free Cd2+ in CdTe QDs was also tested after ultrafiltration.
3. Results
3.1. Characterization of QDs
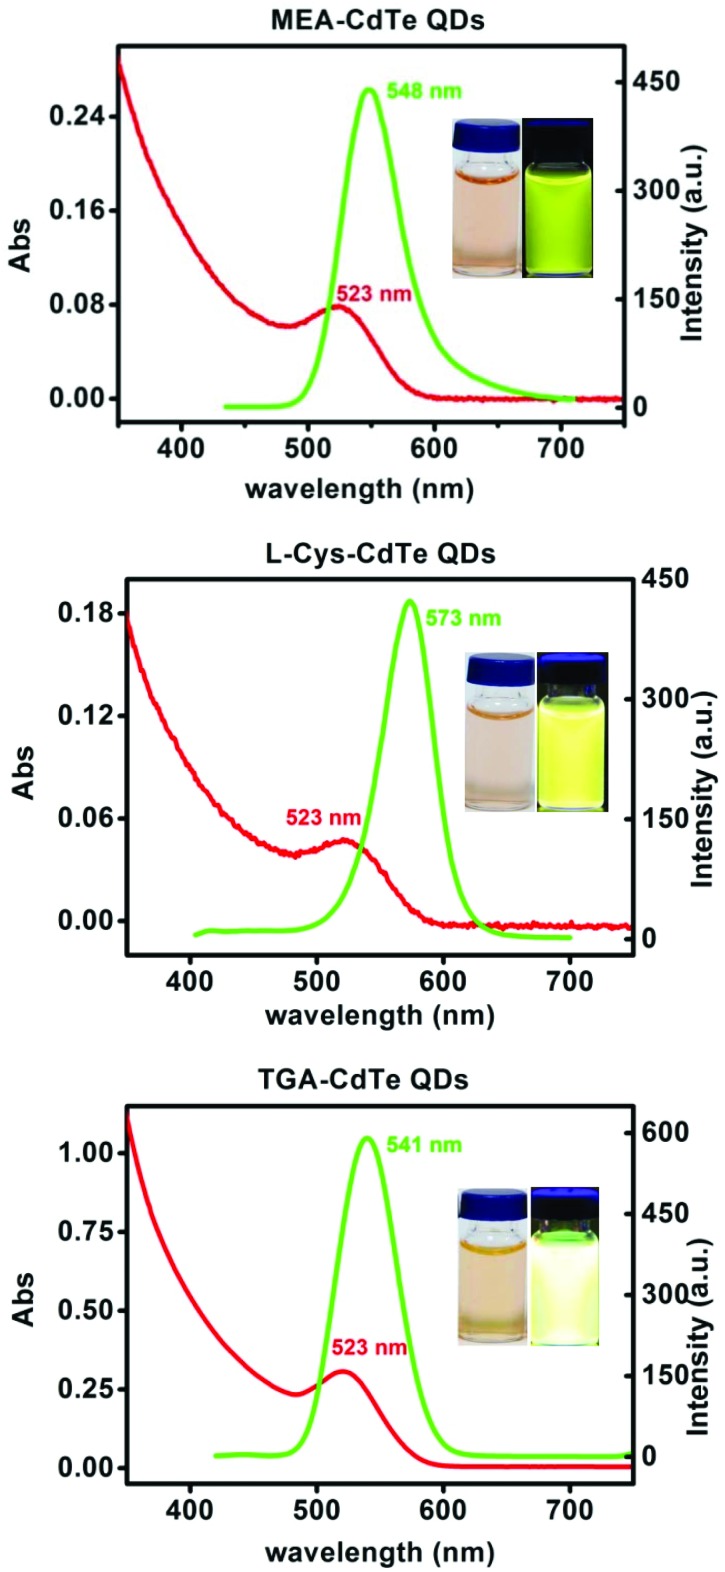
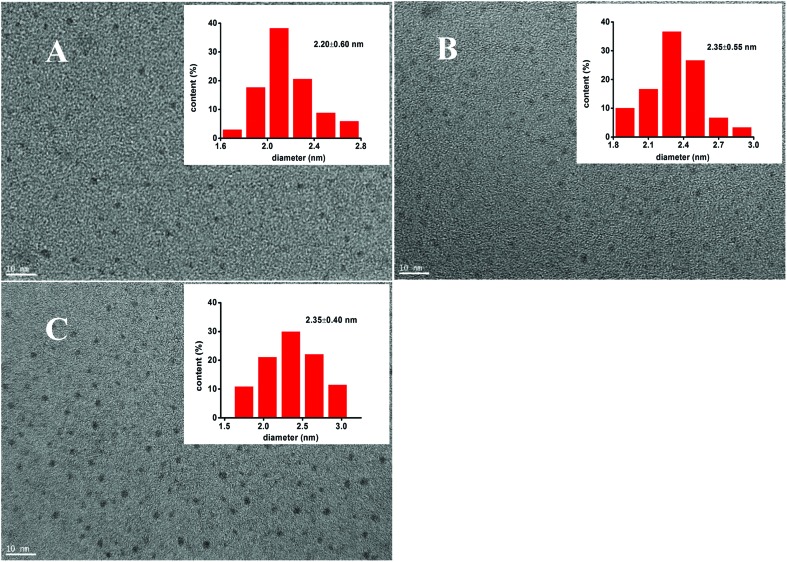
UV-visible absorption spectra and photoluminescence spectra of the three types of CdTe QDs are shown in Fig. 1. The three types of CdTe QDs had the same absorption peak at 523 nm. The fluorescence peaks of MEA-CdTe QDs, l-Cys-CdTe QDs and TGA-CdTe QDs were 548 nm, 573 nm and 541 nm, respectively. Transmission electronic microscopic (TEM) images and size distributions of the three types of CdTe QDs are shown in Fig. 2. The diameters of MEA-CdTe QDs, l-Cys-CdTe QDs and TGA-CdTe QDs were 2.20 ± 0.60 nm, 2.35 ± 0.55 nm and 2.35 ± 0.40 nm, respectively. The three types of CdTe QDs had similar size. The hydrodynamic size and ζ-potential of the three types of CdTe QDs were tested. The results are listed in Table 1. The hydrodynamic sizes of MEA-CdTe QDs, l-Cys-CdTe QDs and TGA-CdTe QDs were 19.5 ± 0.5 nm, 23.1 ± 0.6 nm and 15.2 ± 0.6 nm, respectively. The ζ-potential of MEA-CdTe QDs, l-Cys-CdTe QDs and TGA-CdTe QDs were 20.3 ± 0.9 mV, –10.2 ± 0.4 mV and –24.0 ± 2.0 mV, respectively.
Fig. 1. UV-visible absorption spectra and photoluminescence spectra of MEA-CdTe QDs, l-Cys-CdTe QDs and TGA-CdTe QDs. The insets are their photographs under ambient light (left) and UV lamp (right).
Fig. 2. TEM images of different CdTe QDs. A: MEA-CdTe QDs, B: l-Cys-CdTe QDs, C: TGA-CdTe QDs. The insets are their diameter distributions.
Table 1. Hydrodynamic size and ζ-potential of different CdTe QDs.
| Hydrodynamic size (nm) | ζ-Potential (mV) | |
| MEA-CdTe QDs | 19.5 ± 0.5 | 20.3 ± 0.9 |
| l-Cys-CdTe QDs | 23.1 ± 0.6 | –10.2 ± 0.4 |
| TGA-CdTe QDs | 15.2 ± 0.6 | –24.0 ± 2.0 |
3.2. Effects of QDs on mitochondrial respiration
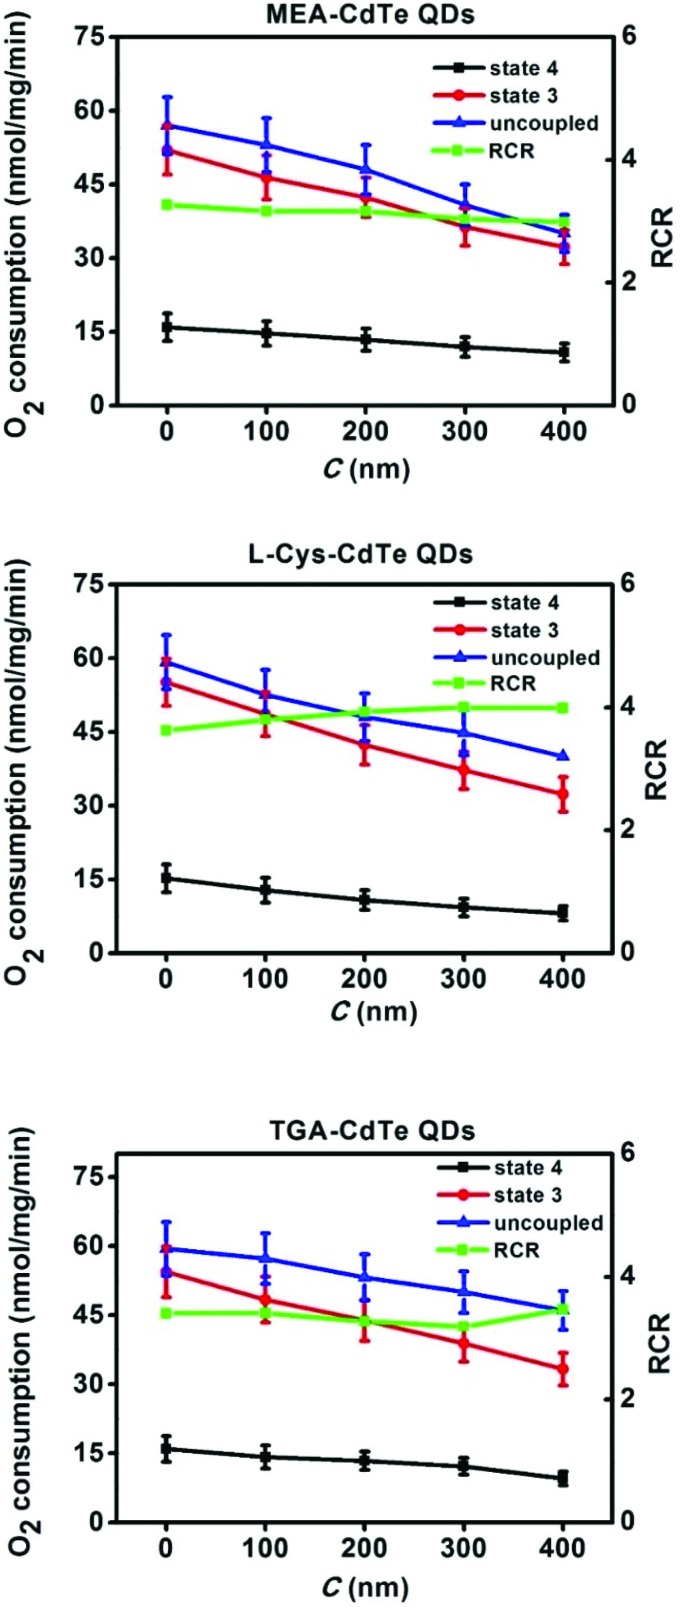
Fig. 3 shows the effects of different concentrations of QDs on mitochondrial respiratory functions. It was observed that all three types of CdTe QDs decreased the mitochondrial respiratory rate of state 3, state 4 and the uncoupled state in a dose-dependent manner. This result shows that all three types of CdTe QDs could impair mitochondrial respiratory functions.26 RCR, an important parameter that revealed the coupling of oxidative phosphorylation,27 changed slightly with the addition of the three types of CdTe QDs. In general, the three types of CdTe QDs showed similar effects on mitochondrial respiratory functions.
Fig. 3. Effects of different concentrations of MEA-CdTe QDs, l-Cys-CdTe QDs and TGA-CdTe QDs on mitochondrial respiratory rate. The results were expressed as mean ± SD of three separate tests.
3.3. Effects of QDs on mitochondrial swelling
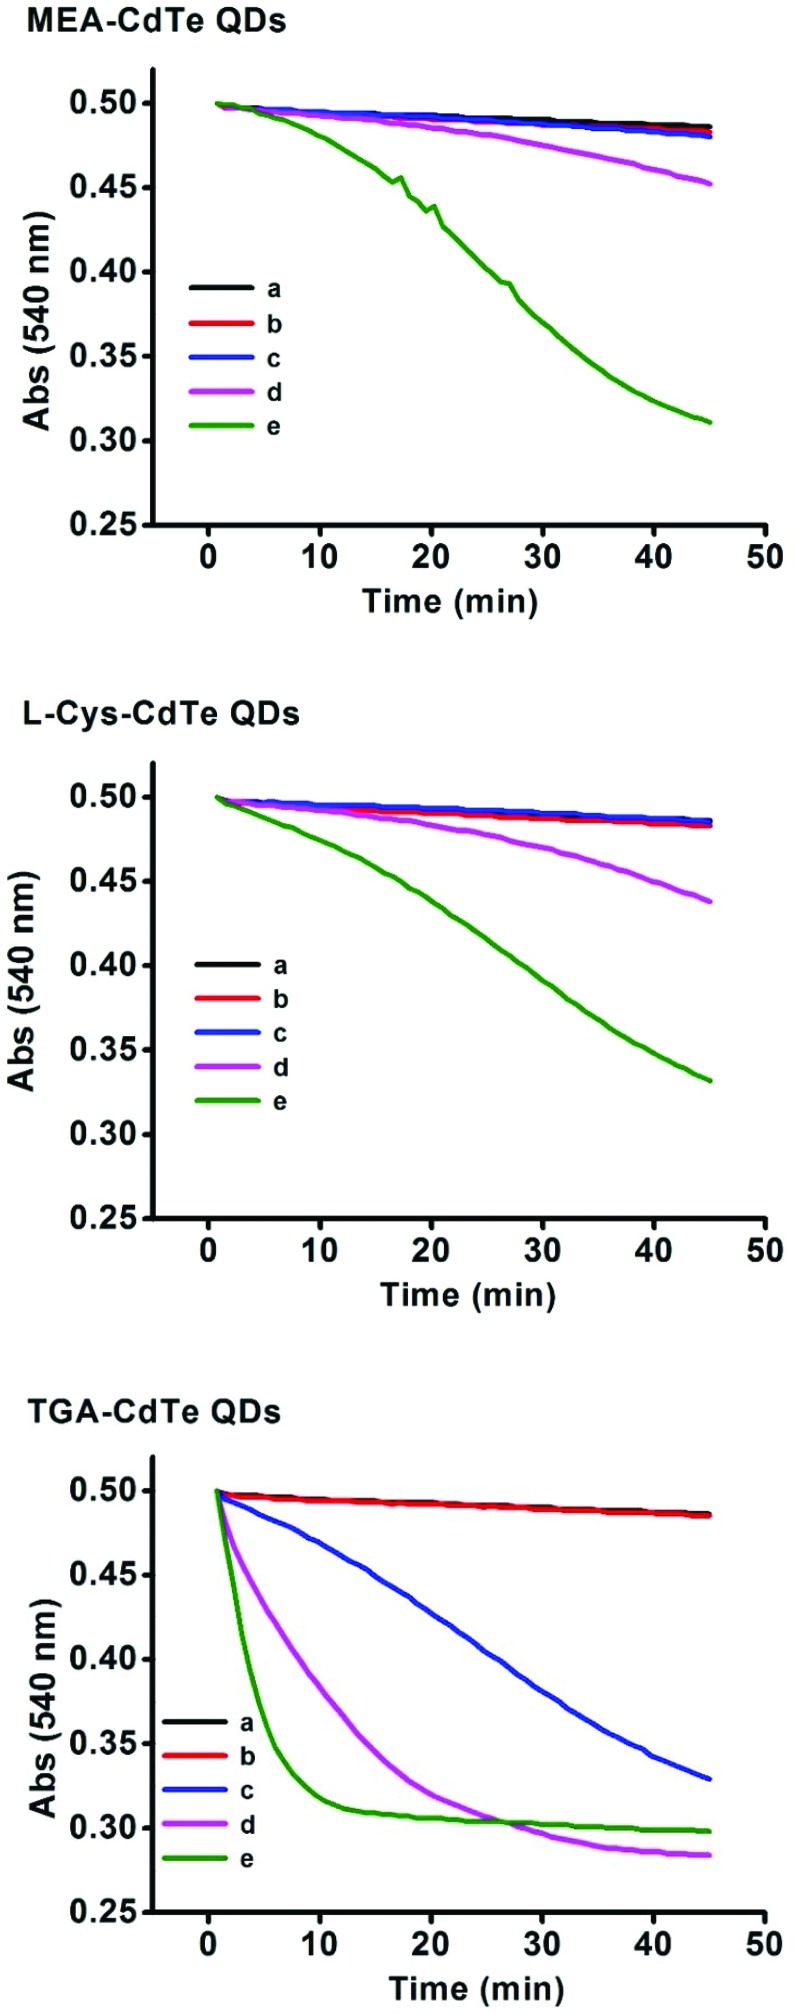
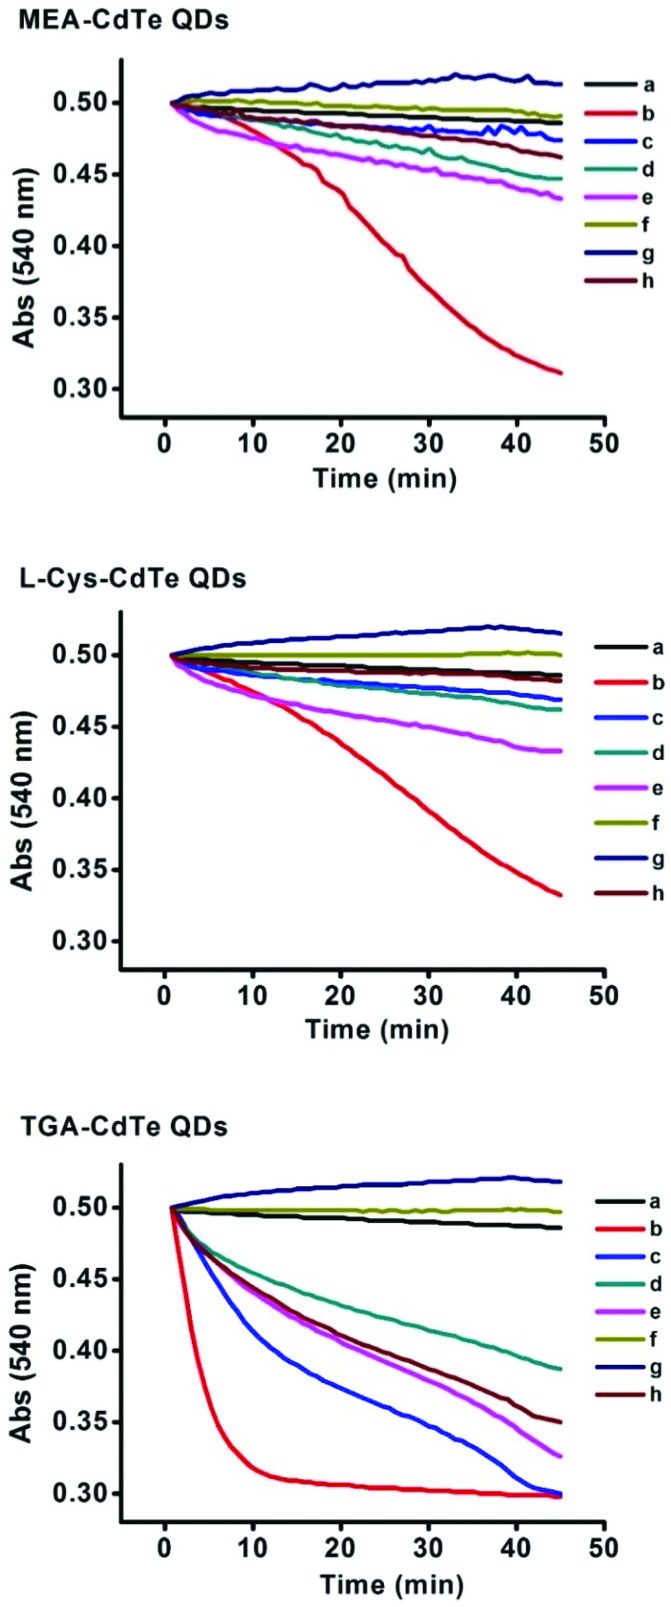
Mitochondrial swelling was reflected by the absorbance at 540 nm. Effects of the three types of CdTe QDs on mitochondrial swelling are shown in Fig. 4. The absorbance decreased very slightly when a low concentration of CdTe QDs was added (100–200 nM for MEA-CdTe QDs and l-Cys-CdTe QDs, 100 nM for TGA-CdTe QDs), whereas the absorbance decreased significantly when a high concentration of CdTe QDs was added (300–400 nM for MEA-CdTe QDs and l-Cys-CdTe QDs, 200–400 nM for TGA-CdTe QDs). It could also be observed that TGA-CdTe QDs decreased the absorbance faster and stronger than MEA-CdTe QDs and l-Cys-CdTe QDs at the same concentration (200–400 nM). MEA-CdTe QDs and l-Cys-CdTe QDs decreased the absorbance in a similar manner. This result revealed that MEA-CdTe QDs and l-Cys-CdTe QDs had basically the same effects on mitochondrial swelling, while TGA-CdTe QDs had stronger effects than those of the other two.
Fig. 4. Mitochondrial swelling induced by different concentrations of MEA-CdTe QDs, l-Cys-CdTe QDs and TGA-CdTe QDs. a, b, c, d, e represents mitochondria treated with 0 nM, 100 nM, 200 nM, 300 nM and 400 nM QDs respectively.
3.4. Effects of QDs on mitochondrial membrane potential
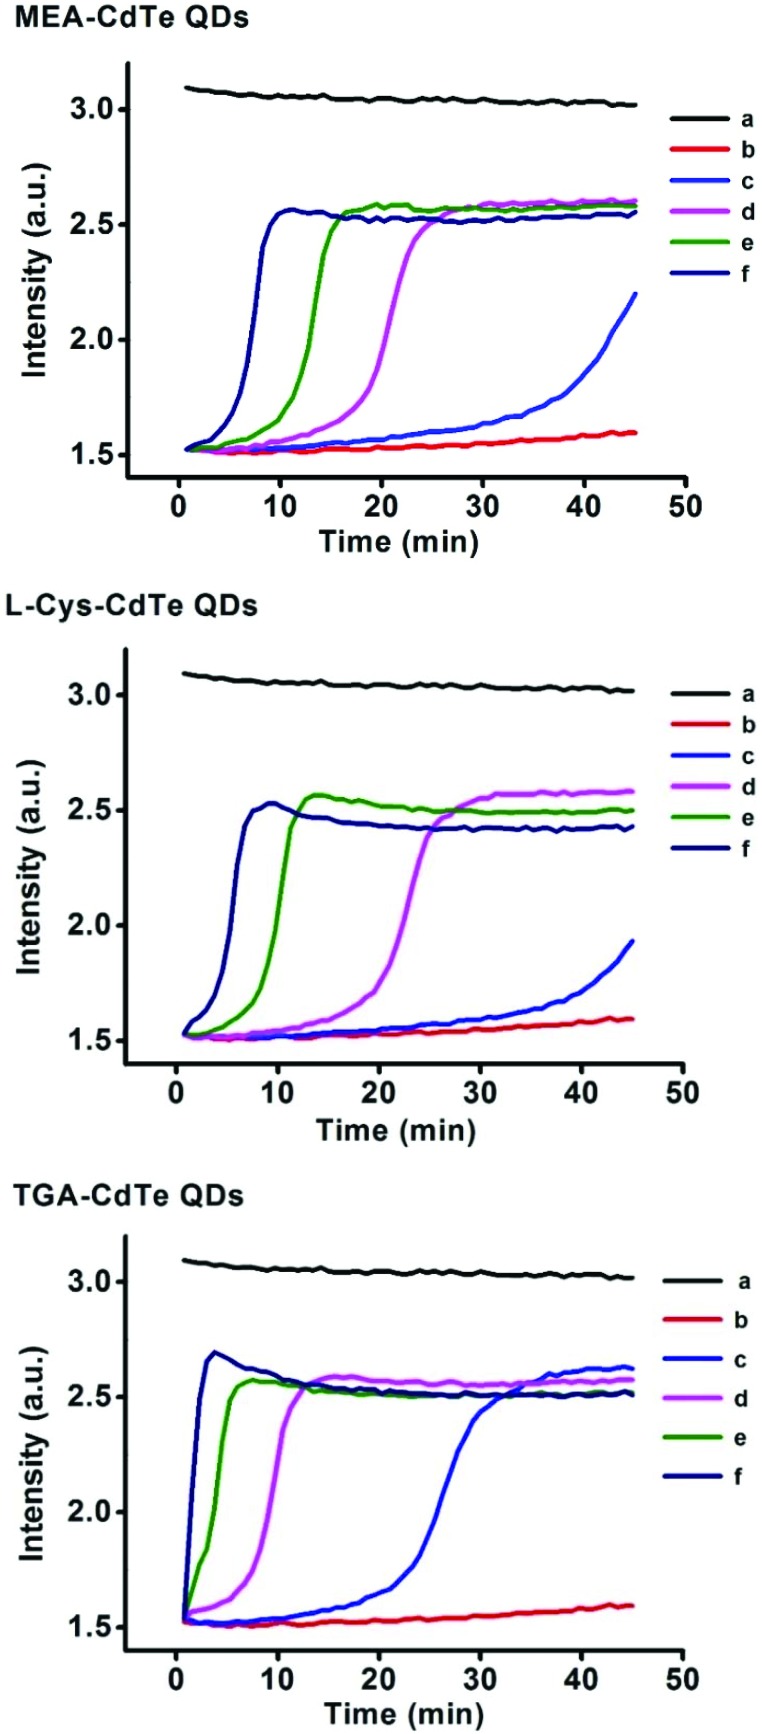
Rh123 accumulated in the mitochondrial matrix was driven by the transmembrane potential and released in buffer when the transmembrane potential dissipated.28 The fluorescence signal of Rh123 reflected the transmembrane potential. Fig. 5 shows the effects of the three types of CdTe QDs on the mitochondrial transmembrane potential. It was observed that all the three types of CdTe QDs could induce the increase of Rh123 fluorescence. And, when the concentration of the three types of CdTe QDs increased, the fluorescence of Rh123 changed faster. This result showed all three types of CdTe QDs could impair mitochondrial transmembrane potential in a dose-dependent manner. It could also be found that the increase of Rh123 fluorescence was similar under the same concentration of MEA-CdTe QDs and l-Cys-CdTe QDs, while TGA-CdTe QDs induced an obviously faster increase of Rh123 fluorescence than the other two. This result revealed that MEA-CdTe QDs and l-Cys-CdTe QDs had similar effects on the mitochondrial membrane potential, while TGA-CdTe QDs had stronger effects than those of the other two.
Fig. 5. Decrease in the transmembrane potential caused by different concentrations of MEA-CdTe QDs, l-Cys-CdTe QDs and TGA-CdTe QDs. a: Rh123, b: Rh123 + mitochondria, c: Rh123 + mitochondria + 100 nM QDs, d: Rh123 + mitochondria + 200 nM QDs, e: Rh123 + mitochondria + 300 nM QDs, f: Rh123 + mitochondria + 400 nM QDs.
3.5. Effects of QDs on mitochondrial membrane fluidity
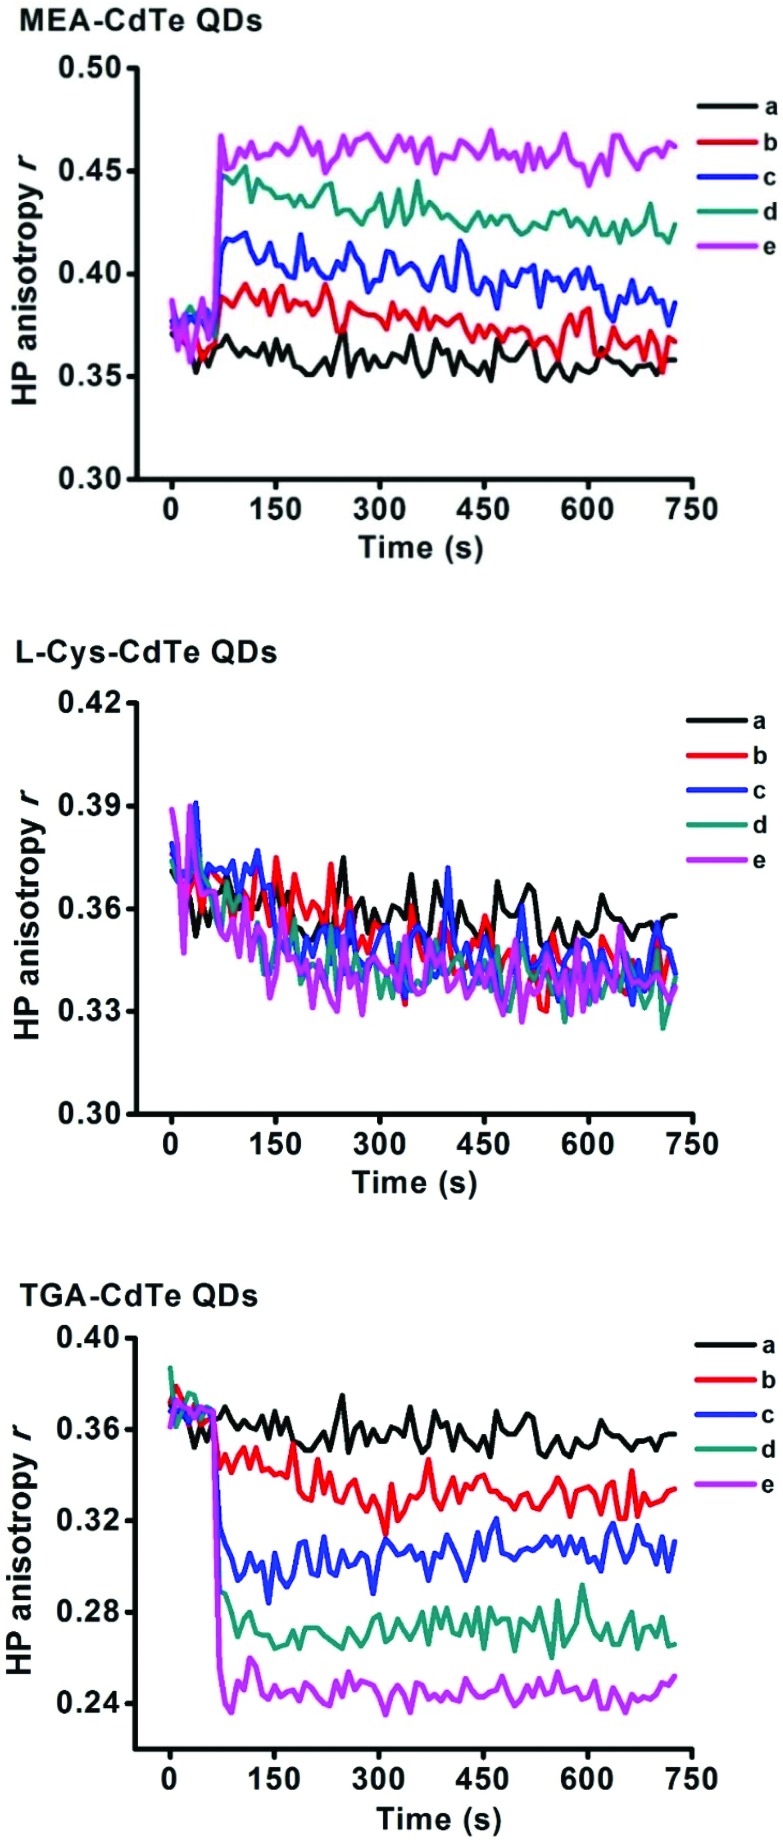
HP is a commonly used fluorescence probe to check membrane fluidity, and its high anisotropy value means low membrane fluidity.29 The effects of the three types of CdTe QDs on mitochondrial membrane fluidity are shown in Fig. 6. It can be observed that the three types of CdTe QDs showed completely different effects on mitochondrial membrane fluidity. MEA-CdTe QDs decreased mitochondrial membrane fluidity in a dose-dependent manner. l-Cys-CdTe QDs showed no obvious influence on mitochondrial membrane fluidity. TGA-CdTe QDs increased mitochondrial membrane fluidity in a dose-dependent manner.
Fig. 6. Effects of different concentrations of MEA-CdTe QDs, l-Cys-CdTe QDs and TGA-CdTe QDs on mitochondrial membrane fluidity assessed by the anisotropy of HP. a, b, c, d, e represented mitochondria treated with 0 nM, 100 nM, 200 nM, 300 nM and 400 nM CdTe QDs respectively.
3.6. Interaction mechanism of CdTe QDs on MPT
Mitochondrial swelling usually indicates the opening of MPT pores.30 The interaction mechanism of CdTe QDs on MPT pores was studied in the presence of some inhibitors. The results are shown in Fig. 7. RR is a non-competitive inhibitor of Ca2+, which can cross the mitochondrial inner membrane.31 EGTA and EDTA are two types of metal ion chelators.32 Mitochondrial swelling induced by the three kinds of CdTe QDs (400 nM) was completely inhibited in the presence of EGTA and EDTA (curve f and g), and was effectively inhibited in the presence of RR (curve d). This result indicates that the interaction mechanism of the three types of CdTe QDs on the MPT pore was related to the metal ion released by them. CyP-D and ANT are two kinds of MPT pore proteins. CsA interacts with CyP-D to inhibit the opening of MPT pores.33 ADP regulates the conformation of ANT to modulate MPT.34 Both CsA and ADP could inhibit mitochondrial swelling induced by the three types of CdTe QDs (400 nM) to a certain degree (curve h and e). This result showed that the three types of CdTe QDs could interact with MPT pore proteins. However, it could also be observed that CsA and ADP showed better inhibitory effects on MEA-CdTe QDs and l-Cys-CdTe QDs (400 nM) than on TGA-CdTe QDs (400 nM). This meant TGA-CdTe QDs had a larger effect on MPT pore proteins than MEA-CdTe QDs and l-Cys-CdTe QDs. DTT can permeate the mitochondrial inner membrane and can inhibit MPT pore by reducing the –SH on inner membrane proteins.35 It was observed that DTT effectively inhibited mitochondrial swelling induced by MEA-CdTe QDs and l-Cys-CdTe QDs (400 nM), while only partly slowed down the mitochondrial swelling induced by TGA-CdTe QDs (400 nM, curve c). This result not only verified the effects of the three types of CdTe QDs on mitochondrial membrane proteins, but also indicated the stronger impact of TGA-CdTe QDs on membrane proteins than those of MEA-CdTe QDs and l-Cys-CdTe QDs. Taking the effects of all six inhibitors into consideration, it could be concluded that the impact of the three types of CdTe QDs on MPT pores was not only related to the metal ion released by them but also to their interaction with MPT pore proteins.
Fig. 7. Protective effects of some inhibitors on mitochondrial swelling induced by 400 nM QDs. a: Control, b: 400 nM QDs, c: 250 μM DTT + 400 nM QDs, d: 10 μM RR + 400 nM QDs, e: 1 mM ADP + 400 nM QDs, f: 50 μM EGTA + 400 nM QDs, g: 50 μM EDTA + 400 nM QDs, h: 15 μM CsA + 400 nM QDs.
3.7. Cd2+ released by CdTe QDs
CdTe QDs decompose and release Cd2+ when they interact with mitochondria. The Cd2+ content released by the three types of CdTe QDs was analyzed. The results are listed in Table 2. The initial amount of free Cd2+ in the three types of CdTe QDs solutions was negligible and could not be detected. The Cd2+ released by MEA-CdTe QDs, l-Cys-CdTe QDs and TGA-CdTe QDs were 0.085 ± 0.01 mg L–1, 0.19 ± 0.02 mg L–1 and 0.21 ± 0.02 mg L–1, respectively.
Table 2. The content of Cd2+ released by CdTe QDs.
| Initial Cd2+ in CdTe QDs solution (mg L–1) | Cd2+ released by CdTe QDs (mg L–1) | |
| MEA-CdTe QDs | NA | 0.085 ± 0.01 |
| l-Cys-CdTe QDs | NA | 0.19 ± 0.02 |
| TGA-CdTe QDs | NA | 0.21 ± 0.02 |
4. Discussion
Particle size could affect the bio-behavior of QDs.16 To illuminate the effects of surface functional groups on QD toxicity, the size of the QDs needs to be very similar. Strict experimental conditions were adopted and three types of CdTe QDs with similar size were synthesized. Their similar size was certified by the results obtained from the absorption spectrum (Fig. 1), TEM and size distributions (Fig. 2).
Energy production by respiration is the fundamental physiological function of mitochondria. The effects of the three types of CdTe QDs on mitochondrial respiration were tested. The results showed that the three types of CdTe QDs impaired mitochondrial respiration of different states in a similar manner (Fig. 3). The respiration of state 4 was considered to be related to proton leak and inner membrane integrity.36 The damage of the three types of CdTe QDs on proton leak and inner membrane integrity was proven by their effects on membrane potential and mitochondrial swelling (Fig. 5 and 4). Interestingly, though all the three types of CdTe QDs showed effects on membrane potential and mitochondrial swelling, their abilities were different. In general, MEA-CdTe QDs and l-Cys-CdTe QDs showed a similar ability, while TGA-CdTe QDs showed a stronger ability. Mitochondrial swelling and membrane potential dissipation indicated the opening of MPT pores.37,38 When MPT pore opening occurred, the fluidity of the membrane usually changed.39 The effects of the three types of CdTe QDs on mitochondrial membrane fluidity were studied (Fig. 6). Very interestingly, the three types of CdTe QDs showed significantly different effects on mitochondrial membrane fluidity. MEA-CdTe QDs decreased mitochondrial membrane fluidity in a dose-dependent manner, l-Cys-CdTe QDs showed no obvious influence on mitochondrial membrane fluidity, while TGA-CdTe QDs increased mitochondrial membrane fluidity in a dose-dependent manner. To clarify the different effects of the three types of CdTe QDs on mitochondrial structure and functions, their interaction mechanism on MPT pores was studied with some inhibitors (Fig. 7). The metal ion chelators EGTA, EDTA and RR could effectively inhibit mitochondrial swelling induced by the three types of CdTe QDs. The protein inhibitors CsA, ADP and DTT could prevent mitochondrial swelling induced by the three types of CdTe QDs to a certain degree. This result showed the impact of the three types of CdTe QDs on MPT pore was not only related to the metal ion released by them but also to their interaction with MPT pore proteins. Particularly, it could also be observed that protein inhibitors showed better inhibitory effects on MEA-CdTe QDs and l-Cys-CdTe QDs than on TGA-CdTe QDs. This meant TGA-CdTe QDs had stronger effects on MPT pore proteins than that of the two other QDs. To further illuminate the role of metal ion in the toxicity of CdTe QDs, mitochondria were incubated with the three types of CdTe QDs and then the Cd2+ content released by them was analyzed (Table 2). Cd2+ released by MEA-CdTe QDs, l-Cys-CdTe QDs and TGA-CdTe QDs were 0.085 ± 0.01 mg L–1, 0.19 ± 0.02 mg L–1 and 0.21 ± 0.02 mg L–1, respectively. The amount of Cd2+ released by the three types of CdTe QDs was not in accordance with their effects on mitochondrial structure and functions. This verified the point that the metal ion was not the only factor that affected CdTe QDs toxicity.
MEA, l-Cys and TGA have similar structures except for the surface functional groups. Surface functional groups affect the interaction of the three types of CdTe QDs with mitochondrial membrane proteins, and thus affect the toxicity of CdTe QDs on mitochondria. This work helps us to better understand the CdTe QDs toxicity mechanism from the aspect of surface functional groups at the sub-cellular level.
5. Conclusion
Strict experimental conditions were adopted and three types of CdTe QDs with similar size but different surface functional groups were synthesized. The effects of the three types of CdTe QDs on mitochondria were studied. The three types of CdTe QDs impaired mitochondrial respirations of different states in a similar manner while they affected membrane potential and mitochondrial swelling with different abilities. In general, MEA-CdTe QDs and l-Cys-CdTe QDs showed similar abilities, TGA-CdTe QDs showed a stronger ability. Moreover, the three types of CdTe QDs showed significantly different effects on mitochondrial membrane fluidity. MEA-CdTe QDs decreased mitochondrial membrane fluidity, l-Cys-CdTe QDs showed no obvious influence on mitochondrial membrane fluidity and TGA-CdTe QDs increased mitochondrial membrane fluidity. To clarify the different effects of the three types of CdTe QDs on mitochondrial structure and functions, their interaction mechanism on the MPT pore as well as the amount of Cd2+ released were studied. The results showed the impact of the three types of CdTe QDs on mitochondria was not only related to the release of metal ion by them but also to their interaction with MPT pore proteins.
Conflicts of interest
There are no conflicts to declare.
Acknowledgments
The authors gratefully acknowledge the financial support from National Infectious Diseases Project (2018ZX10301405), National Natural Science Foundation of China (21303126, 21573168, 21473125), Guangxi Science and Technology Project (GuiKeAD17195081) and Bagui Scholar Program of Guangxi Province.
References
- Hardman R. Environ. Health Perspect. 2006;114:165–172. doi: 10.1289/ehp.8284. [DOI] [PMC free article] [PubMed] [Google Scholar]
- Rodrigues S. S. M., Ribeiro D. S. M., Soares J. X., Passos M. L. C., Saraiva M. L. M. F. S., Santos J. L. M. Coord. Chem. Rev. 2017;330:127–143. [Google Scholar]
- Wang Y. C., Hu R., Lin G. M., Roy I., Yong K. T. ACS Appl. Mater. Interfaces. 2013;5:2786–2799. doi: 10.1021/am302030a. [DOI] [PubMed] [Google Scholar]
- Hu L., Zhang C., Zeng G. M., Chen G. Q., Wan J., Guo Z., Wu H. P., Yu Z. G., Zhou Y. Y., Liu J. F. RSC Adv. 2016;6:78595–78610. [Google Scholar]
- Galluzzi L., Joza N., Tasdemir E., Maiuri M. C., Hengartner M., Abrams J. M., Tavernarakis N., Penninger J., Madeo F., Kroeme G. Cell Death Differ. 2008;15:1113–1123. doi: 10.1038/cdd.2008.28. [DOI] [PMC free article] [PubMed] [Google Scholar]
- Nunnari J., Suomalainen A. Cell. 2012;148:1145–1159. doi: 10.1016/j.cell.2012.02.035. [DOI] [PMC free article] [PubMed] [Google Scholar]
- Fadeel B., Orrenius S., Zhivotovsky B. Biochem. Biophys. Res. Commun. 1999;266:699–717. doi: 10.1006/bbrc.1999.1888. [DOI] [PubMed] [Google Scholar]
- Tillement L., Lecanu L., Papadopoulos V. Mitochondrion. 2011;11:13–21. doi: 10.1016/j.mito.2010.08.009. [DOI] [PubMed] [Google Scholar]
- Li X. J., Orr A. L., Li S. H. Biochim. Biophys. Acta. 2010;1802:62–65. doi: 10.1016/j.bbadis.2009.06.008. [DOI] [PMC free article] [PubMed] [Google Scholar]
- Drago D., Cavaliere A., Mascetra N., Ciavardelli D., Dillio C., Zatta P., Sensi S. L. Rejuvenation Res. 2008;11:861–871. doi: 10.1089/rej.2008.0761. [DOI] [PubMed] [Google Scholar]
- Liu X. R., Jia Z. G., Chen J. H. J. Phys. Chem. B. 2017;121:9160–9168. doi: 10.1021/acs.jpcb.7b06768. [DOI] [PMC free article] [PubMed] [Google Scholar]
- Li J. H., Zhang Y., Xiao Q., Tian F. F., Liu X. R., Li R., Zhao G. Y., Jiang F. L., Liu Y. J. Hazard. Mater. 2011;194:440–444. doi: 10.1016/j.jhazmat.2011.07.113. [DOI] [PubMed] [Google Scholar]
- Rocha T. L., Gomes T., Durigon E. G., Bebianno M. J. Sci. Total Environ. 2016;554:130–141. doi: 10.1016/j.scitotenv.2016.02.168. [DOI] [PubMed] [Google Scholar]
- Nguyen K. C., Rippstein P., Tayabali A. F., Willmore W. G. Toxicol. Sci. 2015;146:31–42. doi: 10.1093/toxsci/kfv068. [DOI] [PMC free article] [PubMed] [Google Scholar]
- Chan W. H., Shiao N. H., Lu P. Z. Toxicol. Lett. 2006;167:191–200. doi: 10.1016/j.toxlet.2006.09.007. [DOI] [PubMed] [Google Scholar]
- Nagy A., Steinbrück A., Gao J., Doggett N., Hollingsworth J. A., Iyer R. ACS Nano. 2012;6:4748–4762. doi: 10.1021/nn204886b. [DOI] [PubMed] [Google Scholar]
- Wang L. L., Zheng H. Z., Long Y. J., Gao M., Hao J. Y., Du J., Mao X. J., Zhou D. B. J. Hazard. Mater. 2010;177:1134–1137. doi: 10.1016/j.jhazmat.2009.12.001. [DOI] [PubMed] [Google Scholar]
- Xiang X., Wu C., Zhang B. R., Gao T., Zhao J., Ma L., Jiang F. L., Liu Y. Chemosphere. 2017;184:1108–1116. doi: 10.1016/j.chemosphere.2017.06.091. [DOI] [PubMed] [Google Scholar]
- Lai L., Li Y. P., Mei P., Chen W., Jiang F. L., Liu Y. J. Membr. Biol. 2016;249:757–767. doi: 10.1007/s00232-016-9920-3. [DOI] [PubMed] [Google Scholar]
- Yu W. W., Qu L. H., Guo W. Z., Peng X. G. Chem. Mater. 2003;15:2854–2860. [Google Scholar]
- Belyaeva E. A., Korotkov S. M. Toxicol. Appl. Pharmacol. 2003;192:56–68. doi: 10.1016/s0041-008x(03)00255-2. [DOI] [PubMed] [Google Scholar]
- Ricchellia F., Beghettoa C., Gobboa S., Tognona G., Morettob V., Crisma M. Arch. Biochem. Biophys. 2003;410:155–160. doi: 10.1016/s0003-9861(02)00667-7. [DOI] [PubMed] [Google Scholar]
- Pacelli C., Latorre D., Cocco T., Capuano F., Kukat C., Seibel P., Villani G. Mitochondrion. 2011;11:334–341. doi: 10.1016/j.mito.2010.12.004. [DOI] [PubMed] [Google Scholar]
- Ricchelli F., Gobbo S., Moreno G., Salet C. Biochemistry. 1999;38:9295–9300. doi: 10.1021/bi9900828. [DOI] [PubMed] [Google Scholar]
- Zhao J., Zhou Z. Q., Jin J. C., Yuan L., He H., Jiang F. L., Yang X. G., Daia J., Liu Y. Chemosphere. 2014;100:194–199. doi: 10.1016/j.chemosphere.2013.11.031. [DOI] [PubMed] [Google Scholar]
- Adlam V. J., Harrison J. C., Porteous C. M., James A. M., Smith R. A. J., Murphy M. P., Sammut I. V. FASEB J. 2005;19:1088–1095. doi: 10.1096/fj.05-3718com. [DOI] [PubMed] [Google Scholar]
- Zhang S. R., Fu J. L., Zhou Z. C. Toxicol. In Vitro. 2004;18:71–77. doi: 10.1016/j.tiv.2003.09.002. [DOI] [PubMed] [Google Scholar]
- Huerta-García E., Pérez-Arizti J. A., Márquez-Ramírez S. G., Delgado-Buenrostro N. L., Chirino Y. I., Iglesias G. G., López-Marure R. Free Radical Biol. Med. 2014;73:84–94. doi: 10.1016/j.freeradbiomed.2014.04.026. [DOI] [PubMed] [Google Scholar]
- Jiao Y. H., Zhang Q., Pan L. L., Chen X. Y., Lei K. L., Zhao J., Jiang F. L., Liu Y. J. Membr. Biol. 2015;248:1071–1078. doi: 10.1007/s00232-015-9818-5. [DOI] [PubMed] [Google Scholar]
- Leung A. W. C., Halestrap A. P. Biochim. Biophys. Acta. 2008;1777:946–952. doi: 10.1016/j.bbabio.2008.03.009. [DOI] [PubMed] [Google Scholar]
- Grings M., Moura A. P., Amaral A. U., Parmeggiani B., Gasparotto J., Moreira J. C. F., Gelain D. P., Wyse A. T. S., Wajner M., Leipnitz G. Biochim.Biochim. Biophys. ActaBiophys. Acta. 2014;1842:1413–1422. doi: 10.1016/j.bbadis.2014.04.022. [DOI] [PubMed] [Google Scholar]
- González-Durruthy M., Monserrat J. M., Alberici L. C., Naal Z., Curti C., González-Díaz H. RSC Adv. 2015;5:103229–103245. [Google Scholar]
- Weng Z. Q., Luo Y., Yang X., Greenhaw J. J., Li H. B., Xie L. M., Mattes W. B., Shi Q. Toxicology. 2015;327:10–21. doi: 10.1016/j.tox.2014.11.002. [DOI] [PubMed] [Google Scholar]
- Korotkov S. M., Emelyanova L. V., Konovalova S. A., Brailovskaya I. V. Toxicol. In Vitro. 2015;29:1034–1041. doi: 10.1016/j.tiv.2015.04.006. [DOI] [PubMed] [Google Scholar]
- Custódio J. B. A., Cardoso C. M. P., Santos M. S., Almeida L. M., Vicente J. A. F., Fernandes M. A. S. Toxicology. 2009;259:18–24. doi: 10.1016/j.tox.2009.01.022. [DOI] [PubMed] [Google Scholar]
- Ricchelli F., Jori G., Gobbo S., Nikolov P., Petronill V. Int. J. Biochem. Cell Biol. 2005;37:1858–1868. doi: 10.1016/j.biocel.2005.04.001. [DOI] [PubMed] [Google Scholar]
- Halestrap A. P. J. Mol. Cell. Cardiol. 2009;46:821–831. doi: 10.1016/j.yjmcc.2009.02.021. [DOI] [PubMed] [Google Scholar]
- Halestrap A. P., Pasdois P. Biochim. Biophys. Acta. 2009;1787:1402–1415. doi: 10.1016/j.bbabio.2008.12.017. [DOI] [PubMed] [Google Scholar]
- Cecatto C., Amaral A. U., Leipnitz G., Castilho R. F., Wajner M. Neurotoxic. Res. 2014;26:168–178. doi: 10.1007/s12640-014-9460-5. [DOI] [PubMed] [Google Scholar]


