Abstract
Immune checkpoint blockade has achieved significant therapeutic success for a subset of cancer patients; however, a large portion of cancer patients do not respond. Unresponsive tumors are characterized as being immunologically “cold,” indicating that these tumors lack tumor antigen-specific primed cytotoxic T cells. Sitravatinib is a spectrum-selective tyrosine kinase inhibitor targeting TAM (TYRO3, AXL, MerTK) and split tyrosine-kinase domain–containing receptors (VEGFR and PDGFR families and KIT) plus RET and MET, targets that contribute to the immunosuppressive tumor microenvironment. We report that sitravatinib has potent antitumor activity by targeting the tumor microenvironment, resulting in innate and adaptive immune cell changes that augment immune checkpoint blockade. These results suggest that sitravatinib has the potential to combat resistance to immune checkpoint blockade and expand the number of cancer patients that are responsive to immune therapy.
Keywords: Oncology, Therapeutics
Keywords: Cancer immunotherapy, Drug therapy, Macrophages
Sitravatinib induces tumor immune landscape changes that enhance the efficacy of immune checkpoint blockade.
Introduction
Immune checkpoint (e.g., PD-L1/PD-1 or CTLA-4) inhibition has provided significant improvement for the treatment of many cancer types (1, 2). However, multiple features of the tumor microenvironment contribute to the efficacy of immune checkpoint blockade, and a large portion of cancer patients remain refractory to this important new treatment modality (3). Response to immune checkpoint blockade, especially targeting the PD-1 axis, requires a functional cancer immunity cycle that results in primed tumor antigen-specific effector T cells (4). There are multiple roadblocks in the tumor microenvironment that hinder the development of such effector T cells. A major hurdle is the function of immune-suppressive myeloid and lymphoid cells in tumors. These cells, including myeloid-derived suppressor cells (MDSCs), immune-suppressive macrophages, Tregs, and immature DCs, express multiple cell surface receptors that stimulate their recruitment into the tumor microenvironment and promote the production of immune-suppressive cytokines.
TAM (TYRO3, AXL, MerTK) receptors and other receptor tyrosine kinases containing a split tyrosine-kinase domain, such as VEGFR and PDGFR family members and KIT, are key signaling nodes that contribute to the immune-suppressive microenvironment of many tumors (5–10). For example, AXL and MerTK are expressed on immune cells, including DCs, MDSCs, and macrophages (5). The activation of TAM receptors by their ligands Gas6 and protein S in the tumor microenvironment, especially MerTK, suppresses the expression of proinflammatory cytokines and stimulates immunosuppressive cytokine production. Moreover, MerTK is also a potent direct suppressor of T cell responses (11). Split tyrosine-kinase domain–containing receptors promote proliferation of immunosuppressive cells, limit T cell infiltration into tumors, and promote T cell exhaustion (6, 12). Additionally, PDGF receptors can inhibit the maturation of DCs and induce Tregs (13). Given the proposed contribution of TAM receptors and split tyrosine-kinase domain–containing receptors to the immune landscape of tumors, we investigated the use of sitravatinib and glesatinib, which are spectrum-selective tyrosine kinase inhibitors that target TAM receptors and multiple split tyrosine-kinase domain–containing receptors.
Sitravatinib is currently under clinical testing for multiple indications, with 4 ongoing clinical studies (Clinicaltrials.gov, NCT02978859, NCT02219711, NCT02954991, and NCT03015740). A phase II clinical study in checkpoint blockade for refractory non–small cell lung cancer has provided evidence that sitravatinib can restore response to anti–PD-1 (nivolumab) with an acceptable toxicity profile (14). These results highlight the potential immune-activating effects of sitravatinib. We sought to investigate the induction of immune activity by sitravatinib and glesatinib in syngeneic murine cancer models. We found that inhibition of TAM receptor activation by the compounds reduces expression of markers associated with immune suppression in macrophages in a MerTK-dependent manner. Additionally, sitravatinib and glesatinib showed potent single-agent antitumor efficacy and enhanced the activity of PD-1 blockade through promoting an antitumor immune microenvironment.
Results
MerTK inhibition with sitravatinib directly affects macrophage phenotype.
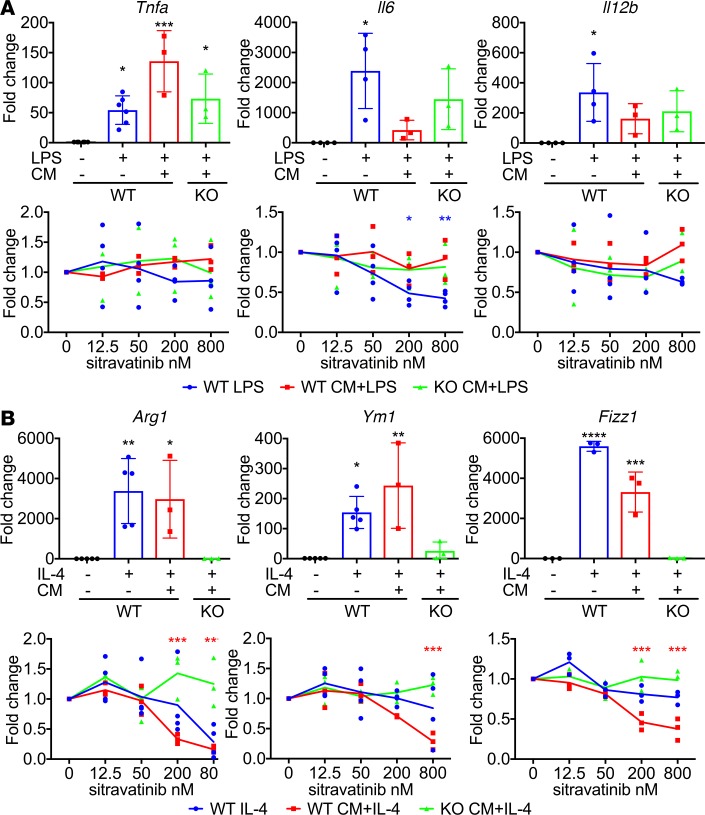
Since sitravatinib potently inhibits TAM receptors, which are important in mediating an immunosuppressive macrophage phenotype (5), we investigated the effect of sitravatinib on cytokine-stimulated polarization of primary bone marrow–derived macrophages (BMDMs). We found that sitravatinib inhibited the expression of Arg1 stimulated by IL-4 and the expression of Il-6 and Il-12 induced by LPS treatment (Figure 1). To better mimic the cytokine milieu found in tumors, we stimulated BMDMs with LPS (Figure 1A) or IL-4 (Figure 1B) in the presence of conditioned media (CM) from murine lung cancer (KLN205) cells. Treatment with sitravatinib dose-dependently inhibited the IL-4 plus CM–mediated expression of Arg1, Ym-1, and Fizz1, markers associated with an immunosuppressive macrophage phenotype, but did not affect the LPS plus CM–induced expression of Tnfα, Il-6, or Il-12, markers of an immunostimulatory macrophage phenotype (15). These data suggest that sitravatinib can prevent monocytes from polarizing into immunosuppressive macrophages in the presence of potent immune-suppressive signals. The data also demonstrate that sitravatinib did not abrogate the induction of an immunostimulatory macrophage phenotype. Similar results were obtained with glesatinib, a small molecule that targets the TAM receptors and MET (Supplemental Figure 1, A and B; supplemental material available online with this article; https://doi.org/10.1172/jci.insight.124184DS1). To define whether MerTK activity was critical for the effect of the compounds on macrophage polarization, BMDMs from MerTK-deficient (MerTK–/–) animals were subjected to the experimental conditions described above. MerTK–/– BMDMs were unaffected by sitravatinib or glesatinib, indicating that MerTK is critical to the effect of the compounds on macrophage polarization (Figure 1 and Supplemental Figure 1, A and B). These data also suggest that the presence of Gas6 or protein S is important in regulation of macrophage phenotype.
Figure 1. MerTK inhibition with sitravatinib directly affects macrophage phenotype.
The expression of M1-type macrophage markers Tnfα, Il-6, and Il-12 (A) and M2-type macrophage markers Arg1, Ym-1, and Fizz-1 (B) in bone marrow–derived macrophages (BMDMs). BMDMs were harvested from WT C57BL/6 or MerTK–/– (green) mice, stimulated with 20 ng/ml LPS for 2 hours (A) or 40 ng/ml IL-4 for 18 hours (B). Each stimulation was performed with or without sitravatinib (12.5, 50, 200, and 800 nM) in the presence (red and green) or absence (blue) of KLN205 conditioned media (CM). The expression level of TNF-α, IL-6, IL-12, arginase 1, YM-1, and Fizz-1 was determined by q-PCR. Three independent experiments using duplicate samples were performed. Data are displayed as fold change normalized to control in each condition (mean ± SD). For each marker, the top graph is the basal expression change in each stimulation condition, and the bottom graph is expression change caused by different concentrations of sitravatinib in each condition. *P < 0.05, **P < 0.01, ***P < 0.005, ****P < 0.001 vs. the control (WT macrophages without stimulation) or DMSO (0 nM) in each condition by ANOVA.
Sitravatinib has potent antitumor activity in vivo.
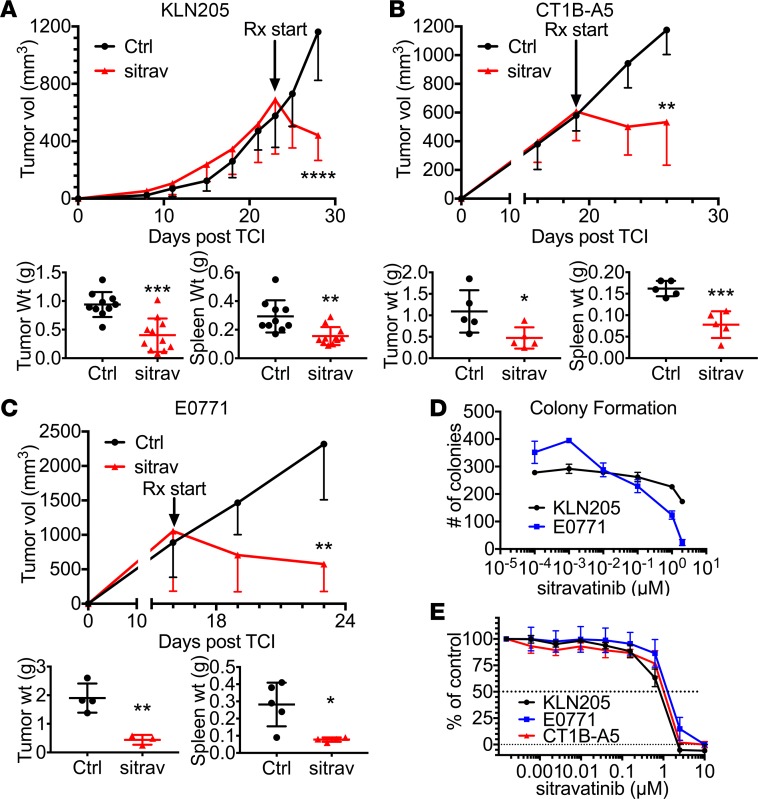
To determine the single-agent antitumor efficacy of sitravatinib, we administered the compound to immunocompetent mice bearing KLN205, CT1B-A5, or E0771 tumors (Figure 2, A–C). In each model, sitravatinib significantly inhibited tumor progression and induced tumor regression. Glesatinib also showed single-agent activity in each tumor model (Supplemental Figure 2, A–C). We observed no adverse effects of the compounds but noted that treatment with sitravatinib or glesatinib reduced tumor-induced splenomegaly, suggestive of immune modulatory activity.
Figure 2. Sitravatinib has potent antitumor activity in vivo.
(A–C) In vivo assessment of treatment response of subcutaneously or orthotopically implanted tumors. We injected 0.5 × 10⁶ KLN205 cells (A, n = 11/group) subcutaneously into 6-week-old DBA/2 mice, 1 × 10⁶ CT1B-A5 cells (B, n = 5/group) subcutaneously into 6-week-old C57BL/6 mice, and 0.5 × 10⁶ E0771 cells (C, n = 5/group) orthotopically into the mammary fat pads of 6-week-old female C57BL/6 mice. Mice with established tumors (500–700 mm3) were treated with control (Ctrl, vehicle, once per day) or sitravatinib (sitrav, p.o. 20 mg/kg, once per day). Effects on tumor growth are shown after 6 days of treatment. Tumor and spleen weight were determined in each mouse (mean ± SD). *P < 0.05, **P < 0.01, ***P < 0.005, ****P < 0.001 vs. control by t test. (D) Colony formation for KLN205 and E0771 cell lines grown in normal growth performed with or without sitravatinib at the indicated doses for 14 days. Two independent experiments using triplicate samples were performed. Mean ± SD colonies/hpf are shown. (E) Cell growth assays were performed in a 96-well format for 5 days using MTS. Three independent experiments using two 96-well plates/cell line were performed. Drug-sensitivity curves are displayed.
To demonstrate the effect of the compounds on tumor cell viability, we performed in vitro colony-forming and MTS viability assays. Each compound reduced colony formation in a dose-dependent manner (Figure 2D and Supplemental Figure 2D) and inhibited tumor cell viability with an IC50 of approximately 1 μM (Figure 2E and Supplemental Figure 2E), a concentration considerably higher than the predicted plasma concentration of sitravatinib (10 nM) after dosing at 20 mg/kg (Supplemental Table 1). These data suggest that the potent antitumor activity observed was unlikely due solely to direct tumor cell killing but related to microenvironmental changes induced by sitravatinib.
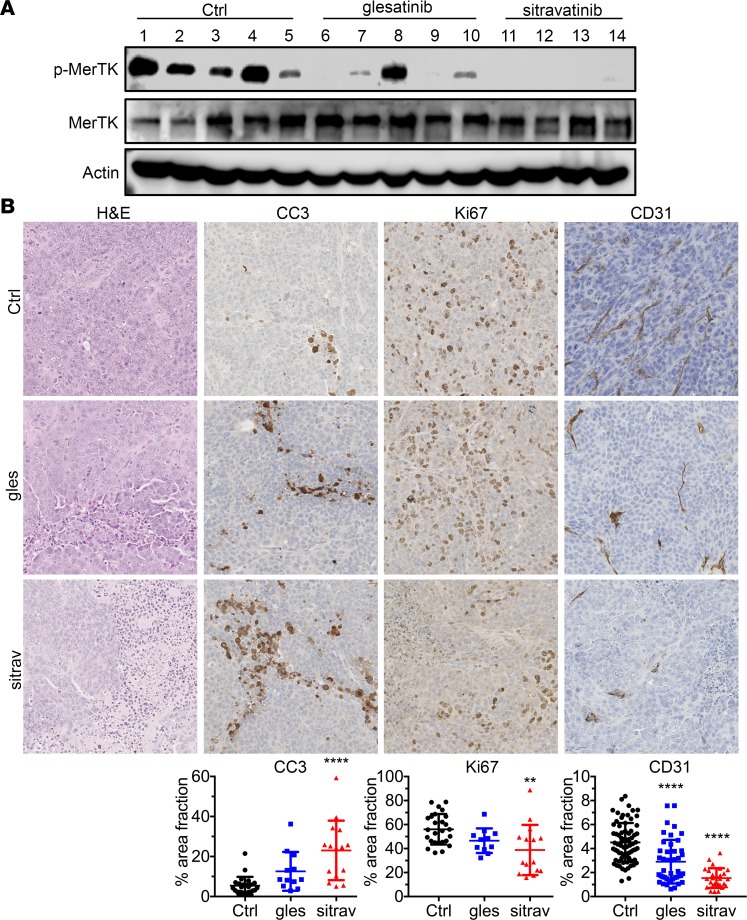
To determine the effect of the compounds on MerTK activity in vivo, we probed lysates from treated KLN205 tumors for active MerTK and found that both compounds suppressed MerTK phosphorylation (Figure 3A; see complete unedited blots in the supplemental material), with sitravatinib showing a stronger effect. Histologic analysis of KLN205 tumors demonstrated that sitravatinib-treated tumors showed increased necrosis, elevated cleaved caspase-3 (CC3), decreased Ki67 expression, and reduced microvessel density (CD31), while tumor cell death induced by glesatinib was less substantial and it did not reduce microvessel density (Figure 3B). These results suggest both compounds target critical pathways in the tumor microenvironment that support tumor progression.
Figure 3. Sitravatinib potently inhibits MerTK activity and reduces angiogenesis.
(A) Lysates of tumors from KLN205 tumor-bearing animals treated with control (Ctrl), sitravatinib, or glesatinib were probed for the indicated targets by Western blotting. (B) KLN205 tumor–bearing animals treated with control, sitravatinib (sitra), or glesatinib (gles) were evaluated by immunohistochemistry for the expression level of the indicated markers. Images were taken by Nanozoomer and analyzed using ImageJ. Quantification of percentage of the area analyzed positive for staining (% area fraction) is shown. Data are displayed as mean ± SD and represent images covering the whole tumor, with 4–5 animals per group analyzed. Original magnification, ×20. **P < 0.01, ****P < 0.001 vs. control by ANOVA.
Sitravatinib alters the immune landscape of KLN205 tumors to favor immune checkpoint blockade.
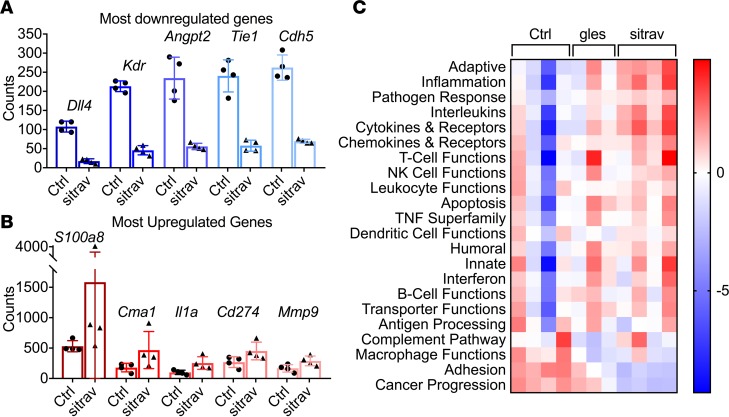
Given the potent antitumor activity of sitravatinib and the fact that TAM receptors contribute to the immune microenvironment in tumors, we performed gene expression analysis (NanoString Technologies) using tumor tissue collected from mice bearing KLN205 tumors treated with control, glesatinib, or sitravatinib. Compared with those treated with glesatinib, we found that sitravatinib-treated tumors had more significant gene set changes. Multiple genes associated with angiogenesis were among the most downregulated in sitravatinib-treated tumors, consistent with its blockade of VEGFR family RTKs, while inflammatory genes were among the highest upregulated in treated tumors (Figure 4, A and B). Interestingly, the expression of Pd-l1 (Cd274) was elevated by glesatinib and sitravatinib, suggesting that the compounds may enhance response to immune checkpoint blockade (16). This is supported by analysis of gene program/pathways that were altered by sitravatinib, which included multiple pathways associated with innate and adaptive immune response (Figure 4C).
Figure 4. Transcriptome analysis of the immune landscape of KLN205 tumors treated with sitravatinib.
RNA was isolated from KLN205 tumors treated for 6 days with sitravatinib (sitra) or glesatinib (gles) and was analyzed using a preassembled nCounter PanCancer Immune Profiling Panel (mouse) and the nCounter system (NanoString Technologies). Samples were then normalized based on the geometric means of the supplied positive controls and the panel of housekeeping genes, as recommended by the manufacturer. Only genes that were significantly different (P < 0.05; t test, false discover rate adjusted) and at least 1.5-fold differentially expressed between groups were considered. The most downregulated (A) and upregulated genes (B) from the gene expression analysis (NanoString Technologies) were displayed (mean ± SD). (C) Upregulated and downregulated gene program/pathways.
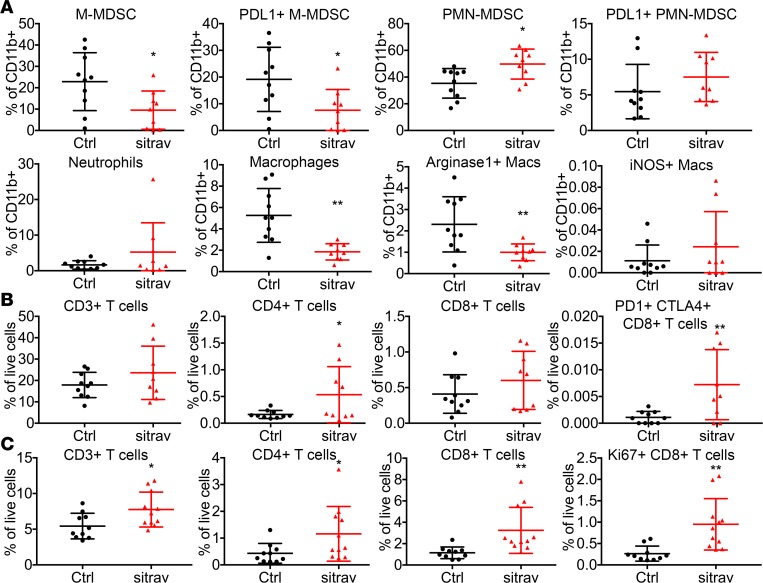
To further investigate the effect of sitravatinib on the immune landscape of KLN205 tumors, flow cytometry was performed on tumors and spleens from mice treated for 6 days (Figure 5). Sitravatinib significantly reduced the number of tumor-associated immunosuppressive myeloid cells, including monocytic MDSCs and M2 macrophages. Sitravatinib also increased the number of CD4+ T cells and exhausted CD8+ T cells characterized by PD-1 and CTLA-4 expression. In comparison, we found that spleens from sitravatinib-treated mice had an increase in CD4+ T cells and proliferating CD8+ T cells. The immune cell changes in the tumors and the spleen suggested that sitravatinib might enhance the effect of PD-1 blockade. Although glesatinib had similar trends (Supplemental Figure 3, A–C), the immune cell changes were not as significant as seen with sitravatinib. These results might be explained by the less potent activity of glesatinib against MerTK or through contribution of other distinct sitravatinib RTK targets.
Figure 5. Sitravatinib alters the immune landscape of KLN205 tumors to favor immune checkpoint blockade.
Flow cytometry of tumor-associated myeloid (A) and lymphoid cells (B) from mice bearing KLN205 tumors treated for 6 days with sitravatinib (sitra, n = 9–10/group). Monocytic myeloid-derived suppressor cells (M-MDSCs; CD11b+Ly6G–Ly6C+), PD-L1+ M-MDSCs, polymorphonuclear myeloid-derived suppressor cells (PMN-MDSCs; CD11b+Ly6G+Ly6C+), PD-L1+ PMN-MDSC, neutrophils (CD11b+Ly6G+Ly6C–), macrophages (CD11b+Ly6G–Ly6C–F4/80+CD11c+MHCII+), Arg1+ macrophages (Macs), iNOS+ macrophages, CD3+ T cells, CD4+ T cells, CD8+ T cells, and PD-1+CTLA4+CD8+ T cells were analyzed. *P < 0.05, **P < 0.01 vs. control (Ctrl) by t test. (C) Flow cytometry of splenocytes from mice bearing KLN205 tumors treated with sitravatinib for 6 days (n = 9–10/group). CD3+ T cells, CD4+ T cells, CD8+ T cells, and Ki67+ CD8+ T cells were analyzed. *P < 0.05, **P < 0.01 vs. control by t test.
Sitravatinib enhances the efficacy of PD-1 blockade.
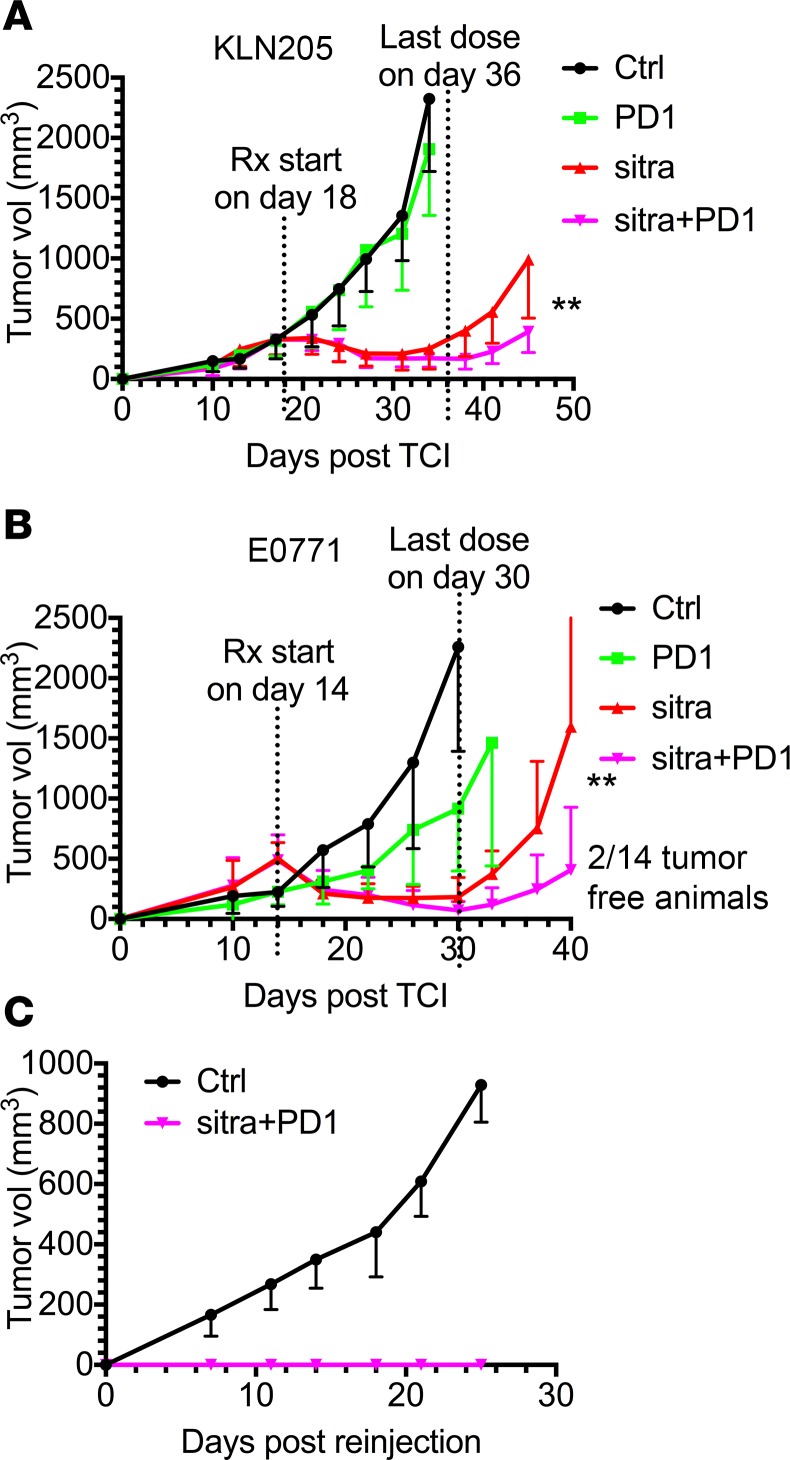
To test the combinatorial effect of sitravatinib and PD-1 blockade, we treated cohorts of KLN205 or E0771 tumor-bearing mice with the compound with or without anti–PD-1. Mice were treated for 2.5 weeks in each model. Sitravatinib significantly enhanced the efficacy of PD-1 blockade (Figure 6, A and B). Glesatinib treatment also enhanced the efficacy of anti–PD-1 therapy (Supplemental Figure 4, A and B) but was less potent that sitravatinib. In fact, 2 of 14 mice bearing E0771 tumors treated with anti–PD-1 plus sitravatinib showed complete remission and stayed tumor free for 50 days. To test whether these 2 animals developed an adaptive antitumor response with immune memory, we rechallenged the animals by implanting E0771 cells in the mammary fat pad (on the opposite side from the original injection). Control mice were also implanted with E0771 cells and showed robust and predictable tumor formation and growth. However, the 2 animals that showed complete response to sitravatinib and anti–PD-1 failed to grow E0771 tumors upon rechallenge (Figure 6C).
Figure 6. Sitravatinib enhances the efficacy of PD-1 blockade.
(A and B) In vivo assessment of treatment response of subcutaneously or orthotopically implanted tumors (n = 12–14/group) in combination with PD-1 blockade. We injected 0.5 × 10⁶ KLN205 cells (A) subcutaneously into 6-week-old DBA/2 mice, and 0.5 × 10⁶ E0771 cells (B) were injected orthotopically into the mammary fat pads of 6-week-old female C57BL/6 mice. Therapy was initiated in mice with a tumor volume of 300 mm3 (KLN205) or 500 mm3 (E0771) and included control (Ctrl, vehicle, once per day), anti–PD-1 (PD-1, i.p. 10 mg/kg, every 3 days), sitravatinib (sitra, p.o. 20 mg/kg, once per day), or anti–PD-1 in combination with sitravatinib at the indicated dose. Mice were treated for 2.5 weeks. **P < 0.01 anti–PD-1 in combination with sitravatinib vs. sitravatinib alone by t test. Two of fourteen mice bearing E0771 tumors treated with the combination therapy showed complete remission and stayed tumor free for 50 days. (C) Rechallenge growth curve of the 2 tumor-free animals from B. We injected 0.5 × 10⁶ E0771 cells orthotopically into the mammary fat pads of 6-week-old female C57BL/6 mice (Ctrl, n = 4) and on the contralateral side from the original injection of the 2 tumor-free animals.
Discussion
Our study has found that sitravatinib and glesatinib have potent single-agent antitumor activity; moreover, sitravatinib can alter the immune landscape of tumors to favor immune checkpoint blockade. In 3 different preclinical tumor models, including KLN205, an aggressive lung cancer model that is resistant to checkpoint blockade, the tumor response to sitravatinib and glesatinib was rapid and consistent (Figure 2, A–C, and Supplemental Figure 2, A–C). Consistently, sitravatinib was also found to have potent antitumor activity in preclinical models of sarcoma (17).
Our in vitro studies demonstrate that each compound has direct antitumor cell effects, albeit at markedly higher concentrations than required for in vivo efficacy. The major targets of each compound are pathways associated with microenvironmental features of tumors, and the predicted in vivo concentration of the compounds is substantially below the observed in vitro IC50 values. We therefore propose that the potent antitumor activity of each compound is largely due to the effect of sitravatinib and glesatinib on the tumor microenvironment. Therapies against some of these targets, for example, angiogenesis, have been explored for decades with limited success in solid tumors (18). A major unmet challenge with the use of targeted therapeutic agents is the propensity of tumor cells to activate alternative pathways that lead to therapeutic resistance. Sitravatinib and glesatinib have a relatively broad spectrum of targets that are inhibited at pharmacologically achievable doses. It is possible that inhibition of multiple aspects of the tumor microenvironment reduces the chance of resistance-derived inhibition of a single but important biologic process.
What may distinguish sitravatinib and glesatinib relative to other multireceptor tyrosine kinases is their activity against the TAM receptors. Of the multireceptor tyrosine kinase inhibitors in active clinical development, sitravatinib and glesatinib are arguably the most effective TAM receptor inhibitors currently available. We propose that the inhibition of TAM receptors enables the compounds to alter the immune landscape. This is the first report to our knowledge of the effect of sitravatinib and glesatinib on the immunosuppressive tumor microenvironment, as evidenced in vitro by observations using primary BMDMs, in vivo through gene expression and flow cytometry, and functionally through the potentiation of immune checkpoint blockade. Since resistance to immune therapy remains an unmet challenge in the treatment of many cancers, these compounds may offer therapeutic benefit that improves response to immune checkpoint blockade.
Methods
Cell lines.
KLN205, a murine lung cancer cell line, was obtained from ATCC (CRL-1453), and E0771, a murine breast cancer cell line, was a gift from Philip Thorpe (University of Texas Southwestern Medical Center). CT1B-A5, an isogenic pancreatic cancer cell line, was derived from KPfC (KrasLSL-G12D; Trp53fl/fl; PDX Cre/+) mice. Cells were cultured in DMEM (Invitrogen) or RPMI (Invitrogen) containing 5% FBS and maintained at 37°C in a humidified incubator with 5% CO2 and 95% air and confirmed to be pathogen free before use.
Animal studies.
KLN205 cells (0.5 × 10⁶) were injected subcutaneously into 6-week-old DBA/2 mice, CT1B-A5 cells (1 × 10⁶) were injected subcutaneously into 6-week-old C57BL/6 mice, and E0771 cells (0.5 × 10⁶) were injected orthotopically into the mammary fat pad of 6-week-old female C57BL/6 mice. Tumor volumes were measured twice weekly using a digital caliper, and volumes were calculated using the formula: V = (a × b2)/2, where a is the largest dimension and b is the smallest dimension. For endpoint studies, mice with established tumors (500–700 mm3) were treated with control (vehicle, once per day), sitravatinib (MGCD516, p.o. 20 mg/kg, once per day), glesatinib (MGCD265, p.o. 60 mg/kg, once per day), anti–PD-1 (i.p. 10 mg/kg, every 3 days), or anti–PD-1 in combination with sitravatinib or glesatinib at the indicated doses. Mice were sacrificed after 6 days of therapy, within 6 hours of the final treatment. Tissue was fixed in 10% formalin or snap frozen in liquid nitrogen for further studies or prepared for flow cytometry analysis. For survival studies, mice with a tumor volume of 300 mm3 (KLN205) or 500 mm3 (E0771) were selected and allocated into treatment groups defined above. Mice were treated for 2.5 weeks and therapy was withdrawn. Mice were monitored daily for health and sacrificed if they showed signs of morbidity.
Real-time quantitative PCR.
BMDMs were harvested from WT C57BL/6 or MerTK–/– mice using standard techniques (19). To determine if glesatinib and sitravatinib alter the expression of markers of macrophage polarization, BMDMs were stimulated for 2 hours with 20 ng/ml LPS or 18 hours with 40 ng/ml IL-4, immune stimulatory or immune-suppressive signals, respectively, and different concentrations of sitravatinib or glesatinib in the presence or absence of CM collected from KLN205 cells. RNA was extracted using Qiagen RNeasy Mini Kit (74106), cDNA was synthesized using a Bio-Rad iScript cDNA synthesis kit. The expression of TNF-α, IL-6, IL-12, arginase 1, YM-1, and Fizz-1 was measured by SYBR-Green dependent q-PCR (Supplemental Table 2). Three independent experiments were performed. Duplicates were run in each experiment.
MTS assay.
The MTS colorimetric assay (Promega) was performed as per the manufacturer’s instructions. This assay is based on the conversion of MTS into soluble formazan by endogenous dehydrogenase enzymes found in metabolically active cells. Cells were plated at 2,000 cells/well in tissue culture–treated 96-well plates. The following day, sitravatinib or glesatinib was added to each plate in a dilution series across the plate, such that 8 different concentrations of the drug were tested. On day 5, 20 μl MTS was added, followed by a 2-hour incubation at 37°C, and then the absorbance was read at 490 nm on a plate reader. The 96-well plate data were imported into an in-house database of in vitro drug sensitivity assays (DIVSA); IC50 values were calculated using the DRC model (R package “drc”; http://www.bioassay.dk).
Liquid colony-forming assay.
Cell lines were cultured in 6-well tissue culture plates at low density (200 cells/well for E0771 and 500 cells/well for KLN205) in 2 ml media. Cells were plated in respective culture conditions and allowed to settle for 1 week or until marked colony formation. Cells were then fixed with 10% formalin and stained with crystal violet. Images were analyzed with ImageJ (NIH) or NIS Elements.
Western blot analysis.
KLN205 tumor tissues from mice treated for 9 days were lysed using RIPA buffer (Cell Signaling, 9806), supernatants were recovered by centrifugation, protein concentration was measured using a Pierce BCA Protein Assay Kit (Thermo Fisher Scientific, 23225), and equal amounts of total protein were separated by SDS-PAGE. Proteins were transferred to nitrocellulose membranes (Bio-Rad), followed by a blocking in 5% BSA in TBST. The membranes were incubated overnight at 4°C with primary antibody, p-MerTK (Novus Biologicals, NB300-690), MerTK (R&D Systems, AF591), Actin (MilliporeSigma, A2066), Axl (Santa Cruz, sc-1096), and PDGFRα (Cell Signaling, 3174), followed by corresponding horseradish peroxidase–conjugated secondary antibody (Jackson ImmunoResearch). Specific bands were detected by using WesternSure PREMIUM chemiluminescent substrate (Li-Cor) on a Li-Cor imaging system (Odyssey-Fc).
Histology and tissue analysis.
Formalin-fixed tissues were embedded in paraffin and cut into 5-μm sections. Sections were evaluated by H&E and immunohistochemical analysis using antibodies specific for CD31 (Cell Signaling, 77699), Ki67 (Abcam, 15580), and cleaved caspase-3 (Cell Signaling, 9664). Negative controls included omission of primary antibody. Color images were obtained with a Nikon Eclipse E600 microscope using a Niko Digital Dx1200me camera and ACT1 software (Universal Imaging Corporation). Pictures were analyzed using NIS Elements (Nikon).
Nanostring analysis.
KLN205 tumor tissues from mice after 6 days of treatment were lysed in RLT lysis buffer and purified according to the manufacturer’s instructions (QIAGEN). RNA was sent to the Genomic and RNA Profiling Core in Baylor College of Medicine and analyzed using a preassembled nCounter PanCancer Immune Profiling Panel (mouse) and the nCounter system (NanoString Technologies) according to the manufacturer’s instructions. Samples were then normalized based on the geometric means of the supplied positive controls and the panel of housekeeping genes, as recommended by the manufacturer. Only genes that were significantly different (P < 0.05; t test, false discover rate adjusted) and at least 1.5-fold differentially expressed between groups were considered.
Flow cytometry analysis.
Tumors were digested with a cocktail containing collagenase I (45 μ/ml; Worthington), collagenase II (15 μ/ml; Worthington), collagenase III (45 μ/ml; Worthington), collagenase IV (45 μ/ml; Worthington), elastase (0.075 μ/ml; Worthington), hyaluronidase (30 μ/ml; MilliporeSigma), and DNase type I (25 μ/ml; MilliporeSigma) for 40 minutes at 37°C and passed through a 70-μm cell strainer (Falcon). Splenocytes were isolated from spleens and passed through a 70-μm cell strainer (Falcon). Suspensions were washed twice with PBS and stained with Fixable Viability Dye (Thermo Fisher) for 1 hour. The cell suspensions were then washed and stained with antibodies detecting CD11b (BD Bioscience, 557657), Ly-6C (BD Bioscience, 562728), Ly-6G (BD Bioscience, 740953), F4/80 (Biolegend, 123132), CD274 (PD-L1, BD Bioscience, 563369), CD11c (BD Bioscience, 564079), I-A/I-E (BD Bioscience, 562009), CD3 (BD Bioscience, 553061), CD4 (BD Bioscience, 562891), CD8 (BD Bioscience, 563332), CD279 (PD-1, BD Bioscience, 563059), CD152 (CTLA-4, BD Bioscience, 565778), and CD25 (IL-2 receptor α, BD Bioscience, 562694) for 1 hour at 4°C. Surface-stained cells were fixed, permeabilized, and stained for intracellular markers arginase 1 (R&D Systems, IC5868P), iNOS (Thermo Fisher, 17-5920-82), FoxP3 (BD Bioscience, 560401), and Ki67 (Biolegend, 652404). Cells were analyzed using FACS LSRFortessa SORP, and analysis was performed using FlowJo, with the help of the Moody Foundation flow cytometry facility at University of Texas Southwestern Medical Center.
Pharmacokinetic analysis.
Athymic mice were dosed with sitravatinib at 10 or 20 mg/kg by oral gavage once per day for 4 or 14 consecutive days. Blood samples were collected before dosing and at 1, 4, 6, 10, 16, and 24 hours after dosing in Na citrate tubes and centrifuged and plasma was harvested and stored at –80 degrees. Plasma samples were analyzed for levels of sitravatinib using an Agilent 1200 HPLC system coupled with an MDS Sciex API3200 triple quadrupole mass spectrometer at MethylGene. The processed sample (5–10 μl) was injected onto a Thermoaquasil C18 (4 mm × 50 mm, 3 μm). An isocratic elution with the mobile phase A/B (0.5% formic acid, 10 mM ammonium formate in water, 0.5 % formic acid, 10 mM ammonium in 10:90 MeOH/acetonitrile) at 40:60 was used. The flow rate was set at 1 ml/min. Sitravatinib was eluted at 1.26 minutes. The total run time was 5 minutes. Positive electrospray ionization mode was used. Sitravatinib was monitored at the MRM transition of m/z 629.9 → m/z 554.9. The HPLC-MS/MS system control and quantitation were carried out using the Analyste(R) 1.4 software.
Statistics.
Data are reported as mean ± SD. Statistical analysis was performed with a 2-tailed t test or ANOVA using GraphPad Prism software (version 4.00 for Windows). For all analyses, P < 0.05 was considered statistically significant.
Study approval.
Animal experiments in this study were approved by and performed in accordance with the Institutional Animal Care and Use Committee at the University of Texas Southwestern Medical Center at Dallas.
Author contributions
RAB, WD, and HH designed the studies; WD, HH, and NS conducted experiments and acquired data; WD, HH, NS, and RAB analyzed data; WD and HH wrote the manuscript; and RAB edited the manuscript.
Supplementary Material
Acknowledgments
This study was supported by Mirati Therapeutics, grants from the NIH (R01 CA192381 and U54 CA210181 Project 2), and the Effie Marie Cain Scholarship in Angiogenesis Research to RAB. The authors would like to thank members of the Brekken lab for helpful discussions and Dave Primm for editorial support. The authors thank Christian Ritz and Jens Streibig for the DRC model (R package “drc”).
Version 1. 11/02/2018
Electronic publication
Footnotes
Conflict of interest: RAB received research support from Mirati Therapeutics.
License: Copyright 2018, American Society for Clinical Investigation.
Reference information: JCI Insight. 2018;3(21):e124184. https://doi.org/10.1172/jci.insight.124184.
Contributor Information
Wenting Du, Email: wenting.du@utsouthwestern.edu.
Huocong Huang, Email: huocong.huang@utsouthwestern.edu.
Noah Sorrelle, Email: noah.sorrelle@utsouthwestern.edu.
References
- 1.Postow MA, Callahan MK, Wolchok JD. Immune checkpoint blockade in cancer therapy. J Clin Oncol. 2015;33(17):1974–1982. doi: 10.1200/JCO.2014.59.4358. [DOI] [PMC free article] [PubMed] [Google Scholar]
- 2.Topalian SL, Drake CG, Pardoll DM. Immune checkpoint blockade: a common denominator approach to cancer therapy. Cancer Cell. 2015;27(4):450–461. doi: 10.1016/j.ccell.2015.03.001. [DOI] [PMC free article] [PubMed] [Google Scholar]
- 3.Pitt JM, et al. Resistance mechanisms to immune-checkpoint blockade in cancer: tumor-intrinsic and -extrinsic factors. Immunity. 2016;44(6):1255–1269. doi: 10.1016/j.immuni.2016.06.001. [DOI] [PubMed] [Google Scholar]
- 4.Chen DS, Mellman I. Oncology meets immunology: the cancer-immunity cycle. Immunity. 2013;39(1):1–10. doi: 10.1016/j.immuni.2013.07.012. [DOI] [PubMed] [Google Scholar]
- 5.Paolino M, Penninger JM. The role of TAM family receptors in immune cell function: implications for cancer therapy. Cancers (Basel) 2016;8(10) doi: 10.3390/cancers8100097. [DOI] [PMC free article] [PubMed] [Google Scholar]
- 6.Lapeyre-Prost A, et al. Immunomodulatory activity of VEGF in cancer. Int Rev Cell Mol Biol. 2017;330:295–342. doi: 10.1016/bs.ircmb.2016.09.007. [DOI] [PubMed] [Google Scholar]
- 7.Daynes RA, Dowell T, Araneo BA. Platelet-derived growth factor is a potent biologic response modifier of T cells. J Exp Med. 1991;174(6):1323–1333. doi: 10.1084/jem.174.6.1323. [DOI] [PMC free article] [PubMed] [Google Scholar]
- 8.Lemmon MA, Schlessinger J. Cell signaling by receptor tyrosine kinases. Cell. 2010;141(7):1117–1134. doi: 10.1016/j.cell.2010.06.011. [DOI] [PMC free article] [PubMed] [Google Scholar]
- 9.Du W, Brekken RA. Does Axl have potential as a therapeutic target in pancreatic cancer? Expert Opin Ther Targets. 2018:1–12. doi: 10.1080/14728222.2018.1527315. [DOI] [PMC free article] [PubMed] [Google Scholar]
- 10.Ludwig KF, et al. Small-molecule inhibition of Axl targets tumor immune suppression and enhances chemotherapy in pancreatic cancer. Cancer Res. 2018;78(1):246–255. doi: 10.1158/0008-5472.CAN-17-1973. [DOI] [PMC free article] [PubMed] [Google Scholar]
- 11.Cabezón R, et al. MERTK as negative regulator of human T cell activation. J Leukoc Biol. 2015;97(4):751–760. doi: 10.1189/jlb.3A0714-334R. [DOI] [PMC free article] [PubMed] [Google Scholar]
- 12.Ray P, Krishnamoorthy N, Oriss TB, Ray A. Signaling of c-kit in dendritic cells influences adaptive immunity. Ann N Y Acad Sci. 2010;1183:104–122. doi: 10.1111/j.1749-6632.2009.05122.x. [DOI] [PMC free article] [PubMed] [Google Scholar]
- 13.Agrawal S, Ganguly S, Hajian P, Cao JN, Agrawal A. PDGF upregulates CLEC-2 to induce T regulatory cells. Oncotarget. 2015;6(30):28621–28632. doi: 10.18632/oncotarget.5765. [DOI] [PMC free article] [PubMed] [Google Scholar]
- 14.Leal T, et al. MA 02.01 Evidence of clinical activity of sitravatinib in combination with nivolumab in NSCLC patients progressing on prior checkpoint inhibitors. J Thorac Oncol. 2017;12(11):S1803 [Google Scholar]
- 15.Sica A, et al. Macrophage polarization in tumour progression. Semin Cancer Biol. 2008;18(5):349–355. doi: 10.1016/j.semcancer.2008.03.004. [DOI] [PubMed] [Google Scholar]
- 16.Maleki Vareki S, Garrigós C, Duran I. Biomarkers of response to PD-1/PD-L1 inhibition. Crit Rev Oncol Hematol. 2017;116:116–124. doi: 10.1016/j.critrevonc.2017.06.001. [DOI] [PubMed] [Google Scholar]
- 17.Patwardhan PP, Ivy KS, Musi E, de Stanchina E, Schwartz GK. Significant blockade of multiple receptor tyrosine kinases by MGCD516 (Sitravatinib), a novel small molecule inhibitor, shows potent anti-tumor activity in preclinical models of sarcoma. Oncotarget. 2016;7(4):4093–4109. doi: 10.18632/oncotarget.6547. [DOI] [PMC free article] [PubMed] [Google Scholar]
- 18.Bergers G, Hanahan D. Modes of resistance to anti-angiogenic therapy. Nat Rev Cancer. 2008;8(8):592–603. doi: 10.1038/nrc2442. [DOI] [PMC free article] [PubMed] [Google Scholar]
- 19.Manzanero S. Generation of mouse bone marrow-derived macrophages. Methods Mol Biol. 2012;844:177–181. doi: 10.1007/978-1-61779-527-5_12. [DOI] [PubMed] [Google Scholar]
Associated Data
This section collects any data citations, data availability statements, or supplementary materials included in this article.


