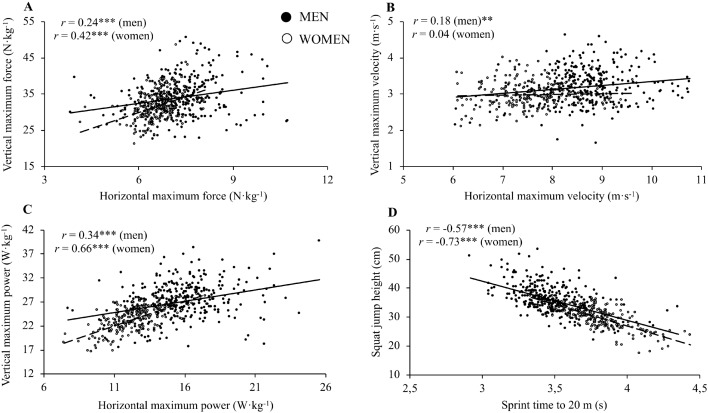
Figure 2. Association between the same force–velocity relationship parameters and performance variables obtained from the jumping and sprinting testing procedures in men (straight line; filled dot) and women (dashed line; empty dot) ((A) force; (B) velocity; (C) maximum power; (D) performance parameters) r, Pearson’s correlation coefficient.
Significant correlations: **P < 0.01, ***P < 0.001.

