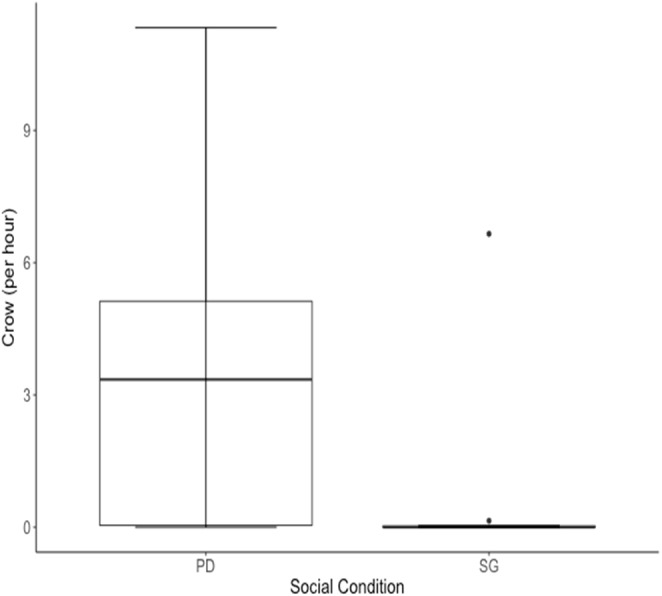
Figure 5. Median rate of crows per hour for 10 males of cohort I was higher when males were housed in the Perceived Dominance (PD) condition then when housed in the Social Group (SG) condition.

The black horizontal line represents the median value. Whiskers represent the lower and upper quartiles (25% and 75%).
