Abstract
Dynamic light scattering optical coherence microscopy (DLS-OCM) integrates DLS, which measures diffusion or flow of particles by analyzing fluctuations in light scattered by the particles, and OCM, which achieves single-cell resolution by combining coherence and confocal gating, integratively enabling cellular-resolution 3D mapping of the diffusion coefficient, and flow velocity. The diffusion coefficient mapping has a potential for the non-destructive measurement of cellular viability in the standard unit but has not been validated yet. Here, we present DLS-OCM imaging of intra-cellular motility (ICM) as a surrogate of cellular viability. For this purpose, we have simultaneously obtained and compared ICM-contrast DLS-OCM images and calcium fluorescence-contrast images of retinal ganglion cells, and then characterized the responses of the measured ICM to a change in cellular viability induced by environmental conditions such as temperature and pH. The diffusion-coefficient-represented ICM exhibits consistent changes with the manipulated cellular viability.
1. Introduction
A cell is the smallest unit of life in structure and function. It consists of a membrane layer which encloses the cytoplasm, wherein various intracellular organelles are found. In a viable cell, intracellular organelles exhibit metabolic reactions normally to maintain life. The concept of cellular viability plays a critical role in a wide range of studies using cell assays on the effect of drug treatment as well as cytotoxicity tests of chemicals on cells [1–3]. The cellular metabolic reactions are also associated with mechanical and active movements of intracellular organelles consuming adenosine triphosphate (ATP) energy, which leaves diffusion-like trajectories.
Based on these characteristics, the intracellular organelle movement (often called intra-cellular motility; ICM) has been utilized to estimate the cellular viability. Labeling organelles with fluorescent dyes were amongst the first techniques to measure ICM [4–11]. These techniques typically utilize fluorescent ligands that bind to the target organelle and detect the fluorescent probes with various optical methods. These label-based methods have been advanced from directly tracing the particles to quantifying other useful properties such as applied force. For example, endogenous cytoskeletal microtubules were used as probes to directly measure the applied force, where the microtubules’ amplitude was useful due to its local bending motion [12]. However, these methods are invasive in nature, posing several problems such as phototoxicity or photobleaching, eventually making samples be in a non-viable condition. To overcome such limitations, methods which do not include dyes have been advanced to enable label-free measurements of ICM. By analyzing light scattered from cells, quantities such as frequency fluctuations and mean square displacement have been suggested to represent intracellular movements [13–18]. Recently, optical coherence tomography (OCT) was tested to detect ICM via the signal fluctuation amplitude, autocorrelation decay time [21], signal contrast [22], and decorrelation [23].
Label-free measurement of ICM has a potential to enable non-destructive assessment of cellular viability without any chemical injection or genetic manipulation and thereby facilitating longitudinal studies of drug effects or environmental cytotoxicity. The potential, however, has not been fully realized; previous label-free methods mostly measured ICM in an arbitrary unit such as the decorrelation of OCT signals [23,24], which is less suitable for quantitative comparison across different samples or systems than a standard unit-represented measurement, and/or have not sufficiently shown that the measured ICM indeed represents the cellular viability by testing if it varies with a change in viability [19,20,25–27]. Previously, we used dynamic light scattering optical coherence tomography (DLS-OCT) [19] and found that neurons exhibit high diffusion coefficients [20], but have not tested if they vary with viability changes. Here, we present label-free, cellular-resolution measurement of ICM in the standard unit of diffusion coefficient and demonstrate that it correlates with and thus represents the cellular viability. For this purpose, we used DLS-OCM that enables us to produce a micrometer-resolution, three-dimensional map of the diffusion coefficient, optimized the method to match its dynamic range with the typical range of ICM, tested if the diffusion coefficient map can visualize cells based on the contrast of ICM by comparing it with simultaneously-imaged intracellular calcium fluorescence, and then investigated how the measured ICM varies with a change in the cellular viability induced by altering conditions with well-known effects such as temperature and pH. We expect that the DLS-OCM assessment of cellular viability in the standard unit will be widely utilized in various studies from drug and toxin tests using human tissue spheroids to longitudinal disease development researches using animal models.
2. Methods
2.1. Simultaneous OCM and fluorescence imaging
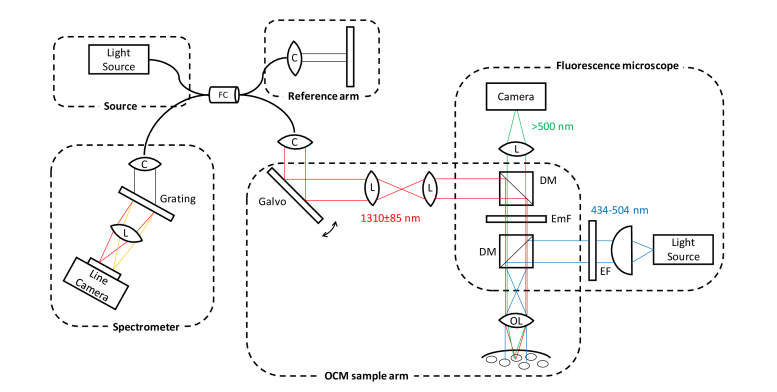
A commercial spectral-domain (SD) OCT system (Thorlabs, Newton, NJ, USA) was used and modified for this study. The system uses a large-bandwidth near-infrared light source with a center wavelength of 1310 nm and a wavelength bandwidth of 170 nm, which leads to high axial resolution (3.5 μm). 40x objective lens (1-U2M587, Olympus America, Inc) was used for cellular imaging with the lateral resolution of 0.78 μm. The system uses a high-speed 2048-pixel line-scan camera to achieve 147,000 A-scan/s with a relatively large imaging depth (2.5 mm maximum). The field of view (FOV) has 256 (X) × 256 (Y) × 1024 (Z) voxels with the transverse and axial sampling rates of 0.5 μm and 3.46 μm, respectively, leading to 128 μm × 128 μm × 3.54 mm imaging volume. Due to the high numerical aperture, the effective depth of field was ~15 μm (twice of the Rayleigh length). To compare label-free DLS-OCM images to one of the current standards for cellular imaging, GCaMP3 fluorescence imaging that needs no exogenous calcium dye [28], we built a wide-field fluorescence microscope and combined it to the OCM system, as shown in Fig. 1. Blue light with nominal wavelength of 490 nm from the light emitting diode (LED) and driver (M490L4 and LEDD1B, Thorlabs) travels through a diffuser (ACL2520UDG6, Aspheric Condenser Lens, Thorlabs), an excitation filter (MF469-35, GFP Excitation Filter, Thorlabs), and a dichroic beamsplitter (69-899, Dichroic Longpass Filter, Edmund Optics) to a sample. Green fluorescence light (typically 500-540 nm in wavelength [28]) emitted from the sample travels through the beamsplitter and emission filter (FELH0500, Premium Longpass Filter, Thorlabs) to a camera (OCTG-1300, Thorlabs). Images were acquired and displayed in real time on a computer using custom-built LabVIEW software. The specific excitation and emission wavelength ranges were chosen to enable simultaneous OCT and fluorescence imaging while minimizing crosstalk.
Fig. 1.
The schematic of the experimental system for simultaneous OCM and fluorescence imaging. (FC: fiber coupler, C: collimator, L: Lens, EmF: Emission filter, DM: Dichroic mirror, OL: objective lens, EF: Excitation filter).
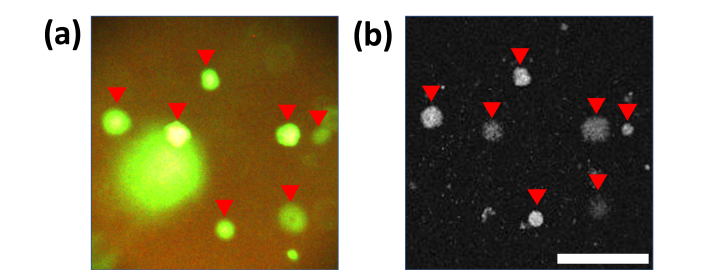
We aligned OCM and fluorescence microscope using fluorescent microspheres (17151-10, Fluoresbrite YG Microspheres 0.20 μm, Polyscience, Inc). The microspheres were suspended in Polydimethylsiloxane to be made into a static fluorescent sample and were imaged with the combined system. Figure 2 shows an en face image reconstructed from OCM data and the corresponding fluorescence microscope image, where the positions of several lumps of fixed microspheres agree between two images after the alignment (red arrows). Note that more fluorescent lumps appear in the fluorescence image because the wide-field fluorescence microscope may capture contrasts from a larger focal depth than the OCM that uses additional coherence gating; the OCM image in Fig. 2(b) was obtained by a maximum intensity projection over five en face slices (corresponding to a 17.3-μm depth). Although two images could not be perfectly aligned pixel by pixel due to geometric differences in the focal plane and imaging depth, the alignment was sufficiently precise for a cell-to-cell (~10 μm in size) comparison.
Fig. 2.
Simultaneous wide-field fluorescence microscope (a) and OCM (b) imaging of fluorescent microspheres. Scale bar, 100 μm.
2.2. DLS-OCM measurement of the diffusion coefficient
The dynamic range of the diffusion coefficient measurement from the autocorrelation function of a time-series OCT signal [19] can vary with the temporal sampling rate (i.e., the A-scan rate) and the maximum time lag in the autocorrelation function. This study uses a faster OCT system (147,000 A-scan/s) than the one used in our previous publication (47,000 A-scan/s) and specifically focuses on diffusion-coefficient mapping of cellular viability, whereas the previous study focused on distinctive mapping of the blood flow and intracellular diffusion [20]. For this reason, we optimized our DLS-OCM measurement of the diffusion coefficient through numerical simulation and phantom experiment, to match its dynamic range for the reported values of ICM (0.1-10 μm2/s [19,20,25]) prior to its application to biological specimen imaging.
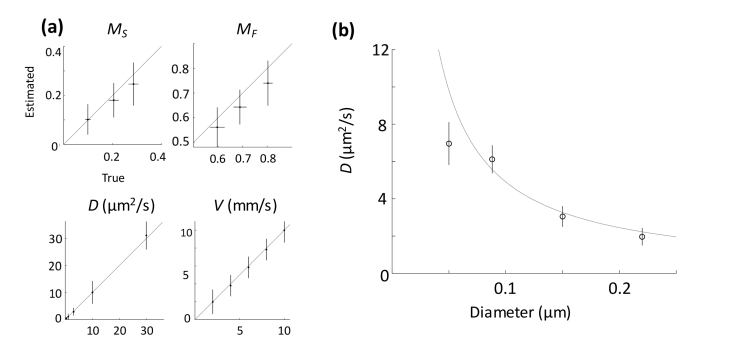
The numerical simulation tested combinations of three cases of the data acquisition time (0.68, 1.4, and 2.7 ms, corresponding to the numbers of A-scans repeated at each X-Y position, 100, 200, and 400 A-scans, respectively) and two cases of the maximum time lag (1/2 and 1/4 of the acquisition time), to find which combination results in the most accurate estimation of the diffusion coefficient over the range of 0.3-30 μm2/s. Five diffusion coefficients in the range were chosen with even intervals in a log scale. A longer acquisition time may be more advantageous to measure lower diffusion coefficients, so the range of data acquisition time was chosen based on our initial guess that it is appropriate for the diffusion coefficient range. The detailed simulation procedure was similar to the one we previously published [19]. In short, for each given set of parameters (including the diffusion coefficient, number density of diffusing particles, velocity of flowing particles (as a potential noise), and the number density of static particles within the OCM resolution volume), we generated time-series position data of the particles, determined true diffusion coefficient and flow velocity from the position data, generated a time-series OCM signal from the position data, obtained its autocorrelation function, fitted it to our model to estimate the diffusion coefficient and flow velocity, and then compared them with the true values. We repeated this simulation for 100 random initial positions of the particles, repeated it for 1,050 parameter sets (5 diffusion coefficients, 5 flow velocities, 7 flow angles, and 6 number densities), and repeated the analysis again for six cases of the acquisition time and maximum time lag. As a result, the 0.68-ms acquisition time and the 0.17-ms maximum time lag produced the minimum root-mean-square error in the diffusion coefficient measurement (1.7%) when more than 60% of the particles in the OCM resolution volume exhibit diffusive movements and the flow velocity as noise is lower than 10 mm/s (Fig. 3(a)). Based on this optimization, in the following DLS-OCM imaging, 128 A-scans were repeated at a fixed position, it was then moved to the next scanning position, and their autocorrelation functions with the 1/4 maximum time lag (0.22 ms) were obtained and processed, producing a 3D map of the diffusion coefficient of a sample.
Fig. 3.
(a) Numerical simulation results with the optimized acquisition time and maximum time lag. Each error bar represents variations due to the other combinations: diffusion coefficients, flow velocities, flow angles, and/or number densities. (b) DLS-OCM measurements of the diffusion coefficient in the standard sample. The circles with error bars indicate measurement data while the line indicates the theoretical value as given by the Stokes-Einstein equation.
The simulation was followed by a phantom experiment to confirm the accuracy and dynamic range of DLS-OCM measurements. As a standard sample, microspheres with various sizes were used because the diffusion coefficient and diameter of microspheres have an inversely linear relationship as given by Stokes-Einstein equation [29], D = kBT/8πηr3 where kB = 1.38 × 10⁻²³ J/K, T = 293 K, η = 1.00 cP. Monodisperse polystyrene microspheres in 2.5% solids (w/v) aqueous suspension (Polysciences, Inc.) with diameters of 0.05, 0.088, 0.15, and 0.22 μm were used. Following the simulation results, repeated A-scans were obtained to acquire a 3D volume data of the sample. From the raw OCT-spectrum data, 4D complex-valued SD-OCT reflectivity signals () were computed, from which a field autocorrelation function was generated as following;
| (1) |
Here, E[ ] denotes averaging over initial positions, * denotes the complex conjugate, and denotes the time averaging. The field autocorrelation function was then convolved with a 3 × 3 × 3 (voxels) spatial kernel to average over initial positions of particles and fitted to the previously developed model shown in Eq. (2) [19] to derive the dynamic parameters of the sample (see [19] for details).
| (2) |
Here, the scatterers are assumed to be static or flowing in an OCT resolution volume, and the flowing particles should exhibit translational motion with a velocity or diffusive motion with a diffusion coefficient. The dynamic parameters obtained are the fraction of static particles, , the fraction of flowing particles,, the transverse component of the velocity, , the axial component of the velocity, , and the diffusion coefficient, . Thus, five dynamic parameter maps were generated which were then convolved with a 5 × 5 × 5 (voxels) Gaussian kernel. As shown in Fig. 3(b), our DLS-OCM makes relatively accurate measurements (80.4% in accuracy) while it becomes inaccurate for higher diffusion coefficients than ~8 μm2/s. This upper limit of the dynamic range is attributed to the limited temporal sampling rate of our OCT system (0.68 μs), so one may need a faster system to increase the dynamic range, although the current range is suitable for our purpose because the reported typical ICM ranges from 0.1 to 10 μm2/s [19,20,25]. Finally, we determined the lower limit of the dynamic range using a static sample (WS-1, Oceans Optics) to 0.05 μm2/s.
2.3. DLS-OCM imaging of mouse retina with a genetically encoded calcium indicator
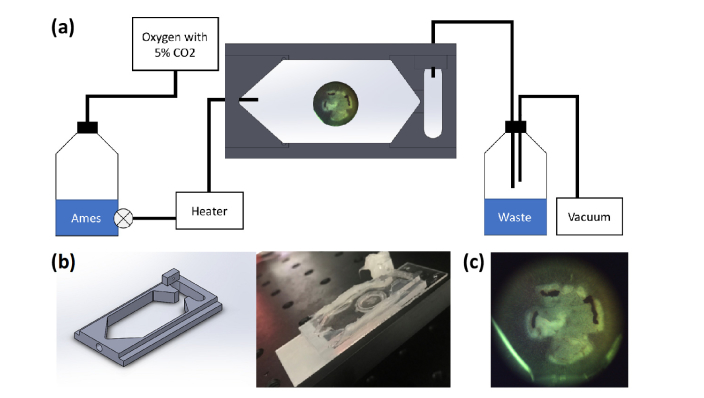
As a biological specimen to test DLS-OCM measurements of cellular viability, intact retinal tissues dissected from mice were used. The retinal explant was chosen for this study because it has well-known laminar cellular distribution, it is relatively easy to be encoded with genetically-induced calcium fluorescence indicators [28], which is advantageous for the simultaneous fluorescence and DLS-OCM imaging, and it is closer to in vivo than cell culture as it has other tissue constituents as well (e.g., extracellular matrix). Thus, we established a colony of GCaMP3 mice (B6.Cg-Tg(Thy1-GCaMP3)6Gfng/J) and euthanized a mouse following our IACUC-approved protocol before dissecting retinas. For the retinal dissection, a mouse was anesthetized with 3-5% isoflurane with a mixture of 100% oxygen in the air. Immediately after the initiation of anesthesia, pharmaceutical grade Dexamethasone (0.2 mg/kg) was administered to decrease inflammation, and buprenorphine (0.05-0.1 mg/kg) was administered to ensure pain relief. Whole retina was harvested directly from the euthanized animal by puncturing the eye, cut out the cornea, and cut around the eye at the limbus to release the retina. Then, the retina was freed from the eyecup, detached from the optic nerve, cut in a clover shape to put on a filter (Millicell Cell Culture Insert, EMD Millipore Corp.), and then sucked from the other side to be fixed at the surface (Fig. 4(c)). This fixing method is widely used in retinal physiology experiments to keep a retinal explant in place even when the medium is slowly perfused. While we repeated the experiment, we visually checked the position of the retina sample between OCT data acquisitions and found that the fixing method works well in our setup as well. The sample and filter were placed in our imaging chamber (Figs. 4(a-b)), where the explant was supplied with Ames medium (Sigma-Aldrich Corp.) bubbled by O2 (5% CO2), through a syringe pump (AL-1000, WPI Inc.) for precise perfusion rate. The controlled flow went through a heater and controller (SH-27B, TC-324C, Warner instrument) to maintain the physiological temperature (31°C). All animal-based experimental procedures were reviewed and approved by the Institutional Animal Care and Use Committee of Brown University, according to the guidelines and policies of the office of laboratory animal welfare and public health service, National Institutes of Health.
Fig. 4.
(a) Perfusion setup for live retinal imaging. (b) The retina holder. (c) A dissected retina explant on the retinal imaging chamber.
To investigate how the measured ICM consistently varies with change in cellular viability, we manipulated the viability by altering conditions with well-known effects on it: the temperature and pH. DLS-OCM data were acquired before and after the condition changes (30 min later exposure to the change). The routine metabolic rate decreases at low temperature [30]; thus, we lowered the temperature to 15°C by packing the chamber surroundings with ice packs, to decrease the metabolic rate of retinal cells. On the other hand, cellular oxygen consumption decreases at low pH [31], so we decreased the pH to 3.5 by adding hydrogen chloride to the continuously perfused Ames medium.
3. Results
3.1 DLS-OCM can visualize individual cells with the contrast of the diffusion coefficient
Simultaneous fluorescence and DLS-OCM imaging of GCaMP3-encoded ganglion cells in an intact retina were performed with the combined imaging system. While the wide-field fluorescence microscope image visualizes the cells with intrinsic chemical contrast (Fig. 5(a)), the diffusion coefficient map of the same area shows that the cells exhibit significantly higher diffusion coefficients than the background tissue (Fig. 5(b)). Although the locations of the cells are not exactly identical between the two images, likely due to the above-mentioned difference in the focus geometry (Fig. 2), a high spatial correlation is observed as indicated by the red arrows in Fig. 5. In addition, the cells visualized by DLS-OCM have a consistent size of soma (10-15 μm for retinal ganglion cells). These results support that the diffusion coefficient map of DLS-OCM can detect ICM at single-cell resolution.
Fig. 5.
Comparison of cell images between fluorescence and DLS-OCM imaging. (a) GCaMP3 imaging of retinal ganglion cells. (b) Simultaneously acquired diffusion coefficient map using DLS-OCM of the same area as (a). The presented en face map was obtained by a maximum intensity projection of five en face slices around the focal depth (corresponding to a 17.3-μm depth). The red arrows indicate spatial correlation in the cellular location between the two images. This image is presented with the narrow display range for high-contrast visualization of the geometric correspondence. Scale bar, 10 μm.
3.2 DLS-OCM-measured ICM varies consistently with manipulated cellular viability
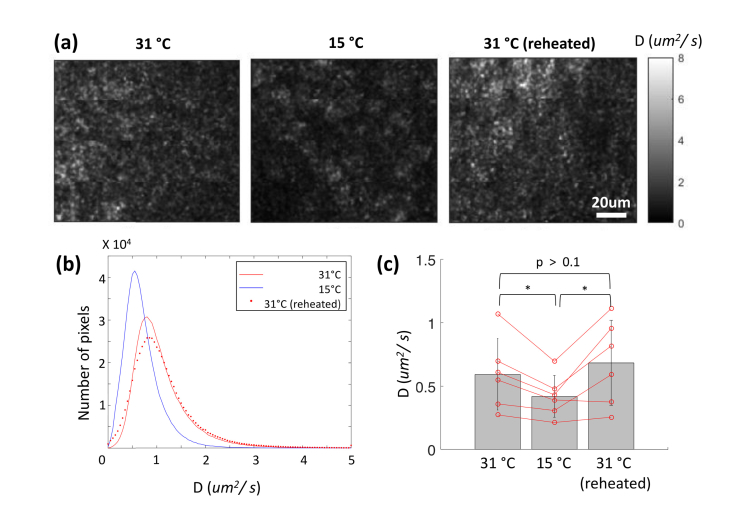
ICM changes in reaction to the temperature changes from 31°C to 15°C, and back to 31°C are presented in Fig. 6. In a retinal explant, the diffusion coefficient maps show an overall decrease in ICM at low temperature and a recovery by reheating (Fig. 6(a)). These changes in ICM are apparent in the histograms (Fig. 6(b)). Statistically (n = 5), the averaged ICM is significantly different between low and high temperatures (p = 0.016), but is not significantly different between the initial and reheated conditions (p = 0.28).
Fig. 6.
ICM measurements under temperature change. (a) Diffusion coefficient maps at 31 °C, 15 °C, and reheated to 31°C. The presented en face maps were obtained by maximum intensity projection of five en face slices around the focal depth (corresponding to a 17.3-μm depth). Scale bar: 20um. (b) Histograms of the diffusion coefficient at the three temperatures. (c) Statistical analysis of ICM changes (n = 5). Red lines indicate changes in the individual averages. The p-values were obtained by the paired student t-test. * denotes p < 0.05.
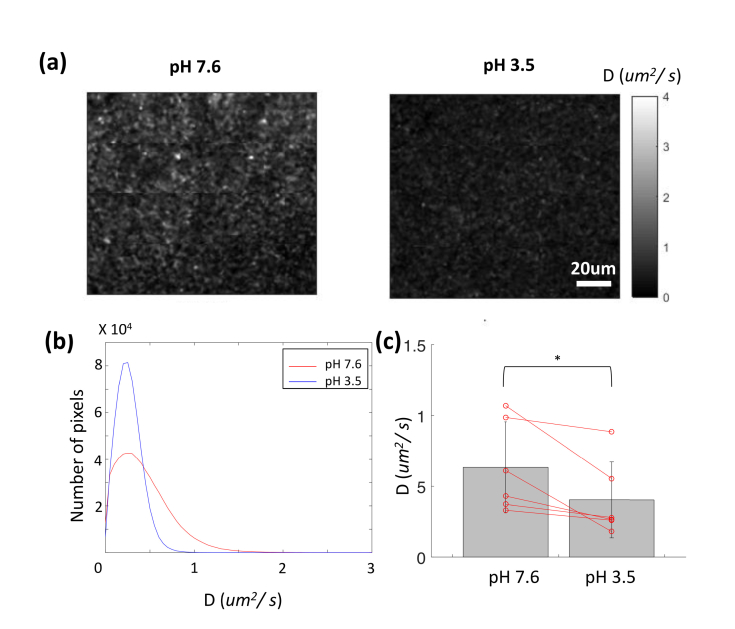
pH change also causes change in DLS-OCM-measured ICM, which is consistent with the expected variation in the cellular viability. Compared to the physiological pH of 7.6, a lower pH of 3.5 results in an overall decrease in ICM (Fig. 7). Such consistent changes are statistically significant (n = 5; p = 0.034) as shown in Fig. 7(c).
Fig. 7.
ICM measurements under pH change. (a) Diffusion coefficient maps at pH 7.6 and 3.5. The presented en face maps were obtained by maximum intensity projection of five en face slices around the focal depth (corresponding to a 17.3-μm depth). Scale bar: 20um. (b) Histograms of the diffusion coefficient at the two pH conditions. (c) Statistical analysis of ICM changes (n = 5). Red lines indicate changes in the individual averages. The p-values were obtained by the paired student t-test. * denotes p < 0.05.
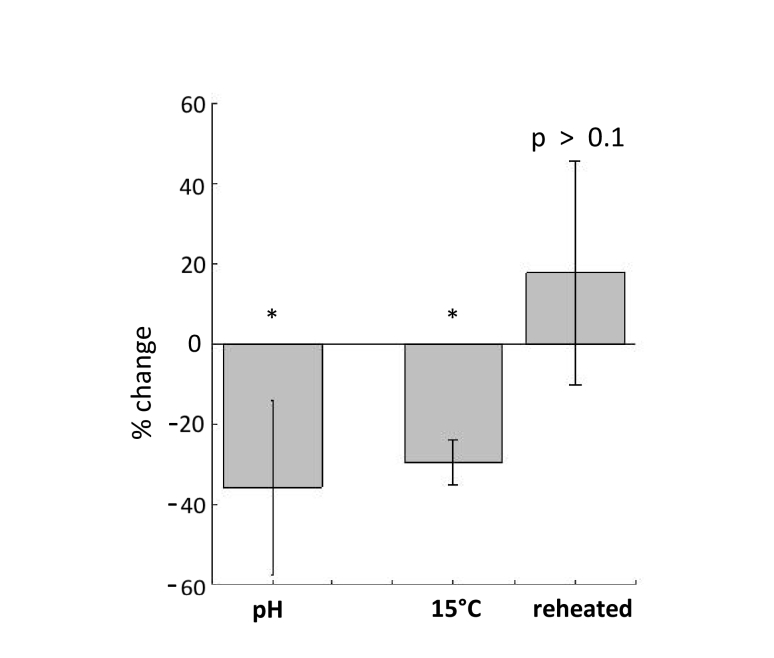
Finally, Fig. 8 summarizes statistical percentage changes in the measured ICM from the physiological condition to the changed condition. Both pH change and lowered temperature have produced statistically significant negative changes in ICM (−30% ~-40%; p = 0.016 and p = 0.034, respectively). The reheated case has shown a slight increase in ICM in comparison to that of the initial normal temperature, but it is statistically insignificant (p = 0.28). These results support that DLS-OCM-measured ICM can serve as an effective estimate of the cellular viability.
Fig. 8.
Percent changes of ICM in response to the induced viability changes. *p < 0.05.
4. Discussions and conclusion
This paper proposes DLS-OCM measurement of ICM as a means of label-free, standard unit-represented estimation of cellular viability. DLS-OCM has been optimized for the dynamic range matching with ICM, its diffusion coefficient map has visualized ICM of individual cells in the ex vivo retinal tissue as confirmed by comparison with simultaneously acquired coregistered fluorescence imaging, and finally, the measured ICM has consistently varied with the manipulated cellular viability.
When a cell is viable, active metabolism gives rise to active motions of intracellular organelles. Active and directional motions are primarily driven through cytoskeleton, which fluctuates and transports small particles. On the other hand, intracellular motions that are similar to diffusive motions, are also active motions consuming ATP that are different from passive diffusions [12,32]. Although small organelles exhibit directional motions, it can appear to be diffusive due to the size of the particle, the nature of the viscoelastic surroundings, and the force applied [33]. Some of the previous studies investigating the intracellular organelle movements used the standard unit of diffusion coefficient to quantify them. The previously reported diffusion coefficients in viable cells range from 0.1 to 10 μm2/s [19,20,25], and our previous study using DLS-OCT reported the diffusion coefficient of the neural cytoplasm in the range of 0.5-1 μm2/s. In this paper, ICM exhibits 1-4 μm2/s (see the histograms in Figs. 6 and 7), which is consistent, in the order of magnitude, with the previous reports even though they used different systems and biological specimen.
When the temperature of a tissue reaches a lower value than the physiological temperature, the active metabolism rate decreases [30]. Extremely low or high temperature are known to limit the oxygen delivery to mitochondria and cause changes to the anaerobic metabolism that has a lower efficiency of ATP reproduction compared to the aerobic metabolism [34]. In turn, with lower ATP, cellular energy levels also drop and the metabolic rate decreases [35]. The lowered metabolic rate will also lower the associated active motions of intracellular organelles (i.e., ICM). The previous study tracked polystyrene beads using in vitro motility assay and found that the active motion of microtubule-based transport decreased by 56% at a low temperature of 15 °C [36], which agrees with our measurements (Fig. 8).
pH condition that is lower than a physiological pH surrounding a tissue results in a metabolism rate decrease, due to the oxygen consumption rate decrease and glucose utilization rate [31,37]. pH also affects cell membrane permeability by changing the net electric charge of the amino acids. A study showed that both oxygen and glucose consumption rate of brain slices decreased by ~20% and ~60%, respectively, after 20 minutes of exposure to pH 6.2 compared to pH 7.4 [37]. In accordance with the metabolism decrease in the lower temperature above, a decrease in the metabolism by lowering pH will decrease ICM. Our observation of the decreased diffusion coefficient under pH 3.5 is in harmony with the previous studies. With the acidic condition we have achieved with a low pH of 3.5, cells may have also undergone necrosis, which may also contribute to low ICM.
According to the Mie scattering theory, relatively large organelles with the size ranging from 0.1 to 10 μm (e.g., mitochondria and cytoskeleton) may dominantly contribute to our OCT signals (with the center wavelength of 1.3 μm) and thereby the measured diffusion coefficient [20]. Although Actin and microtubules are the two main drivers in the ATP-consuming intracellular motility, they are too small to substantially contribute to the OCT signals. It is currently unclear which organelles exactly are responsible for DLS-OCM-measured ICM. A mechanism study that employs various drugs that affect a specific process targeting a specific organelle is required to answer the question. In addition, although this study shows the possibility of longitudinal monitoring of cellular viability changes in the same sample, which is difficult with destructive traditional cell assay methods, the present report does not demonstrate an additional interesting potential of tracking the viability cell by cell. When realized, the capability will enable unprecedented drug and toxin effect studies that track the effects over individual cells in a longitudinal manner (e.g., how an environmental toxin invades a human tissue spheroid and thus how the cells in its necrotic core respond differently to the toxin in time). In this study, the conditional changes were made through the continuously perfused medium, which had the sample slowly move and thereby made it difficult to track the exactly same cells between the imaging sessions 30-min apart. Therefore, another study using either a real-time visualization and adjustment of FOV (in both transverse and axial directions) or a treatment causing minimal movements is required to validate the capability. Finally, the current scanning and data processing time for our DLS-OCM may need further improvement for practical applications. For the FOV of 128 μm × 128 μm, our current system with 147,000 A-scan/s takes about 1 minute to repeat 128 A-scans at every X-Y position, which is faster than the previous DLS-OCT but still needs to be improved for high-throughput viability assessment on multiple microwells that is needed for drug and toxin effect studies. The current data processing time for the fitting of 5 coefficients takes 4 hours for the above FOV data when the algorithm we previously published [20] runs on our computer (two 2.30-GHz CPUs), which precludes the possibility of real-time analysis and visualization. A faster OCT, as well as a computationally-optimized algorithm for fitting, should be developed for the high-throughput application.
In conclusion, we have demonstrated the potential of DLS-OCM for non-destructive, standard-unit assessment of cellular viability. The technique can measure ICM of individual cells in biological tissue in the standard unit of diffusion coefficient, and the measured ICM has been shown to correlate with cellular viability. Such label-free, cellular-resolution measurement of viability will be useful for a wide range of drug and toxin effect studies.
Funding
NIH/NIBIB (R00-EB014879); Richard B. Salomon Faculty Research Award.
Disclosures
The authors declare that there are no conflicts of interest related to this article.
References
- 1.Kepp O., Galluzzi L., Lipinski M., Yuan J., Kroemer G., “Cell death assays for drug discovery,” Nat. Rev. Drug Discov. 10(3), 221–237 (2011). 10.1038/nrd3373 [DOI] [PubMed] [Google Scholar]
- 2.Vistica D. T., Skehan P., Scudiero D., Monks A., Pittman A., Boyd M. R., “Tetrazolium-based assays for cellular viability: a critical examination of selected parameters affecting formazan production,” Cancer Res. 51(10), 2515–2520 (1991). [PubMed] [Google Scholar]
- 3.Khetani S. R., Bhatia S. N., “Microscale culture of human liver cells for drug development,” Nat. Biotechnol. 26(1), 120–126 (2008). 10.1038/nbt1361 [DOI] [PubMed] [Google Scholar]
- 4.Herman B., Albertini D. F., “A time-lapse video image intensification analysis of cytoplasmic organelle movements during endosome translocation,” J. Cell Biol. 98(2), 565–576 (1984). 10.1083/jcb.98.2.565 [DOI] [PMC free article] [PubMed] [Google Scholar]
- 5.Brangwynne C. P., MacKintosh F. C., Weitz D. A., “Force fluctuations and polymerization dynamics of intracellular microtubules,” Proc. Natl. Acad. Sci. U.S.A. 104(41), 16128–16133 (2007). 10.1073/pnas.0703094104 [DOI] [PMC free article] [PubMed] [Google Scholar]
- 6.Tseng Y., Kole T. P., Wirtz D., “Micromechanical mapping of live cells by multiple-particle-tracking microrheology,” Biophys. J. 83(6), 3162–3176 (2002). 10.1016/S0006-3495(02)75319-8 [DOI] [PMC free article] [PubMed] [Google Scholar]
- 7.Panorchan P., Lee J. S. H., Kole T. P., Tseng Y., Wirtz D., “Microrheology and ROCK Signaling of Human Endothelial Cells Embedded in a 3D Matrix,” Biophys. J. 91(9), 3499–3507 (2006). 10.1529/biophysj.106.084988 [DOI] [PMC free article] [PubMed] [Google Scholar]
- 8.Luby-Phelps K., Castles P. E., Taylort D. L., Lannit F., “Hindered diffusion of inert tracer particles in the cytoplasm of mouse 3T3 cells,” Proc. Natl. Acad. Sci. U.S.A. 84, 4910–4913 (1987). [DOI] [PMC free article] [PubMed] [Google Scholar]
- 9.Luby-Phelps K., Taylor D. L., Lanni F., “Probing the structure of cytoplasm,” J. Cell Biol. 102(6), 2015–2022 (1986). 10.1083/jcb.102.6.2015 [DOI] [PMC free article] [PubMed] [Google Scholar]
- 10.Elson E. L., Magde D., “Fluorescence correlation spectroscopy. I. Conceptual basis and theory,” Biopolymers 13(1), 1–27 (1974). 10.1002/bip.1974.360130102 [DOI] [PubMed] [Google Scholar]
- 11.Chen H., Farkas E. R., Webb W. W., “Chapter 1: In vivo applications of fluorescence correlation spectroscopy,” Methods Cell Biol. 89, 3–35 (2008). 10.1016/S0091-679X(08)00601-8 [DOI] [PubMed] [Google Scholar]
- 12.Brangwynne C. P., Koenderink G. H., MacKintosh F. C., Weitz D. A., “Intracellular transport by active diffusion,” Trends Cell Biol. 19(9), 423–427 (2009). 10.1016/j.tcb.2009.04.004 [DOI] [PubMed] [Google Scholar]
- 13.Nolte D. D., An R., Turek J., Jeong K., “Holographic tissue dynamics spectroscopy,” J. Biomed. Opt. 16(8), 087004 (2011). 10.1117/1.3615970 [DOI] [PubMed] [Google Scholar]
- 14.Prummer M., Kling D., Trefzer V., Enderle T., Zoffmann S., Prunotto M., “A random motility assay based on image correlation spectroscopy,” Biophys. J. 104(11), 2362–2372 (2013). 10.1016/j.bpj.2013.04.031 [DOI] [PMC free article] [PubMed] [Google Scholar]
- 15. Shaked N. T., Wax A., “Quantitative Phase Microscopy of Live Biological Cell Dynamics,” in Advanced Phase Measurement Methods in Optics and Imaging (Springer; Berlin Heidelberg, 2010), pp. 283–288. [Google Scholar]
- 16.Popescu G., Park Y., Choi W., Dasari R. R., Feld M. S., Badizadegan K., “Imaging red blood cell dynamics by quantitative phase microscopy,” Blood Cells Mol. Dis. 41(1), 10–16 (2008). 10.1016/j.bcmd.2008.01.010 [DOI] [PMC free article] [PubMed] [Google Scholar]
- 17.Yamauchi T., Iwai H., Yamashita Y., “Label-free imaging of intracellular motility by low-coherent quantitative phase microscopy,” Opt. Express 19(6), 5536–5550 (2011). 10.1364/OE.19.005536 [DOI] [PubMed] [Google Scholar]
- 18.Sattelle D. B., Green D. J., Langley K. H., “Subcellular Motions in Nitella flexilis studied by Photon Correlation Spectroscopy,” Phys. Scr. 19(4), 471–475 (1979). 10.1088/0031-8949/19/4/028 [DOI] [Google Scholar]
- 19.Lee J., Wu W., Jiang J. Y., Zhu B., Boas D. A., “Dynamic light scattering optical coherence tomography,” Opt. Express 20(20), 22262–22277 (2012). 10.1364/OE.20.022262 [DOI] [PMC free article] [PubMed] [Google Scholar]
- 20.Lee J., Radhakrishnan H., Wu W., Daneshmand A., Climov M., Ayata C., Boas D. A., “Quantitative imaging of cerebral blood flow velocity and intracellular motility using dynamic light scattering-optical coherence tomography,” J. Cereb. Blood Flow Metab. 33(6), 819–825 (2013). 10.1038/jcbfm.2013.20 [DOI] [PMC free article] [PubMed] [Google Scholar]
- 21.Oldenburg A. L., Yu X., Gilliss T., Alabi O., Taylor R. M., 2nd, Troester M. A., “Inverse-power-law behavior of cellular motility reveals stromal-epithelial cell interactions in 3D co-culture by OCT fluctuation spectroscopy,” Optica 2(10), 877–885 (2015). 10.1364/OPTICA.2.000877 [DOI] [PMC free article] [PubMed] [Google Scholar]
- 22.Apelian C., Harms F., Thouvenin O., Boccara A. C., “Dynamic full field optical coherence tomography: subcellular metabolic contrast revealed in tissues by interferometric signals temporal analysis,” Biomed. Opt. Express 7(4), 1511–1524 (2016). 10.1364/BOE.7.001511 [DOI] [PMC free article] [PubMed] [Google Scholar]
- 23.Marchand P. J., Bouwens A., Bolmont T., Shamaei V. K., Nguyen D., Szlag D., Extermann J., Lasser T., “Statistical parametric mapping of stimuli evoked changes in total blood flow velocity in the mouse cortex obtained with extended-focus optical coherence microscopy,” Biomed. Opt. Express 8(1), 1–15 (2017). 10.1364/BOE.8.000001 [DOI] [PMC free article] [PubMed] [Google Scholar]
- 24.Jia Y., Tan O., Tokayer J., Potsaid B., Wang Y., Liu J. J., Kraus M. F., Subhash H., Fujimoto J. G., Hornegger J., Huang D., “Split-spectrum amplitude-decorrelation angiography with optical coherence tomography,” Opt. Express 20(4), 4710–4725 (2012). 10.1364/OE.20.004710 [DOI] [PMC free article] [PubMed] [Google Scholar]
- 25.Wojcieszyn J. W., Schlegelt R. A., Wut E.-S., Jacobson K. A., “Diffusion of injected macromolecules within the cytoplasm of living cells (erythrocyte-mediated microinjection/photobleaching/human fibroblast/cytoplasmic viscosity/cytoskeleton),” Cell Biol. 78, 4407–4410 (1981). [DOI] [PMC free article] [PubMed] [Google Scholar]
- 26.Marlar S., Arnspang E. C., Pedersen G. A., Koffman J. S., Nejsum L. N., “Measuring localization and diffusion coefficients of basolateral proteins in lateral versus basal membranes using functionalized substrates and kICS analysis,” Biochim. Biophys. Acta 1838(10), 2404–2411 (2014). 10.1016/j.bbamem.2014.06.005 [DOI] [PubMed] [Google Scholar]
- 27.Weiss N., van Leeuwen T. G., Kalkman J., “Simultaneous and localized measurement of diffusion and flow using optical coherence tomography,” Opt. Express 23(3), 3448–3459 (2015). 10.1364/OE.23.003448 [DOI] [PubMed] [Google Scholar]
- 28.Tian L., Hires S. A., Mao T., Huber D., Chiappe M. E., Chalasani S. H., Petreanu L., Akerboom J., McKinney S. A., Schreiter E. R., Bargmann C. I., Jayaraman V., Svoboda K., Looger L. L., “Imaging neural activity in worms, flies and mice with improved GCaMP calcium indicators,” Nat. Methods 6(12), 875–881 (2009). 10.1038/nmeth.1398 [DOI] [PMC free article] [PubMed] [Google Scholar]
- 29.Einstein A., “Über die von der molekularkinetischen Theorie der Wärme geforderte Bewegung von in ruhenden Flüssigkeiten suspendierten Teilchen,” Ann. Phys. 322(8), 549–560 (1905). 10.1002/andp.19053220806 [DOI] [Google Scholar]
- 30.Schulte P. M., “The effects of temperature on aerobic metabolism: towards a mechanistic understanding of the responses of ectotherms to a changing environment,” J. Exp. Biol. 218(12), 1856–1866 (2015). 10.1242/jeb.118851 [DOI] [PubMed] [Google Scholar]
- 31.Koehler E. A., Reitzel R. J., Rockefeller Institute for Medical Research, and American Society for Biochemistry and Molecular Biology; “The effect of pH on the oxygen consumption of tissues,” J. Biol. Chem. 64, 739–751 (1925). [Google Scholar]
- 32.Lin C., Schuster M., Guimaraes S. C., Ashwin P., Schrader M., Metz J., Hacker C., Gurr S. J., Steinberg G., “Active diffusion and microtubule-based transport oppose myosin forces to position organelles in cells,” Nat. Commun. 7, 11814 (2016). 10.1038/ncomms11814 [DOI] [PMC free article] [PubMed] [Google Scholar]
- 33.Norregaard K., Metzler R., Ritter C. M., Berg-Sørensen K., Oddershede L. B., “Manipulation and Motion of Organelles and Single Molecules in Living Cells,” Chem. Rev. 117(5), 4342–4375 (2017). 10.1021/acs.chemrev.6b00638 [DOI] [PubMed] [Google Scholar]
- 34.Pörtner H. O., “Climate change and temperature-dependent biogeography: Oxygen limitation of thermal tolerance in animals,” Naturwissenschaften 88(4), 137–146 (2001). 10.1007/s001140100216 [DOI] [PubMed] [Google Scholar]
- 35.Zielinski S., Pörtner H. O., “Energy metabolism and ATP free-energy change of the intertidal worm Sipunculus nudus below a critical temperature,” J. Comp. Physiol. - B Biochem. Syst. Environ. Physiol. 166, 492–500 (1996). 10.1007/BF02338292 [DOI] [Google Scholar]
- 36.Hong W., Takshak A., Osunbayo O., Kunwar A., Vershinin M., “The Effect of Temperature on Microtubule-Based Transport by Cytoplasmic Dynein and Kinesin-1 Motors,” Biophys. J. 111(6), 1287–1294 (2016). 10.1016/j.bpj.2016.08.006 [DOI] [PMC free article] [PubMed] [Google Scholar]
- 37.Patel K. K., Hartmann J. F., Cohen M. M., “Effect of pH on Metabolism and Ultrastructure of Guinea Pig Cerebral Cortex Slices,” Stroke 4, 221–231 (1973). [DOI] [PubMed] [Google Scholar]


