Abstract
With the goal to screen high-risk populations for oral cancer in low- and middle-income countries (LMICs), we have developed a low-cost, portable, easy to use smartphone-based intraoral dual-modality imaging platform. In this paper we present an image classification approach based on autofluorescence and white light images using deep learning methods. The information from the autofluorescence and white light image pair is extracted, calculated, and fused to feed the deep learning neural networks. We have investigated and compared the performance of different convolutional neural networks, transfer learning, and several regularization techniques for oral cancer classification. Our experimental results demonstrate the effectiveness of deep learning methods in classifying dual-modal images for oral cancer detection.
1. Introduction
Oral cancer ranks the sixth most common malignant tumor globally with high risk in low- and middle-income countries (LMICs). Globally, there are an estimated 529,000 new cases of oral cancer with more than 300,000 deaths each year [1]. The most common risk factors include tobacco chewing, smoking, alcohol consumption, human papillomavirus (HPV) infection and local irritation [2]. Overall, the five-year survival rate for oral and oropharyngeal cancers is about 65% in the United States [3] and 37% in India [4]. Early diagnosis increases survival rates. In India, the five-year survival rate of patients diagnosed at an early stage is 82% whereas the rate is 27% when diagnosed at an advanced stage [5]. With half of all oral cancers worldwide diagnosed at an advanced stage, tools to enable early diagnosis are greatly needed to increase survival rates [6].
Biopsy, the gold standard for diagnosis of oral cancer, is often not ideal as a screening tool, due to invasive nature and the availability of limited expertise at point-of-care [7]. The clinical standard for oral lesion detection is conventional oral examination (COE), which involves visual inspection by a specialist. However, most high risk individuals don’t have access to doctors and dentists in LMICs due to inadequate trained specialists and limited health services [8]. Therefore, a point-of-care oral screening tool is urgently needed. In our previous study using a mobile phone, it was proved that remote specialist consultation through images transmitted by front line health workers improved early detection of oral cancer [9].
Autofluorescence visualization (AFV) has gained interest for early detection of oral malignant and oral potentially malignant lesions (OPML), and preliminary research indicates AFV can help detect some oral malignant and OPMLs, which are not visible by COE [10] and assist in differentiating dysplasia from normal mucosa by comparing fluorescence loss [11]. However, not all dysplastic lesions display loss of autofluorescence [12–14], and some research concludes the combination of AFV and COE has a better accuracy than either AFV or COE alone [15,16].
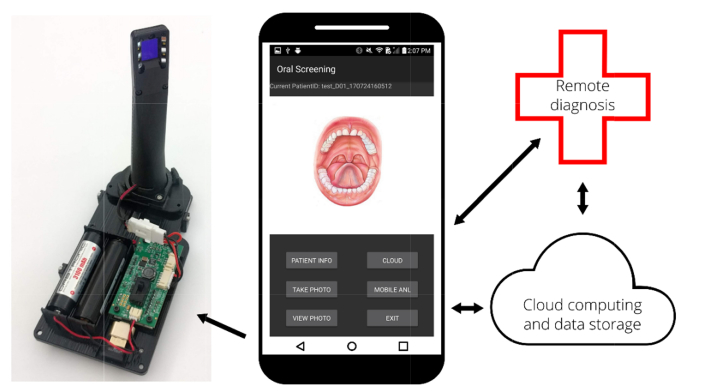
Using autofluorescence imaging techniques, several tools have recently been developed as screening adjuncts [13,15–18], but each of them has some major limitations like portability or convenient data transmission capabilities, preventing them from becoming an effective solution for oral cancer screening, particularly in low resource settings. We have developed a dual-mode intraoral oral cancer screening platform which social workers can use to screen a high-risk population, communicate with remote specialists, and access cloud-based image processing and classification as shown in Fig. 1 [19].
Fig. 1.
Low-cost, dual-modality smartphone-based oral cancer screening platform. The platform consists of a commercial LG G4 Android smartphone, an external peripheral with intraoral imaging attachment, LEDs, LED driver and batteries, a cloud-based image process and storage server. A custom Android application provides a user interface, controls the phone along with external peripherals, and enables communication with the cloud server and remote specialist.
While a number of oral cavity detection devices have been developed [10,13,20–23], one challenge is how images are analyzed and presented to the medical users as most of them are not familiar with imaging techniques. A number of automatic image classification methods have been developed for oral cavity images [17,24–26]. Darren et al. developed a simple classification algorithm based on the ratio of red-to-green fluorescence and linear discriminant analysis [26]. Rahman et al. used a similar algorithm to evaluate a simple, low-cost optical imaging system, and identified cancerous and suspicious neoplasia tissue [17]. Recently, convolutional neural networks (CNNs) have proven to be successful in solving image classification problems [27,28], and many medical image analysis tasks [29–32], including detection of diabetic retinopathy in retinal fundus photographs [31], classification of skin cancer images [32], confocal laser endomicroscopy imaging of oral squamous cell carcinoma [33], hyperspectral imaging of head and neck cancer [34], and orofacial image analysis [35]. In this paper, we propose a dual-modal CNN classification method for oral cancer for point-of-care mobile imaging applications.
2. Materials and methods
2.1 Dual-modal imaging platform
Both autofluorescence and white light imaging have been used for oral cancer detection independently, but each has its own limitation. We propose dual-modal imaging to improve the system sensitivity and specificity. The platform [19] consists of a commercial LG G4 Android smartphone, a whole mouth imaging attachment (not shown), an intraoral imaging attachment, an LED driver, a mobile app, and a cloud-based image processing and storage server as shown in Fig. 1. The system utilizes six 405 nm Luxeon UV U1 LEDs (Lumileds, Amsterdam, Netherlands) to enable the autofluorescence imaging (AFI), and four 4000 K Luxeon Z ES LEDs for white light imaging (WLI). The illumination LEDs are driven by a switching boost voltage regulator (LT3478, Linear Technology, Milpitas, CA). Autofluorescence excitation wavelengths of 400 nm to 410 nm have been shown to be effective in previous studies [26,36,37]. The optical power of UV LEDs delivered to the sample is 2.01 mW/cm2, measured by a Newport optical power meter (1916-R, Newport, Irvine, CA), which is below the maximum permissible exposure (MPE) limit [38]. A custom Android application provides a user interface, controls the phone along with external peripherals, and enables communication with the cloud server and remote specialist.
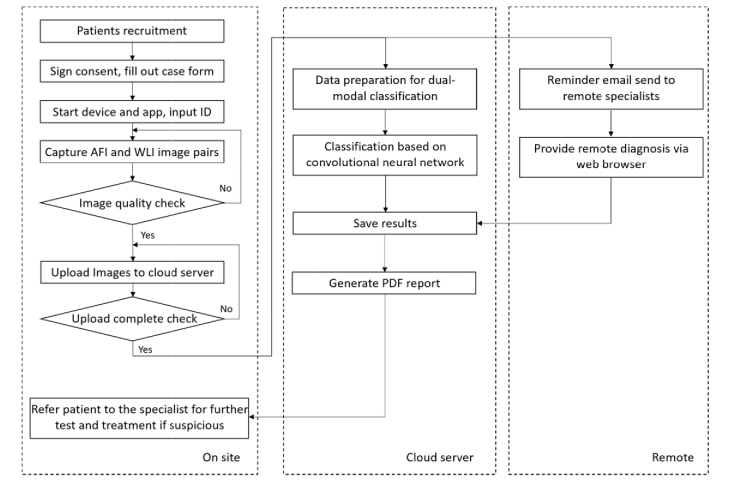
The workflow of the proposed mobile imaging platform is shown in Fig. 2. Autofluorescence and white light image pairs are captured on-site, and then uploaded to a cloud server. The automatic classification algorithm and a reminder email to remote specialists are both triggered when upload is completed. A deep learning approach classifies the image pairs for oral dysplasia and malignancy. After receiving the reminder email, the remote specialist can log into the platform and provide diagnosis from anywhere via web browser. Results from both the deep learning algorithm and remote specialist are saved on the cloud server, and a PDF (portable document format) report is automatically generated when both results are available. The patient will be referred to the specialist if the result turns out suspicious.
Fig. 2.
Workflow of the proposed mobile imaging platform. Autofluorescence and white light images acquired from smartphone are uploaded to cloud server and classified for oral dysplasia and malignancy based on deep learning. Remote diagnosis could be provided by remote specialists anywhere with internet connections. Results can be viewed on-site through the customized mobile app.
2.2 Study population
The study was carried out among patients attending the outpatient clinics of Department of Oral Medicine and Radiology, KLE Society Institute of Dental Sciences (KLE), India. Head and Neck Oncology Department of Mazumdar Shaw Medical Center (MSMC), India, and Christian Institute of Health Sciences and Research (CIHSR), Dimapur, India, during the period of October 2017 to May 2018. Approval of the institutional ethical committee was obtained prior to initiation of the study and written informed consent was obtained from all subjects enrolled in the study. The subjects who were clinically diagnosed with OPML and malignant lesions were recruited in the study. Images of normal mucosa were also collected. Patients who did not consent or had undergone biopsy previously were excluded from the study.
2.3 Data acquisition
Dual-modal image pairs from 190 patients were labelled and separated into two categories by oral oncology specialists from MSMC, KLE, and CIHSR. Normal images were categorized as ‘normal’ and OPML and malignant lesions as ‘suspicious’. Images with low quality due to saliva, defocus, motion, low light, and over-exposure were labeled as ‘Not Diagnostic’ and were not used in the classification study.
Figure 3 shows examples of dual-modal image pairs. Figures 3(a) (AFI) and 3b (WLI) are from the palate of a healthy patient, Figs. 3(c) (AFI) and 3(d) (WLI) are from the buccal mucosa of a patient with an oral potentially malignant lesion, and Figs. 3(e) and 3(f) are image pairs of a malignant lesion from the lower vestibule. The autofluorescence images look yellowish, partially due to the cross-talk between the green and red channels in the CMOS sensor.
Fig. 3.
Examples of dual-modal image pairs captured from the dual-modal mobile imaging device. (a) and (b) are autofluorescence image and white light image from the palate of a healthy patient, (c) and (d) are from the buccal mucosa of a patient with oral potentially malignant lesion, and (e) and (f) are image pairs of a malignant lesion from the lower vestibule.
We observe that for healthy regions, the autofluorescence signal is relatively uniform across the whole image, and the white light images look smooth and the color is uniform. In contrast, for OPML and malignant regions, there is loss of autofluorescence signal and the color in white light images is not uniform. These features are used to classify the images in the CNN.
2.4 Image enhancement
The most common artifacts in the data set are low brightness and contrast. An adaptive histogram equalization method is used to improve the quality for the images with low brightness and contrast. The method increases contrast by equalizing the distribution of pixel intensities in the image. Since the ratio between red and green color channels can be an important feature to discriminate OPML and malignant lesion from normal ones [26,39], equalizing the fluorescence images for each channel ensures they have the same intensity scale to maintain a consistent interpretation of ratio between color channels. The image is also sharpened by subtracting a Gaussian blurred version of the image.
2.5 Data preparation for dual-modal image classification
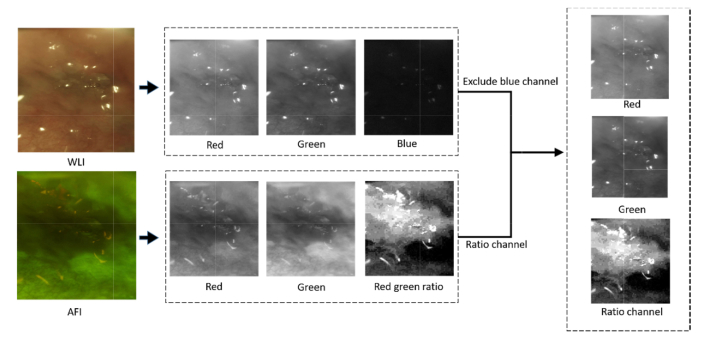
For dual-modal CNN-based classification, a new, three-channel data set is created from the autofluorescence and white light images. Since a long pass filter is added in front of the CMOS sensor to block the excitation wavelengths, the blue channel of the WLI has low signal and high noise (Fig. 4) and is excluded. In autofluorescence images, the ratio of the red and green channels contains information related to the loss of fluorescence signal and is correlated with OPML and malignant lesions [26,39]. Instead of using both three-channel images to train the CNN, we create a single three-channel image using the green and red channels from the white light image and the normalized ratio of red and green channels from the autofluorescence image as the third channel. The fused data feeds the neural network.
Fig. 4.
Overview of the data preparation for dual-modal image classification. A new, three-channel data set is created from the autofluorescence and white light image pairs. The blue channel of the white light image which has low signal and high noise is excluded. The new three-channel image uses the green and red channels from the white light image and the normalized ratio of red and green channels from autofluorescence image as the third channel.
2.6 Dual-modal deep learning methods
There are several deep learning frameworks available [40–42]. MatConNet [42], an open source CNN toolbox designed by Visual Geometry Group (Oxford University), is used in our application [43]. Since we have a small number of image data to train the CNN classifier, the complexity and the number of free parameters of the deep neural network may cause an overfitting problem, resulting in low accuracy or training difficulty. We investigate transfer learning, data augmentation, dropout, and weight decay to improve the performance and avoid overfitting.
Transfer learning: One common method to solve the problem of limited training data is transfer learning, where a model trained for one task is reused as the starting point for another task [44], leveraging knowledge learned from a different task to improve learning in the target task. The key benefits of transfer learning include reduced time to fully learn the new image data set and overall better performance. Transfer learning has been effective in the use of deep CNNs in medical imaging applications [45,46]. We compare the performance of transfer learning with networks VGG-CNN-M and VGG-CNN-S from Chatfield et al. [47] and VGG-16 from Simonyan et al. [48]. Our study uses CNN-M pre-trained using ImageNet [49], the last two layers (the fully connected layer and softmax layer) are replaced by a new dense layer and softmax layer. The transfer learning process is completed by training the new network with our fused dual-modal image data. The same data augmentation strategy is applied during each training process, and each network is trained for 100 epochs. The results and network comparisons are discussed in Section 4.
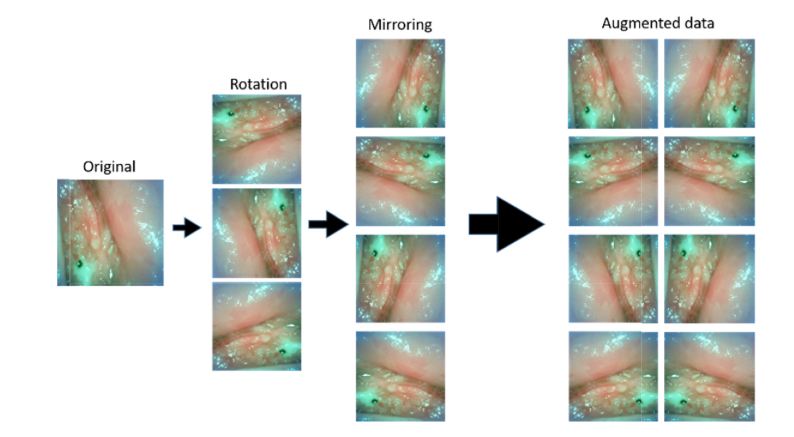
Data augmentation: Data augmentation has been widely used to improve the classification performance of deep learning networks [32,33]. Here we enrich the data provided to the classifier by flipping and rotating original images since our probe images have no natural orientation. Seven additional images are generated from each image by rotating and flipping the original as shown in Fig. 5. The same data augmentation strategy has been applied to each training process.
Fig. 5.
Data augmentation. Example of the data-augmented images. A total of 8 images are obtained from a single image by rotating and flipping the original image.
Regularization techniques: A network may over-fit the data when the network is complex and the training data set is small. Regularization is a technique to avoid overfitting. Proposed by Srivastava et al. in 2014 [50], dropout is an effective regularization technique [28,50]. This method drops neurons along with their connections in hidden layers during the training process with certain probability. By randomly dropping neurons in a certain layer, some dependencies with specific neurons which only help to classify training images but do not work with test images are removed. The remaining dependencies work well with both training and test data. Because our data set is very small, overfitting is likely to occur. Therefore, a dropout layer with a drop probability of 0.5 is added between the second fully connected layer and the last one.
Weight decay is another regularization technique used to address overfitting problems [51]. It limits the growth of the weights by introducing a penalty to large weights in the cost function:
| (1) |
where is the original cost function, each wi is the weight for free parameter of the network, and governs how strongly large weights are penalized.
3. Results
After excluding low quality images due to saliva, defocus, motion, low light, and over-exposure, 170 image pairs are used in the study and are assigned to categories ‘normal’ or ‘suspicious’, where ‘suspicious’ includes images labeled with OPML and malignant lesions. There are 84 image pairs in the ‘suspicious’ category and 86 images pairs in the ‘normal’ category; 66 normal images and 64 suspicious images are used to train the CNN, and 20 images in each category are used for validation (Table 1).
Table 1. Image data set used for developing deep learning image classification method.
| Training set | Validation set | |
|---|---|---|
| Normal | 66 | 20 |
| Suspicious | 64 | 20 |
In the study, we have compared the performance of different networks, applied data augmentation and regularization techniques, and compared our fused dual-modal method with single modal WLI or AFI. For each comparison, all settings except the one under investigation are fixed.
3.1 Architecture
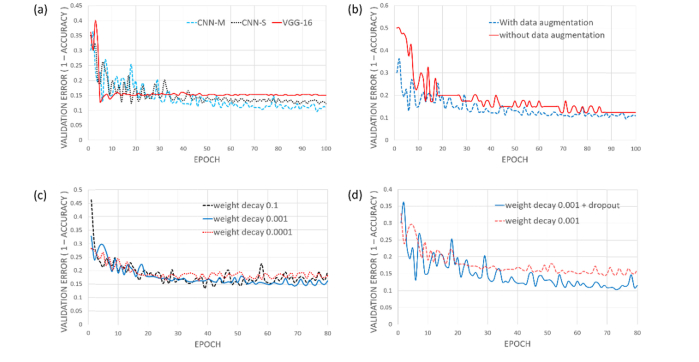
While increasing the depth of network is typically beneficial for the classification accuracy [48], sometimes the accuracy becomes worse when training a small image data set [52]. To achieve the best performance with our small data set, we have evaluated a number of neural network architectures. Figure 6(a) shows the performances of three different architectures: VGG-CNN-M, VGG-CNN-S, and VGG-16. VGG-16 contains 16 layers, of which 13 are convolutional layers. VGG-16 has the largest number of convolutional layers of the three networks, but the worst performance. Both VGG-CNN-M and VGG-CNN-S have five convolutional layers. In VGG-CNN-M the stride in layer conv2 is two and the max-pooling window in layers conv1 and conv5 is 2x2. In VGG-CNN-S the stride in layer conv2 is one, and the max-pooling window in layers conv1 and conv5 is 3x3. VGG-CNN-M has the best performance, and we use this architecture in our study.
Fig. 6.
(a) The validation errors of three different neural network architectures: VGG-CNN-M, VGG-CNN-S, and VGG-16. VGG-CNN-M performs best among these three networks. (b) The comparison between the neural networks trained with and without augmented data. (c) The performances for different weight decays. (d) The performance with and without Dropout.
3.2 Data augmentation
Data augmentation is implemented to increase the data set size. Figure 6(b) shows the increased accuracy from using data augmentation. As expected, the accuracy increases with a larger data set.
3.3 Regularization
Various weight decay parameters have been explored and = 0.001 has the best performance as shown in Fig. 6(c). Additional studies could help to find the optimal weight decay value. As shown in Fig. 6(d), we can further improve the performance by applying the dropout technique.
3.4 Dual-modal image vs. single-modal image
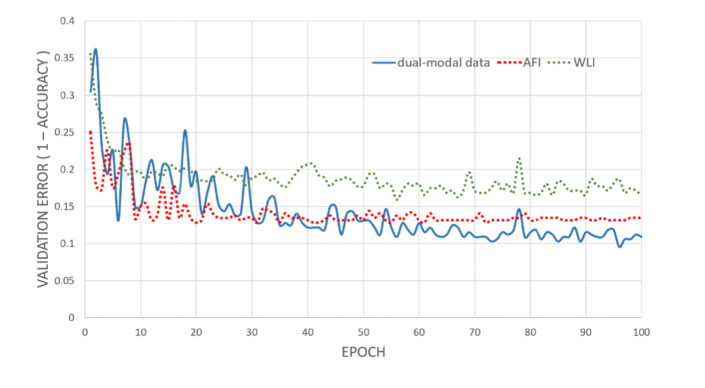
To compare classification performance, we train the VGG-CNN-M independently with AFI, WLI, and dual-modal images (Fig. 7). Clearly, a neural network trained with dual-modal images has the best performance while the one with only white light images has the worst performance. This result is expected as more features can be extracted from dual-modal images to classify images. This study also partially validates that autofluorescence imaging has better performance in detecting oral cancer than white light imaging. Finally, the best result uses transfer learning of the VGG-CNN-M module along with the data augmentation of the dual-modal images, resulting in a 4-fold cross-validation average accuracy of 86.9% at a sensitivity of 85.0% and specificity of 88.7%, as shown in Fig. 7.
Fig. 7.
The performance of neural networks trained with dual-modal images, AFI, and WLI.
4. Discussion
The images in this study were captured from buccal mucosa, gingiva, soft palate, vestibule, floor of mouth and tongue. One challenge associated with the current platform is that different tissue structural and biochemical compositions at different anatomical regions have different autofluorescence characteristics, so the performance of the trained neural network will be potentially impacted. This problem could be addressed in the future when we have sufficient image data at every anatomical region to train neural networks and classify each anatomical region separately.
In this study, our goal is to develop a platform for community screening in LMICs, we currently focus on distinguishing dysplasia and malignancy tissue from normal ones. While, in clinical practice, it would be of interest for clinicians to distinguish different stages of cancerous tissue, this work provides the platform for further studies towards a multi-stage classification in the future.
One remaining question on is whether the images marked as clinically normal or suspicious actually reflect the true condition of the patients because the diagnosis results from the specialists are used as the ground truth, not the histopathological results. The device will act as a screening device at rural communities, and patients will be referred to hospitals and clinics for further test and treatment if a suspicious result appears.
5. Conclusion
Smartphones integrate state-of-art technologies, such as fast CPUs, high-resolution digital cameras, and user-friendly interfaces. An estimated six billion phone subscriptions exist worldwide with over 70% of the subscribers living in LMICs [53]. With many smartphone-based healthcare devices being developed for various applications, perhaps the biggest challenge of mobile health concerns is the volume of information these devices will produce. Because adequately training specialists to fully understand and diagnose the images is challenging, automatic image analysis methods, such as machine learning, are urgently needed.
In this paper, we present a deep learning image classification method based on dual-modal images captured from our low-cost, dual-mode, smartphone-based intraoral screening device. To improve the accuracy, we fuse AFI and WLI information into one three-channel image. The performance with fused data is better than using either white light or autofluorescence image alone.
We have compared convolutional networks having different complexities and depths. The smaller network with five convolutional layers works better than a very deep network containing 13 convolutional layers, most likely due to the increase of the network’s complexity causing overfitting when training a small data set. We have also investigated several methods to improve the learning performance and address the overfitting problem. Transfer learning can greatly reduce the number of parameters and number of images needed to train. Data augmentation used to increase the training data set size and regularization techniques such as weight decay and dropout are effective in avoiding overfitting.
In the future, we will capture more images and increase the size of our data set. With a bigger image data set, the overfitting problem will reduce and more complex deep learning models can be applied for more accurate and robust performance. Furthermore, due to the variation in tissue types in the oral cavity, performance is potentially degraded when classifying them together. With additional data, we will be able to perform more detailed multi-class (different anatomical regions) and multi-stage classification using deep learning.
Acknowledgments
We are grateful to TIDI Products for manufacturing custom shields for our device.
Funding
National Institute of Biomedical Imaging and Bioengineering of the National Institutes of Health (UH2EB022623); National Institutes of Health (NIH) (S10OD018061); National Institutes of Health Biomedical Imaging and Spectroscopy Training (T32EB000809).
Disclosures
The authors declare that there are no conflicts of interest related to this article.
References
- 1.World Health Organization , “Oral cancer,” http://www.who.int/cancer/prevention/diagnosis-screening/oral-cancer/en/.
- 2.Petti S., Scully C., “Oral cancer knowledge and awareness: primary and secondary effects of an information leaflet,” Oral Oncol. 43(4), 408–415 (2007). 10.1016/j.oraloncology.2006.04.010 [DOI] [PubMed] [Google Scholar]
- 3.American Society of Clinical Oncology , “Oral and Oropharyngeal Cancer: Statistics,” https://www.cancer.net/cancer-types/oral-and-oropharyngeal-cancer/statistics.
- 4.Mallath M. K., Taylor D. G., Badwe R. A., Rath G. K., Shanta V., Pramesh C. S., Digumarti R., Sebastian P., Borthakur B. B., Kalwar A., Kapoor S., Kumar S., Gill J. L., Kuriakose M. A., Malhotra H., Sharma S. C., Shukla S., Viswanath L., Chacko R. T., Pautu J. L., Reddy K. S., Sharma K. S., Purushotham A. D., Sullivan R., “The growing burden of cancer in India: epidemiology and social context,” Lancet Oncol. 15(6), e205–e212 (2014). 10.1016/S1470-2045(14)70115-9 [DOI] [PubMed] [Google Scholar]
- 5.National Institute of Cancer Prevention and Research , “Statistics,” http://cancerindia.org.in/statistics/.
- 6.Le Campion A. C. O. V., Ribeiro C. M. B., Luiz R. R., da Silva Júnior F. F., Barros H. C. S., dos Santos K. C. B., Ferreira S. J., Gonçalves L. S., Ferreira S. M. S., “Low survival rates of oral and oropharyngeal squamous cell carcinoma,” Int. J. Dent. 2017, 1–7 (2017). 10.1155/2017/5815493 [DOI] [PMC free article] [PubMed] [Google Scholar]
- 7.Shield K. D., Ferlay J., Jemal A., Sankaranarayanan R., Chaturvedi A. K., Bray F., Soerjomataram I., “The global incidence of lip, oral cavity, and pharyngeal cancers by subsite in 2012,” CA Cancer J. Clin. 67(1), 51–64 (2017). 10.3322/caac.21384 [DOI] [PubMed] [Google Scholar]
- 8.Coelho K. R., “Challenges of the oral cancer burden in India,” J. Cancer Epidemiol. 2012, 701932 (2012). 10.1155/2012/701932 [DOI] [PMC free article] [PubMed] [Google Scholar]
- 9.Birur P. N., Sunny S. P., Jena S., Kandasarma U., Raghavan S., Ramaswamy B., Shanmugam S. P., Patrick S., Kuriakose R., Mallaiah J., Suresh A., Chigurupati R., Desai R., Kuriakose M. A., “Mobile health application for remote oral cancer surveillance,” J. Am. Dent. Assoc. 146(12), 886–894 (2015). 10.1016/j.adaj.2015.05.020 [DOI] [PubMed] [Google Scholar]
- 10.Lane P. M., Gilhuly T., Whitehead P. D., Zeng H., Poh C., Ng S., Williams M., Zhang L., Rosin M., MacAulay C. E., “Simple device for the direct visualization of oral-cavity tissue fluorescence,” J. Biomed. Opt. 11, 24006–24007 (2006). [DOI] [PubMed] [Google Scholar]
- 11.Pavlova I., Williams M., El-Naggar A., Richards-Kortum R., Gillenwater A., “Understanding the Biological Basis of Autofluorescence Imaging for Oral Cancer Detection: High-Resolution Fluorescence Microscopy in Viable Tissue,” Clin. Cancer Res. 14(8), 2396–2404 (2008). [DOI] [PMC free article] [PubMed] [Google Scholar]
- 12.Mehrotra R., Singh M., Thomas S., Nair P., Pandya S., Nigam N. S., Shukla P., “A cross-sectional study evaluating chemiluminescence and autofluorescence in the detection of clinically innocuous precancerous and cancerous oral lesions,” J. Am. Dent. Assoc. 141(2), 151–156 (2010). 10.14219/jada.archive.2010.0132 [DOI] [PubMed] [Google Scholar]
- 13.Awan K. H., Morgan P. R., Warnakulasuriya S., “Evaluation of an autofluorescence based imaging system (VELscope™) in the detection of oral potentially malignant disorders and benign keratoses,” Oral Oncol. 47(4), 274–277 (2011). 10.1016/j.oraloncology.2011.02.001 [DOI] [PubMed] [Google Scholar]
- 14.Rana M., Zapf A., Kuehle M., Gellrich N.-C., Eckardt A. M., “Clinical evaluation of an autofluorescence diagnostic device for oral cancer detection: a prospective randomized diagnostic study,” Eur. J. Cancer Prev. 21(5), 460–466 (2012). 10.1097/CEJ.0b013e32834fdb6d [DOI] [PubMed] [Google Scholar]
- 15.Farah C. S., McIntosh L., Georgiou A., McCullough M. J., “Efficacy of tissue autofluorescence imaging (velscope) in the visualization of oral mucosal lesions,” Head Neck 34(6), 856–862 (2012). 10.1002/hed.21834 [DOI] [PubMed] [Google Scholar]
- 16.Jayaprakash V., Sullivan M., Merzianu M., Rigual N. R., Loree T. R., Popat S. R., Moysich K. B., Ramananda S., Johnson T., Marshall J. R., Hutson A. D., Mang T. S., Wilson B. C., Gill S. R., Frustino J., Bogaards A., Reid M. E., “Autofluorescence-guided surveillance for oral cancer,” Cancer Prev. Res. 2(11), 966–974 (2009). 10.1158/1940-6207.CAPR-09-0062 [DOI] [PMC free article] [PubMed] [Google Scholar]
- 17.Rahman M. S., Ingole N., Roblyer D., Stepanek V., Richards-Kortum R., Gillenwater A., Shastri S., Chaturvedi P., “Evaluation of a low-cost, portable imaging system for early detection of oral cancer,” Head Neck Oncol. 2(1), 10 (2010). 10.1186/1758-3284-2-10 [DOI] [PMC free article] [PubMed] [Google Scholar]
- 18.Poh C. F., MacAulay C. E., Zhang L., Rosin M. P., “Tracing the “At-Risk” Oral Mucosa Field with Autofluorescence: Steps Toward Clinical Impact,” Cancer Prev. Res. 2(5), 401–404 (2009). [DOI] [PMC free article] [PubMed] [Google Scholar]
- 19.Uthoff R. D., Song B., Birur P., Kuriakose M. A., Sunny S., Suresh A., Patrick S., Anbarani A., Spires O., Wilder-Smith P., Liang R., “Development of a dual-modality, dual-view smartphone-based imaging system for oral cancer detection,” Proc. SPIE 10486, 104860V (2018). [Google Scholar]
- 20.Gillenwater A., Jacob R., Ganeshappa R., Kemp B., El-Naggar A. K., Palmer J. L., Clayman G., Mitchell M. F., Richards-Kortum R., “Noninvasive diagnosis of oral neoplasia based on fluorescence spectroscopy and native tissue autofluorescence,” Arch. Otolaryngol. Head Neck Surg. 124(11), 1251–1258 (1998). 10.1001/archotol.124.11.1251 [DOI] [PubMed] [Google Scholar]
- 21.Yang S. W., Lee Y. S., Chang L. C., Hwang C. C., Chen T. A., “Diagnostic significance of narrow-band imaging for detecting high-grade dysplasia, carcinoma in situ, and carcinoma in oral leukoplakia,” Laryngoscope 122(12), 2754–2761 (2012). 10.1002/lary.23629 [DOI] [PubMed] [Google Scholar]
- 22.Maitland K. C., Gillenwater A. M., Williams M. D., El-Naggar A. K., Descour M. R., Richards-Kortum R. R., “In vivo imaging of oral neoplasia using a miniaturized fiber optic confocal reflectance microscope,” Oral Oncol. 44(11), 1059–1066 (2008). 10.1016/j.oraloncology.2008.02.002 [DOI] [PMC free article] [PubMed] [Google Scholar]
- 23.Rahman M., Chaturvedi P., Gillenwater A., Richards-Kortum R. R., “Low-cost, multimodal, portable screening system for early detection of oral cancer,” J. Biomed. Opt. 13, 30502–30503 (2008). [DOI] [PubMed] [Google Scholar]
- 24.Krishnan M. M. R., Venkatraghavan V., Acharya U. R., Pal M., Paul R. R., Min L. C., Ray A. K., Chatterjee J., Chakraborty C., “Automated oral cancer identification using histopathological images: a hybrid feature extraction paradigm,” Micron 43(2-3), 352–364 (2012). 10.1016/j.micron.2011.09.016 [DOI] [PubMed] [Google Scholar]
- 25.van Staveren H. J., van Veen R. L. P., Speelman O. C., Witjes M. J. H., Star W. M., Roodenburg J. L. N., “Classification of clinical autofluorescence spectra of oral leukoplakia using an artificial neural network: a pilot study,” Oral Oncol. 36(3), 286–293 (2000). 10.1016/S1368-8375(00)00004-X [DOI] [PubMed] [Google Scholar]
- 26.Roblyer D., Kurachi C., Stepanek V., Williams M. D., El-Naggar A. K., Lee J. J., Gillenwater A. M., Richards-Kortum R., “Objective detection and delineation of oral neoplasia using autofluorescence imaging,” Cancer Prev. Res. (Phila.) 2(5), 423–431 (2009). 10.1158/1940-6207.CAPR-08-0229 [DOI] [PMC free article] [PubMed] [Google Scholar]
- 27. Krizhevsky A., Sutskever I., Hinton G. E., “ImageNet Classification with Deep Convolutional Neural Networks,” in Advances in Neural Information Processing Systems 25, Pereira F., Burges C. J. C., Bottou L., Weinberger K. Q., eds. (Curran Associates, Inc., 2012), pp. 1097–1105. [Google Scholar]
- 28.LeCun Y., Bengio Y., Hinton G., “Deep learning,” Nature 521(7553), 436–444 (2015). 10.1038/nature14539 [DOI] [PubMed] [Google Scholar]
- 29.Litjens G., Kooi T., Bejnordi B. E., Setio A. A. A., Ciompi F., Ghafoorian M., van der Laak J. A. W. M., van Ginneken B., Sánchez C. I., “A survey on deep learning in medical image analysis,” Med. Image Anal. 42, 60–88 (2017). 10.1016/j.media.2017.07.005 [DOI] [PubMed] [Google Scholar]
- 30.Mamoshina P., Vieira A., Putin E., Zhavoronkov A., “Applications of Deep Learning in Biomedicine,” Mol. Pharm. 13(5), 1445–1454 (2016). 10.1021/acs.molpharmaceut.5b00982 [DOI] [PubMed] [Google Scholar]
- 31.Gulshan V., Peng L., Coram M., Stumpe M. C., Wu D., Narayanaswamy A., Venugopalan S., Widner K., Madams T., Cuadros J., Kim R., Raman R., Nelson P. C., Mega J. L., Webster D. R., “Development and validation of a deep learning algorithm for detection of diabetic retinopathy in retinal fundus photographs,” JAMA 316(22), 2402–2410 (2016). 10.1001/jama.2016.17216 [DOI] [PubMed] [Google Scholar]
- 32.Esteva A., Kuprel B., Novoa R. A., Ko J., Swetter S. M., Blau H. M., Thrun S., “Dermatologist-level classification of skin cancer with deep neural networks,” Nature 542(7639), 115–118 (2017). 10.1038/nature21056 [DOI] [PMC free article] [PubMed] [Google Scholar]
- 33.Aubreville M., Knipfer C., Oetter N., Jaremenko C., Rodner E., Denzler J., Bohr C., Neumann H., Stelzle F., Maier A., “Automatic Classification of Cancerous Tissue in Laserendomicroscopy Images of the Oral Cavity using Deep Learning,” Sci. Rep. 7(1), 11979 (2017). 10.1038/s41598-017-12320-8 [DOI] [PMC free article] [PubMed] [Google Scholar]
- 34.Halicek M., Lu G., Little J. V, Wang X., Patel M., Griffith C. C., El-Deiry M. W., Chen A. Y., Fei B., “Deep convolutional neural networks for classifying head and neck cancer using hyperspectral imaging,” J. Biomed. Opt. 22, 60503–60504 (2017). [DOI] [PMC free article] [PubMed] [Google Scholar]
- 35.Anantharaman R., Anantharaman V., Lee Y., “Oro Vision: Deep Learning for Classifying Orofacial Diseases,” in 2017 IEEE International Conference on Healthcare Informatics (ICHI) (2017), pp. 39–45. 10.1109/ICHI.2017.69 [DOI] [Google Scholar]
- 36.Heintzelman D. L., Utzinger U., Fuchs H., Zuluaga A., Gossage K., Gillenwater A. M., Jacob R., Kemp B., Richards-Kortum R. R., “Optimal excitation wavelengths for in vivo detection of oral neoplasia using fluorescence spectroscopy,” Photochem. Photobiol. 72(1), 103–113 (2000). [DOI] [PubMed] [Google Scholar]
- 37.Svistun E., Alizadeh-Naderi R., El-Naggar A., Jacob R., Gillenwater A., Richards-Kortum R., “Vision enhancement system for detection of oral cavity neoplasia based on autofluorescence,” Head Neck 26(3), 205–215 (2004). 10.1002/hed.10381 [DOI] [PubMed] [Google Scholar]
- 38. Laser Institute of America , American National Standard for the Safe Use of Lasers, ANSI Z136.1–2007 (2007).
- 39.Pierce M. C., Schwarz R. A., Bhattar V. S., Mondrik S., Williams M. D., Lee J. J., Richards-Kortum R., Gillenwater A. M., “Accuracy of in vivo multimodal optical imaging for detection of oral neoplasia,” Cancer Prev. Res. (Phila.) 5(6), 801–809 (2012). 10.1158/1940-6207.CAPR-11-0555 [DOI] [PMC free article] [PubMed] [Google Scholar]
- 40. Bastien F., Lamblin P., Pascanu R., Bergstra J., Goodfellow I., Bergeron A., Bouchard N., Warde-Farley D., Bengio Y., “Theano: new features and speed improvements,” arXiv Prepr. arXiv1211.5590 (2012).
- 41. Abadi M., Barham P., Chen J., Chen Z., Davis A., Dean J., Devin M., Ghemawat S., Irving G., Isard M., Kudlur M., Levenberg J., Monga R., Moore S., Murray D. G., Steiner B., Tucker P., Vasudevan V., Warden P., Wicke M., Yu Y., Zheng X., “TensorFlow: A System for Large-scale Machine Learning,” in Proceedings of the 12th USENIX Conference on Operating Systems Design and Implementation, OSDI’16 (USENIX Association, 2016), pp. 265–283. [Google Scholar]
- 42. Vedaldi A., Lenc K., “MatConvNet: Convolutional Neural Networks for MATLAB,” in Proceedings of the 23rd ACM International Conference on Multimedia, MM ’15 (ACM, 2015), pp. 689–692. 10.1145/2733373.2807412 [DOI] [Google Scholar]
- 43.“MatConvNet,” http://www.vlfeat.org/matconvnet/.
- 44.Pan S. J., Yang Q., “A Survey on Transfer Learning,” IEEE Trans. Knowl. Data Eng. 22(10), 1345–1359 (2010). 10.1109/TKDE.2009.191 [DOI] [Google Scholar]
- 45.Shin H. C., Roth H. R., Gao M., Lu L., Xu Z., Nogues I., Yao J., Mollura D., Summers R. M., “Deep Convolutional Neural Networks for Computer-Aided Detection: CNN Architectures, Dataset Characteristics and Transfer Learning,” IEEE Trans. Med. Imaging 35(5), 1285–1298 (2016). 10.1109/TMI.2016.2528162 [DOI] [PMC free article] [PubMed] [Google Scholar]
- 46.Tajbakhsh N., Shin J. Y., Gurudu S. R., Hurst R. T., Kendall C. B., Gotway M. B., Jianming Liang, “Convolutional Neural Networks for Medical Image Analysis: Full Training or Fine Tuning?” IEEE Trans. Med. Imaging 35(5), 1299–1312 (2016). 10.1109/TMI.2016.2535302 [DOI] [PubMed] [Google Scholar]
- 47. Chatfield K., Simonyan K., Vedaldi A., Zisserman A., “Return of the Devil in the Details: Delving Deep into Convolutional Nets,” CoRR abs/1405.3, (2014).
- 48. Simonyan K., Zisserman A., “Very Deep Convolutional Networks for Large-Scale Image Recognition,” CoRR abs/1409.1, (2014).
- 49.Deng J., Dong W., Socher R., Li L. J., Li K., Fei-Fei L., “ImageNet: A large-scale hierarchical image database,” in 2009 IEEE Conference on Computer Vision and Pattern Recognition (2009), pp. 248–255. 10.1109/CVPR.2009.5206848 [DOI] [Google Scholar]
- 50.Srivastava N., Hinton G., Krizhevsky A., Sutskever I., Salakhutdinov R., “Dropout: A Simple Way to Prevent Neural Networks from Overfitting,” J. Mach. Learn. Res. 15, 1929–1958 (2014). [Google Scholar]
- 51. Krogh A., Hertz J. A., “A Simple Weight Decay Can Improve Generalization,” in Proceedings of the 4th International Conference on Neural Information Processing Systems, NIPS’91 (Morgan Kaufmann Publishers Inc., 1991), pp. 950–957. [Google Scholar]
- 52. He K., Zhang X., Ren S., Sun J., “Deep Residual Learning for Image Recognition,” CoRR abs/1512.0, (2015).
- 53.International Telecommunication Union , “Statistics,” https://www.itu.int/en/ITU-D/Statistics/Pages/stat/default.aspx.


