

Abstract
Somatic mutations in tet methylcytosine dioxygenase 2 (TET2), which encodes an epigenetic modifier enzyme, drive the development of haematopoietic malignancies1–7. In both humans and mice, TET2 deficiency leads to increased self-renewal of haematopoietic stem cells with a net developmental bias towards the myeloid lineage1,4,8,9. However, pre-leukaemic myeloproliferation (PMP) occurs in only a fraction of Tet2−/− mice8,9 and humans with TET2 mutations1,3,5–7, suggesting that extrinsic non-cell-autonomous factors are required for disease onset. Here we show that bacterial translocation and increased interleukin-6 production, resulting from dysfunction of the small-intestinal barrier, are critical for the development of PMP in mice that lack Tet2 expression in haematopoietic cells. Furthermore, in symptom-free Tet2−/− mice, PMP can be induced by disrupting intestinal barrier integrity, or in response to systemic bacterial stimuli such as the toll-like receptor 2 agonist. PMP was reversed by antibiotic treatment and failed to develop in germ-free Tet2−/− mice, which illustrates the importance of microbial signals in the development of this condition. Our findings demonstrate the requirement for microbial-dependent inflammation in the development of PMP and provide a mechanistic basis for the variation in PMP penetrance observed in Tet2−/− mice. This study will prompt new lines of investigation that may profoundly affect the prevention and management of haematopoietic malignancies.
TET2 deficiency leads to severe myeloproliferation, extramedullary haematopoiesis and splenomegaly that mimic pre-leukaemic myeloproliferative disorders (henceforth referred to as PMP)2,7–9. PMP is thought to set the stage for the development of overt leukaemia after the occurrence of additional cooperative oncogenic mutations10,11. To better understand the pathogenesis of PMP, we set out to determine the mechanisms that underlie variations in PMP penetrance, which are observed in around 50–75% of aged Tet2−/− mice that are over 20 weeks old8,9 (Extended Data Fig. 1a). We first developed a peripheral-blood biomarker that could serve as a robust predictor of disease. We found that the frequency of CD11b+Gr1+ myeloid cells in the peripheral blood positively correlates with myeloid proliferations12 (as defined by the expansion of myeloid cells in the spleen and peripheral blood) and splenic extramedullary haematopoiesis markers8,9,13,14 (an increase of lineage−Sca1+c-Kit+ (LSK) cells and splenomegaly) (Extended Data Fig. 1b–e). Confirming the prognostic robustness of this newly defined peripheral-blood biomarker of PMP, Tet2−/− mice that were over 20 weeks old and had >16% of CD11b+Gr1+ myeloid cells in their peripheral blood displayed a PMP phenotype (Extended Data Fig. 1f–h) as compared to age-matched Tet2−/− mice with ≤16% peripheral-blood CD11b+Gr1+ cells (defined as ‘symptom free’), or littermate controls.
We next determined whether differences in PMP penetrance in Tet2−/− mice (Extended Data Fig. 1a–h) could be linked to a change in the haematopoietic stem cell (HSC) self-renewing potential in vitro8,9. Irrespective of health status, bone marrow and splenic haematopoietic progenitors from symptom-free Tet2−/− mice and Tet2−/− mice with PMP displayed similar re-plating efficiencies, which were superior to those of littermate controls (Fig. 1a and Extended Data Fig. 1i). This suggests that extrinsic non-cell-autonomous factors are required for the development of PMP in Tet2−/− mice.
Fig. 1 |. Tet2 deficiency leads to systemic bacterial dissemination.
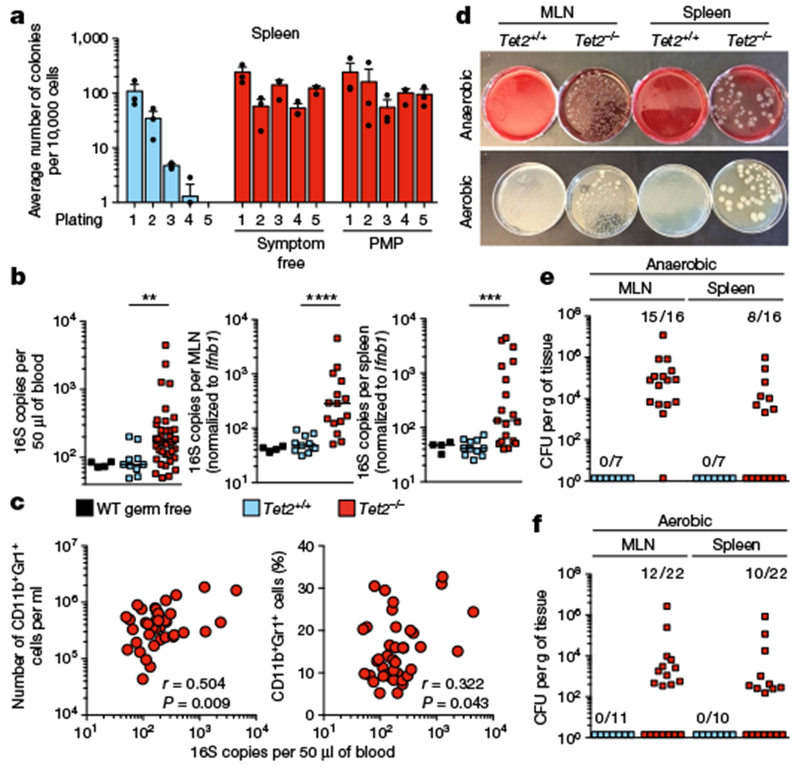
a, In vitro HSC self-renewal colony-forming assay of haematopoietic progenitors (n = 3 mice). Mean ± s.e.m. b, Bacterial 16S gene copies in peripheral blood (left; n = 4, 10 and 37 for germ-free wild-type (WT), Tet2+/+ and Tet2−/− mice, respectively), MLN (middle; n = 4, 11 and 15 for germ-free wild-type, Tet2+/+ and Tet2−/− mice, respectively) and spleen (right; n = 4, 11 and 19 for germ-free wild-type, Tet2+/+ and Tet2−/− mice, respectively). Germ-free wild-type mice served as negative control. Centre at median, two-tailed Mann–Whitney U-test. Bacterial 16S rRNA gene qPCRs from about 30 mg MLN and about 30 mg spleen were normalized to the host murine Ifnbl gene. c, Correlation between 16S gene copies in the peripheral blood and numbers (left) or frequency (right) of peripheral-blood CD11b+Gr1+myeloid cells (n = 40 mice). Pearson correlation test. d, Representative image of aerobic and anaerobic cultures. e, f, Quantification of bacteria colony-forming units (CFUs) of MLN and spleen suspensions grown under anaerobic (e) or aerobic (f) conditions. In b, *P < 0.05, **P < 0.01, ***P < 0.001, ****P < 0.0001. Data are representative of at least three independent experiments.
This finding, together with previous studies that report that the systemic dissemination of bacteria induces extramedullary haematopoiesis and emergency myelopoiesis15, prompted us to investigate whether bacterial triggers could drive myeloproliferation in the absence of Tet2. Quantification of the bacterial 16S rRNA gene revealed the presence of 16S gene copies in the peripheral blood, the mesenteric lymph nodes (MLNs), and the spleen of Tet2−/− mice (Fig. 1b) that correlated with myelocytosis (Fig. 1c and Extended Data Fig. 1j, k). Furthermore, cultivation of MLN and spleen suspensions under aerobic and anaerobic culture conditions confirmed that in about 50% of Tet2−/− mice, live bacteria—in particular Lactobacillus—were present. Lactobacillus has previously been reported to be predominantly located in the small intestine under steady-state conditions16 (Fig. 1d–f, and Extended Data Fig. 1l). No bacterial dissemination was observed in littermate controls (Fig. 1d–f).
The existence of spontaneous bacterial translocation in Tet2−/− mice was unexpected, given the absence of intestinal anomalies (Extended Data Fig. 2a) and epithelial cell death (Extended Data Fig. 2b, c) in Tet2−/− mice. However, increased intestinal permeability can occur in mice and humans with normal intestinal architecture17. Consistent with the observed microbial translocation, Tet2−/− mice displayed a significant increase in intestinal permeability as assessed by in vivo FITC–dextran intestinal permeability assay (Fig. 2a). Increased intestinal permeability positively correlated with PMP severity in Tet2−/− mice (Fig. 2b, c and Extended Data Fig. 3a), suggesting that disruption of intestinal barrier integrity may be sufficient to initiate PMP in symptom-free Tet2−/− mice. Accordingly, administration of dextran sodium sulfate (DSS)—a compound known to alter intestinal barrier function18—caused excessive myeloproliferation and extramedullary haematopoiesis that persisted more than one month after cessation of treatment in symptom-free Tet2f/fVavcre mice, but not in littermate controls (Fig. 2d, e and Extended Data Fig. 3b–d). Tet2f/fVavcre mice (Tet2 deleted in haematopoietic cells including progenitors) were used because somatic TET2 mutations occur in the haematopoietic compartment in humans1–7. These results suggest that maintaining intestinal barrier function is important for preventing PMP in the context of Tet2 deficiency in haematopoietic cells.
Fig. 2 |. Disruption of intestinal barrier integrity and systemic microbial signals are sufficient to drive PMP in the absence of Tet2.
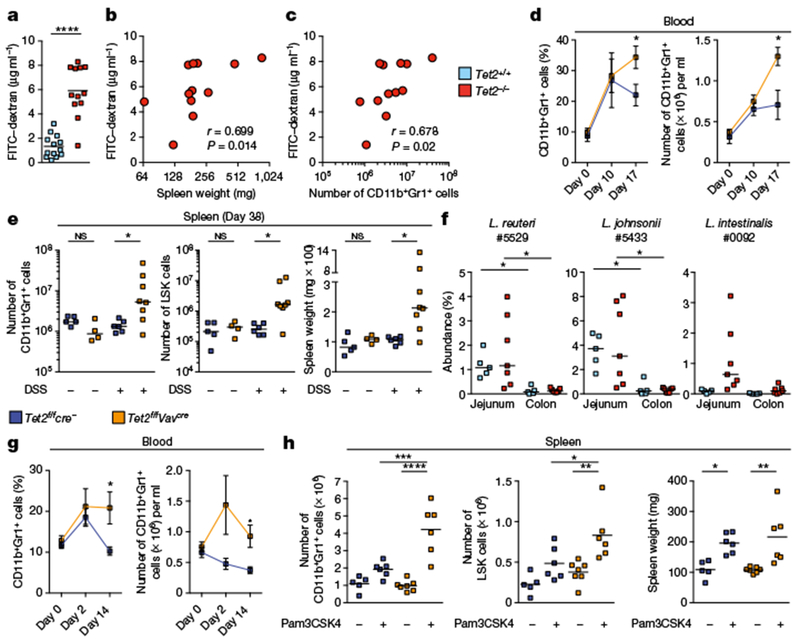
a, Intestinal permeability measurement by blood plasma FITC–dextran concentrations (n = 13 Tet2+/+ mice or 12 Tet2−/− mice). Centre is mean, two-tailed unpaired t-test. b, c, Blood plasma FITC–dextran concentration correlates with spleen weight (b) and numbers of splenic CD11b+Gr1+ myeloid cells (c) (n = 12 mice). Pearson correlation test. d, e, Symptom-free Tet2f/fVavcre mice that are over 20 weeks old, and littermate controls, treated with DSS (+) or received water (−). d, Frequency (left) and numbers (right) of CD11b+Gr1+ myeloid cells before, during and after DSS treatment (n = 5 Tet2f/fcre− (Tet2f/f mice without the Cre construct) mice or 8 Tet2f/fVavcre mice). Mean ± s.e.m., two-tailed unpaired t-test. e, Numbers of CD11b+Gr1+ myeloid cells (left), LSK cells (middle) and spleen weight (right) at end point analysis (n = 5 (Tet2f/fcre−, no DSS), 4 (Tet2f/fVavcre, no DSS), 6 (Tet2f/fcre−, DsS) or 8 (Tet2f/fVavcre, DSS) mice). f, Oligotypes identified in MLNs and spleens of Tet2−/− mice are enriched in the jejunum. Centre is median (n = 5 (Tet2+/+) or 7 (Tet2−/−) mice for jejunum and colon). g, h, Symptom-free Tet2f/fVavcre that are over 20 weeks old, and littermate controls, treated with the TLR1/2 agonist Pam3CSK4 (+) or received PBS (−). g, Percentage (left) and numbers (right) of CD11b+Gr1+ myeloid cells prior (day 0), during treatment (day 2) and at end-point analysis (day 14) (n = 6 mice). Mean ± s.e.m., two-tailed paired t-test, Sidak’s post hoc test. h, Numbers of CD11b+Gr1+ myeloid cells (left), LSK cells (middle) and spleen weight (right) (n = 5 (Tet2f/fcre−, no Pam3CSK4), 6 (Tet2f/fcre−, with Pam3CSK4), 7 (Tet2f/fVavcre, no Pam3CSK4) or 6 (Tet2f/fVavcre, with Pam3CSK4) mice). Centre is mean, one-way ANOVA, Sidak’s post hoc test. In e, f, centre is median, Kruskal–Wallis, Dunn’s post hoc test. Data are representative of at least two independent experiments. *P < 0.05, **P < 0.01, ***P < 0.001, ****P < 0.0001.
Whole transcriptome sequencing analysis of the intestine of Tet2−/− and littermate control mice revealed major transcriptional alterations in the jejunum, but minor changes were also detected in the colon (Extended Data Fig. 4a). This finding is consistent with the observation that Lactobacillus spp. residing in the small intestine16 were predominantly found in peripheral organs of Tet2−/− mice. Consistent with Tet2-deficient mice displaying increased intestinal permeability (Fig. 2a), the expression of genes known to maintain intestinal immune homeostasis and barrier function was altered in the jejunum (Extended Data Fig. 4b). In particular, tight junction zonula occludens-1 (ZO-1), which is critical in regulating the paracellular leakage pathway19, was reduced in the jejunum but not in the colon of Tet2-deficient mice (Extended Data Fig. 4c-d). In contrast to previous observations that suggested that selective deletion of Tet1 in epithelial cells leads to defects in intestinal permeability20, Tet2f/fVavcre mice—but not Tet2f/f Villincre mice (Tet2 deleted in epithelial cells)—displayed defects in gut barrier function (Extended Data Fig. 5a–c). Furthermore, Tet2f/f LysMcre (LysM is also known as Lyz2) mice (Tet2 deleted in mature myeloid cells) failed to show an increase in intestinal permeability (Extended Data Fig. 5a–c). Consistent with these findings, and as previously shown8,21, PMP developed only in Tet2f/fVavcre mice (Extended Data Fig. 5d–f). These observations suggest that Tet2 deficiency in the haematopoietic compartment can promote small-intestinal barrier dysfunction that causes bacterial translocation.
To further assess whether the translocated bacteria were primarily of jejunal origin, we matched oligotypes22 of identified bacterial strains in the spleen and MLN of Tet2−/− mice with bacteria residing in the different intestinal compartments (Extended Data Fig. 1l and Supplementary Table 4). Consistent with the proposed hypothesis, Lactobacillus reuteri #5529 (number refers to oligotype), Lactobacillus johnsonii #5433 and Lactobacillus intestinalis #0092 were substantially enriched in the jejunum independent of the genotype, when compared to the colon (Fig. 2f).
We first assessed whether TLR2 agonists—cell wall components of several Lactobacillus strains23—are relevant bacterial signals in Tet2−/− mice (Extended Data Fig. 6a), and then showed that the TLR2 agonist Pam3CSK4 was sufficient to induce extensive myelo-proliferation in symptom-free Tet2f/fVavcre mice but not in littermate controls (Fig. 2g–h and Extended Data Fig. 6b–d), without affecting intestinal barrier integrity (Extended Data Fig. 6e). Of note, L. reuteri #5529 and L. johnsonii #5433 are also found in the small intestine of littermate control mice (Fig. 2f) and 16S microbiome profiling failed to detect significant differences in microbial structures between genotypes (Extended Data Fig. 7a–d). Furthermore, variations in disease penetrance were observed among cohoused Tet2f/fVavcre mice (Extended Data Fig. 7e). These observations indicate that changes in microbial structures do not drive PMP and that systemic microbial signals, such as TLR2 agonists, may be sufficient to promote PMP independently of intestinal barrier dysfunction in Tet2-deficient mice. This is consistent with previous epidemiological studies that report an association between clonal expansion and myeloid malignancies with antecedent chronic inflammatory conditions of infectious origin24.
To demonstrate that microbial signals are required for the development of PMP, we raised Tet2−/− mice under germ-free conditions. Forty-week-old Tet2−/− germ-free mice failed to show signs of PMP in the peripheral blood and the spleen, in contrast to age-matched specific-pathogen-free (SPF)-raised Tet2−/− mice (Fig. 3a, b and Extended Data Fig. 8a, b). Furthermore, treatment with antibiotics (Fig. 3c) both prevented (Extended Data Fig. 8c) and reversed PMP (Fig. 3d, e and Extended Data Fig. 9a–j) in Tet2−/− mice. The longitudinal study that was performed in the presence of antibiotics and after antibiotic withdrawal (Fig. 3c), using the peripheral-blood PMP marker (Fig. 3f, g and Extended Data Fig. 8d), indicated that the potential for PMP remains and is directly linked to the presence of bacterial signals.
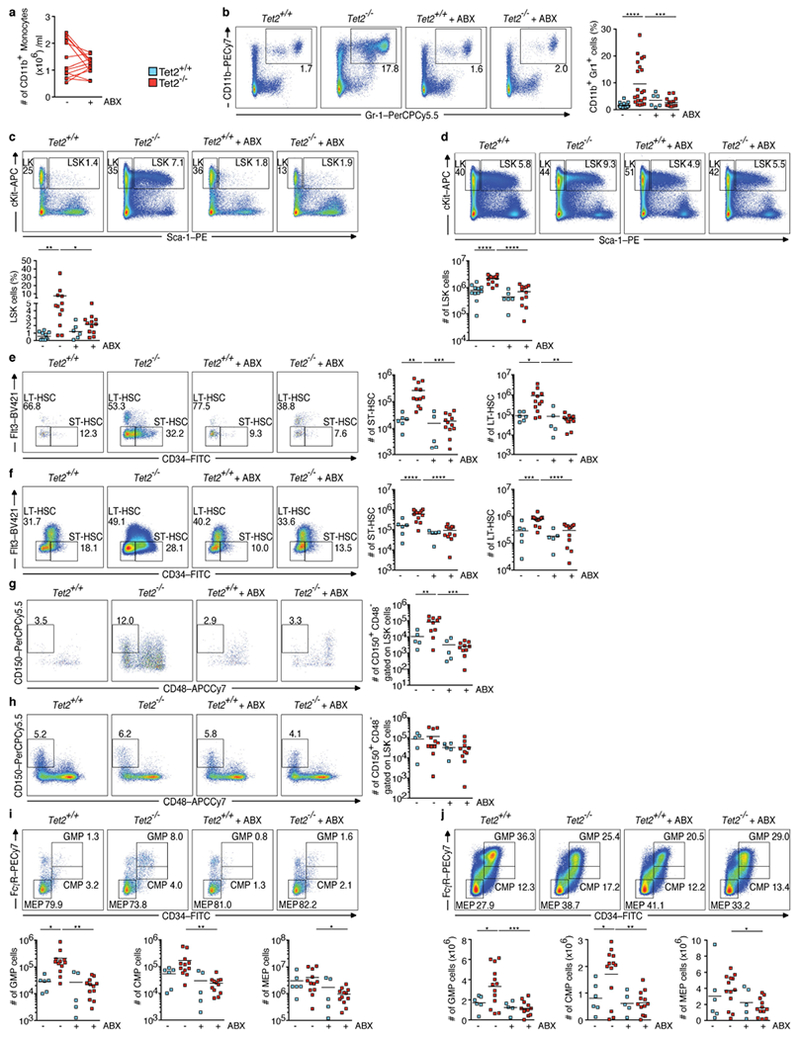
Fig. 3 |. Microbial signals are required for PMP in Tet2−/− mice.
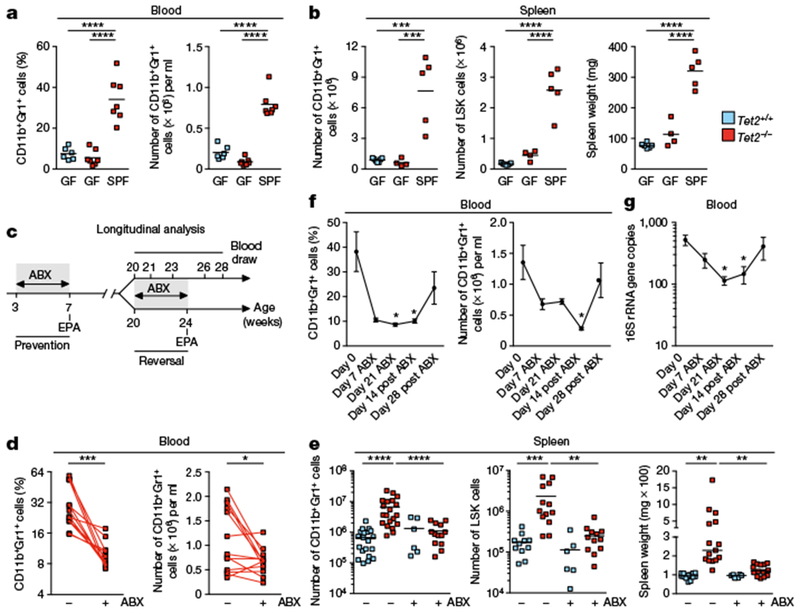
a, b, Germ-free (GF), SPF-housed (SPF) Tet2−/− mice that are over 40 weeks old, and littermate controls, analysed for percentage (a, left) and numbers (a, right) of CD11b+Gr1+ myeloid cells (n = 6 (GF Tet2+/+), 7 (GF Tet2−/−) or 7 (SPF Tet2−/−) mice), and numbers of CD11b+Gr1+ myeloid cells (b, left), LSK cells (b, middle), and spleen weight (b, right), (n = 7 (GF Tet2+/+), 4 (GF Tet2−/−) or 5 (SPF Tet2−/−) mice). c, Schematic for antibiotics (ABX) treatment regimen. Longitudinal analysis described in f, g and Extended Data Fig. 8d; prevention described in Extended Data Fig. 8c; and reversal described in d, e and Extended Data Fig. 9a–j. EPA, end point analysis. d, e, Tet2−/− mice with PMP that are over 20 weeks old, and littermate controls, analysed for percentage (d, left) and numbers (d, right) of CD11b+Gr1+ myeloid cells (n = 13 mice). Lines connect values obtained from the same mouse sampled before (−) and after (+) ABX treatment. Two-tailed paired t-test. e, Numbers of CD11b+Gr1+ myeloid cells (left; n = 20 (Tet2+/+, no ABX treatment), 20 (Tet2−/−, no ABX treatment), 6 (Tet2+/+, with ABX treatment) and 13 (Tet2−/−, with ABX treatment) mice), LSK cells (middle; n = 11 (Tet2−/−, no ABX treatment), 13 (Tet2−/−, no ABX treatment), 6 (Tet2−/− with ABX treatment) and 12 (Tet2−/−, with ABX treatment) mice) and spleen weight (right; n = 14 (Tet2+/+, no ABX treatment), 15 (Tet2−/−, no ABX treatment), 6 (Tet2+/+, with ABX treatment) and 14 (Tet2−/−, with ABX treatment) mice). f, g, Tet2−/− mice analysed for frequency (f, left) and number (f, right) of CD11b+Gr1+ myeloid cells and (g) 16S gene copies before, during and after ABX treatment (n = 7 mice). Mean ± s.e.m., repeated measures one-way ANOVA, Sidak’s post hoc test. a, b, e, Centre is mean, one-way ANOVA, Sidak’s post hoc test. Data are representative of at least two independent experiments; *P < 0.05, **P < 0.01, ***P < 0.001, ****P < 0.0001.
Interleukin 6 (IL-6) is a critical activator of myelopoiesis in response to systemic bacterial dissemination15 and can be upregulated in chronic myeloproliferative disease in humans25. Accordingly, IL-6 was significantly increased in both the plasma and spleen of Tet2−/− mice with PMP, as compared to littermate controls (Fig. 4a and Extended Data Fig. 10a). The increase in IL-6 was microbiota-dependent and induced upon DSS and TLR2-agonist treatment in symptom-free Tet2-deficient mice that subsequently developed PMP (Fig. 4a and Extended Data Fig. 10a–d). Furthermore, peripheral-blood myeloid cell expansion correlated with IL-6 levels in plasma (Fig. 4b and Extended Data Fig. 10e). We next investigated the role of IL-6 in PMP in the context of Tet2 deficiency in vitro and in vivo. Of note, IL-6 is used in in vitro HSC self-renewing assays (Fig. 1a and Extended Data Fig. 1i26). The neutralization of IL-6 significantly reduced the increased self-renewing capacity of Tet2−/− haematopoietic progenitors in vitro, which indicates a critical role for IL-6 in PMP, but IL-6 neutralization did not affect the limited self-renewing capacity of Tet2-sufficient haematopoietic progenitors (Fig. 4c and Extended Data Fig. 10f, g). Consistent with this finding, IL-6Rα surface expression was significantly increased on Tet2−/− granulocyte–macrophage progenitors (GMPs) as compared to Tet2+/+ GMPs (Fig. 4d and Extended Data Fig. 10h) and associated with an increased sensitivity of Tet2−/− GMPs to IL-6 as assessed by Stat3 phosphorylation (Fig. 4e and Extended Data Fig. 10i). Although an increase in IL-6Rα expression was observed in germ-free Tet2−/− GMPs, the cellular expansion of IL-6Rα+ GMPs occurred only in SPF-housed Tet2−/− mice (Fig. 4f). This suggests that the increase in IL-6Rα expression is intrinsic to the cell and independent of microbial signals, whereas the expansion of IL-6Rα+ GMPs requires the microbiota and IL-6 (Extended Data Fig. 8b). Importantly, megakaryocyte-erythroid progenitors did not display increased IL-6Rα expression and signalling (Fig. 4d, e) and consequently failed to expand in Tet2−/− mice under SPF conditions (Fig. 4f). These data suggest that the development of PMP requires an exogenous microbial signal and an upregulation of IL-6Rα on GMPs that is driven in a cell-autonomous manner by Tet2 deficiency. Of note, increased IL-6 production in the plasma and spleen (Fig. 4a and Extended Data Fig. 10a) of Tet2−/− mice correlated with an increase in the number of myeloid cells capable of producing IL-6 (Extended Data Fig. 10j), rather than an increase in IL-6 production by mature myeloid cells (Extended Data Fig. 10k, l). No increase in IL-6Rα expression in mature splenic Tet2−/− CD11b+Gr1+ myeloid cells was observed (Extended Data Fig. 10m), which suggests that IL-6-mediated PMP in Tet2-deficient mice is determined at the myeloid progenitor stage. Consistent with this observation, Tet2f/fVavcre but not Tet2f/fLysMcre mice developed PMP (Extended Data Figs. 5d–f, 10n). Finally, in vivo IL-6 neutralization experiments established that IL-6 was required for PMP to develop in Tet2−/− mice (Fig. 4g–i and Extended Data Fig. 10o) independently of barrier function restoration (Extended Data Fig. 10p, q). These findings provide experimental support to studies in humans that suggest a role for IL-6 in the pathogenesis of haematological malignancies27.
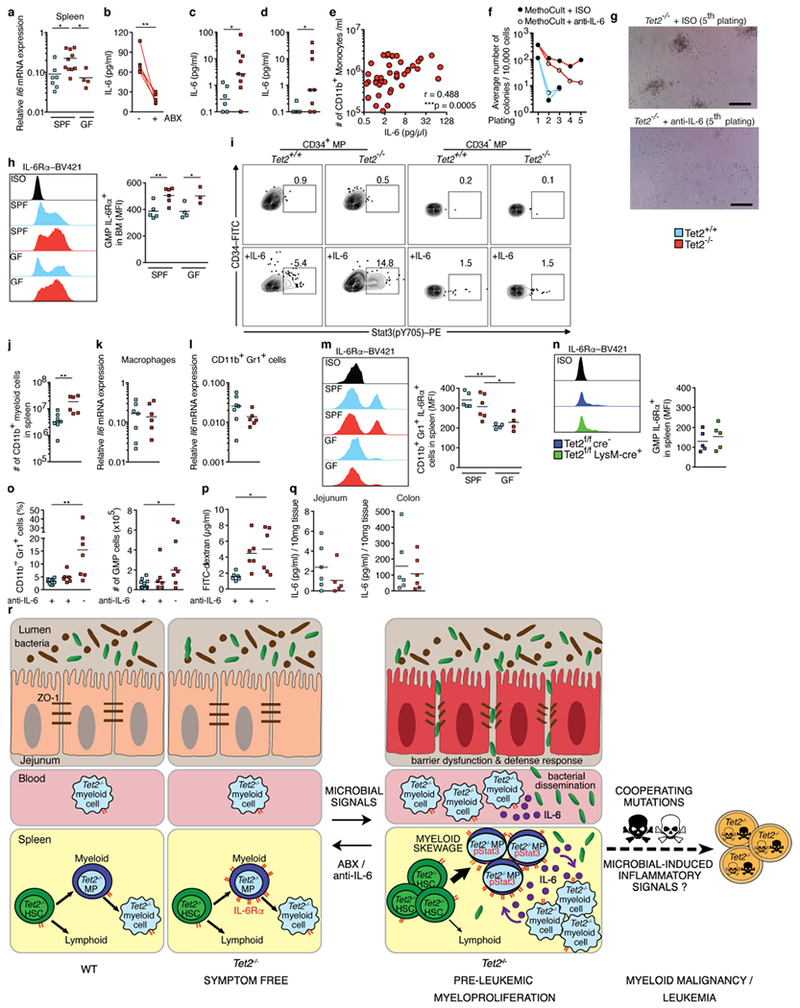
Fig. 4 |. Bacteria-induced IL-6 is required for PMP in Tet2−/− mice.
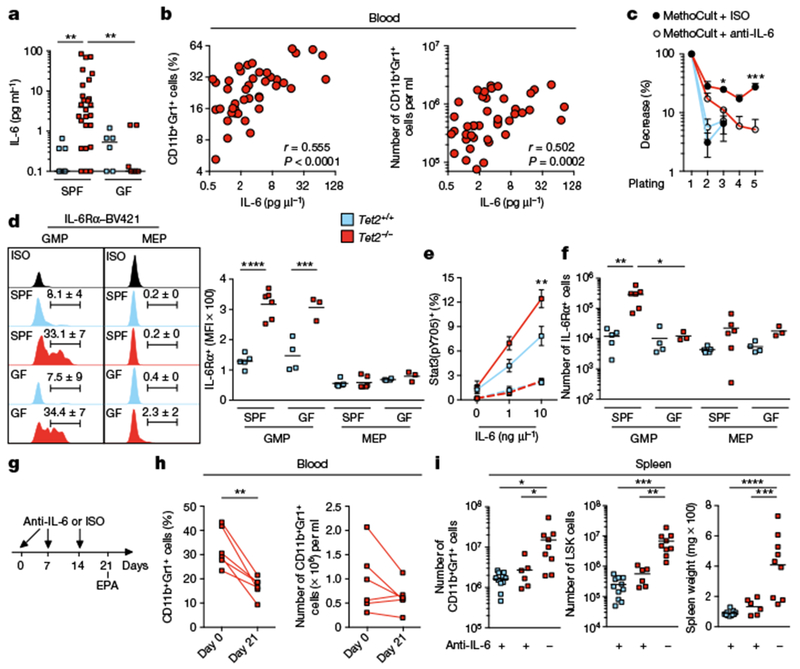
a, IL-6 cytokine levels in blood plasma (n = 7 (Tet2+/+, SPF), 26 (Tet2−/−, SPF), 6 (Tet2+/+, GF) or 7 (Tet2−/−, GF) mice). Centre is median, Kruskal-Wallis, Dunn’s post hoc test. b, IL-6 cytokine levels in blood plasma correlate with the frequency (left) and numbers (right) of CD11b+Gr1+ myeloid cells (n = 49 mice). Pearson correlation test. c, In vitro HSC self-renewal colony-forming assay of haematopoietic progenitor of the spleen from Tet2−/− mice (red lines) and littermate controls (blue lines) in the presence of anti-IL-6 antibody (anti-IL-6) or isotype control (ISO) after the first replating (n = 3 mice). d, Representative histograms, percentages and quantification of mean fluorescence intensity (MFI) of IL-6Rα+c-Kit+Sca-1− (lineage−c-Kit+ (LK) gated) CD34+FcγRIII/II (FcγRIII and FcγRII are also known as CD16 and CD32, respectively) GMPs and IL-6Rα+ LK gated CD34−FcγRIII/II− megakaryocyte-erythroid progenitors (MEP) from the spleen (n = 5 (Tet2+/+, SPF), 6 (Tet2−/−, SPF), 4 (Tet2+/+, GF) or 3 (Tet2−/−, GF) mice). e, Stat3 phosphorylation (pY705) after 30-min stimulation with IL-6 in splenic c-Kit+Sca-1− (LK gated) CD34+ (solid lines) and CD34− (dotted lines) myeloid progenitors (n = 5 (blue line), 6 (red line) and 4 mice (dotted lines)). f, Numbers of IL-6Rα+ GMP and megakaryocyte-erythroid progenitors from the spleen (n = 5 (Tet2+/+, SPF), 6 (Tet2−/−, SPF), 4 (Tet2+/+, GF) or 3 (Tet2−/−, GF) mice). g, Schematic for anti-IL-6 treatment of Tet2−/− mice with PMP that are over 20 weeks old, and littermate controls. See data in h, i and Extended Data Fig. 10o, p. h, Percentage (left) and numbers (right) of CD11b+Gr1+ myeloid cells at day 0 and day 21 (n = 6 mice). Lines connect values obtained from the same mouse sampled before and after anti-IL-6 treatment. Two-tailed paired t-test. i, Numbers of CD11b+Gr1+ myeloid cells (left), LSK cells (middle) and spleen weight (right) (n = 11 (Tet2+/+, with anti-IL-6), 6 (Tet2−/− with anti-IL-6) or 9 (Tet2−/−, without anti-IL-6) mice). c, e, Mean ± s.e.m., two-way ANOVA, Sidak’s post hoc test. d, f, i, Centre is mean, one-way ANOVA, Sidak’s post hoc test. Data are representative of at least two independent experiments. *P < 0.05, **P < 0.01, ***P < 0.001, ****P < 0.0001.
Our study demonstrates a critical role for microbial-mediated inflammatory (IL-6) signals in the development of PMP in the context of Tet2 deficiency. More specifically, these data suggest an IL-6 dependent cycle that is engaged upon bacterial translocation and leads to PMP in Tet2−/− mice through the expansion of GMPs that express high levels of IL-6Rα in the absence of Tet2 (Extended Data Fig. 10r for a schematic of this model). The mechanisms through which Tet2 deficiency in haematopoietic cells leads to a microbiota-dependent impairment of gut barrier function remain to be addressed.
This work raises the question ofwhether microbial-dependent inflammatory mediators, such as IL-6, are critical contributors to myeloid malignancies in humans by promoting PMP in patients with somatic TET2 mutations. Furthermore, our findings—in combination with a report indicating that the restoration of Tet2 expression after PMP has developed prevents secondary evolution towards leukaemia in Tet2−/− mice28—suggest that blocking inflammatory bacterial signals in patients with TET2 deficiency and PMP may reduce the risk of progression to haematopoietic malignancies. Whether bacterial infections and events promoting the disruption of intestinal barrier function can create a permissive environment that evokes the acquisition of cooperative oncogenic mutations that lead to the development of leukaemia10 remains to be determined. Irrespectively, our study will motivate a new line of investigations and the design of novel therapeutic strategies that target IL-6 in patients with PMP linked to somatic TET2 mutations to revert mye-loproliferation and prevent the development of myeloid malignancies.
METHODS
Mice.
Tet2−/− mice have previously been described8. Tet2f (B6;129S-Tet2tm1.1Iaai/J) mice were crossed with the haematopoietic-specific Vav-cre line (B6.Cg-Tg(Vav1-icre)A2Kio/J), the villus and crypt small and large intestinal epithelial cell-specific Villin-cre line (B6.Cg-Tg(Vil1-cre)997Gum/J), and the myeloid cell lineage-specific LysM-cre line (Lyz2tm1(cre)Ifo)), respectively. For the experiments, >20-week-old Tet2−/− mice and littermate controls were used, unless indicated otherwise. Both female and male mice were used for experiments; no notable sex-dependent differences were found for the reported experiments. Mice were housed at the University of Chicago animal facilities under specific pathogen-free (SPF) conditions, where cages were changed on a weekly basis; ventilated cages, bedding, food and water (non-acidified) were autoclaved before use, ambient temperature maintained at 23 °C, and 5% Clidox-S was used as a disinfectant. Experimental breeding cages were randomly housed on two different racks in the vivarium, and all cages were kept on automatic 12-h light/dark cycles. Germ-free Tet2−/− mice were generated by two-stage embryo transfer, as previously described29, bred to germ-free C57BL/6 wild-type mice to generate littermate controls and maintained in flexible film isolators in McMaster’s Axenic Gnotobiotic Unit. Animal husbandry for both SPF and germ-free facilities, and experimental procedures, were performed in accordance with Public Health Service policy and approved by the University of Chicago Institutional Animal Care and Use Committees and the McMaster University Animal Care Committee.
Gnotobiotic animal husbandry.
Food, bedding and water (non-acidified) were autoclaved before transfer into the sterile isolators. Cages within isolators were changed weekly, and all the cages in the vivarium were kept on 12-h light/dark cycles. Microbiology testing of faecal (experimental mice) or of caecum samples (sentinel mice; aerobic and anaerobic culture, 16S qPCR) was performed every other week to confirm germ-free status.
In vivo anti-IL-6 antibody treatment.
Peripheral blood of >20-week-old Tet2−/− mice and littermate controls was analysed for myelopoiesis by flow cytometry. Tet2−/− mice selected with increased myelopoiesis (>16% CD11b+Gr1+) in peripheral blood, and littermate controls, were subjected to weekly intraperitoneal injections of 1 mg anti-mouse IL-6 (MP5-20F3, Bio X Cell, BE0046) or 1 mg rat IgG isotype control (HRPN, Bio X Cell, BE0088), respectively. Two Tet2−/− mice that did not respond to the anti-mouse IL-6 treatment (based on blood screening) were excluded from the study. After three weeks, mice were euthanized and analysed for signs of PMP in the peripheral blood and spleen.
In vivo Pam3CSK4 treatment.
Peripheral blood of >20-week-old Tet2f/fVavcre mice and littermate controls was analysed for myelopoiesis by flow cytometry. Mice selected with no signs of myelopoiesis (<16% CD11b+Gr1+) in peripheral blood and <30 g body weight were injected intraperitoneally with 100 μg TLR1/2 agonist Pam3CSK4 (InvivoGen, tlrl-pms) every four days. On day 16, mice were euthanized and analysed for signs of PMP in the peripheral blood and spleen.
DSS-induced colitis model.
Peripheral blood of >20-week-old Tet2f/fVavcre mice and littermate controls was analysed for myelopoiesis by flow cytometry. Mice selected with no signs of myelopoiesis (< 16% CD11b+Gr1+) in peripheral blood and <30 g body weight underwent DSS colitis treatment as described30. In brief, mice received 3% DSS (MW: 36,000–50,000; MP Biomedicals) (w/v) in drinking water for 7 days and were then switched to regular drinking water. Weight was recorded every other day throughout the study. Mice were euthanized 30 days post-DSS feeding and analysed for PMP.
Antibiotic treatment.
Mice were treated with an antibiotic cocktail as previously described31. All antibiotics used are listed as follows (concentration used, company, catalogue number). In detail, in the first week mice received a daily intragastric gavage with 100 μl of a mixture of kanamycin (4 mg ml−1, Sigma-Aldrich, 60615), gentamicin (0.35 mg ml−1, Sigma-Aldrich, G1914), colistin (8500 U ml−1, Sigma-Aldrich, C4461), metronidazole (2.15 mg ml−1, Sigma-Aldrich, M3761), and vancomycin (0.45 mg ml−1, Sigma-Aldrich, V2002). For the following three weeks antibiotics were administered in the autoclaved (non-acidified) drinking water at 50-fold dilution except for vancomycin, which was maintained at 0.5 mg ml−1. Autoclaved (non-acidified) water was used to dissolve antibiotics. Antibiotic water was prepared fresh and replaced weekly.
In vivo intestinal permeability measurement.
An in vivo assay to determine intestinal epithelial barrier permeability was performed using a FITC-labelled dextran method as previously described32. In detail, mice were withdrawn from both food and water for 4 h, weighed and then received 60 mg per 100 g body weight of a freshly prepared FITC–dextran (MW 4,000, Sigma-Aldrich, 46944) solution diluted to 60 mg ml−1 in sterile PBS by oral gavage. Blood was collected by cheek bleeding (~300–500μl) 3 h post-gavage and plasma was collected by centrifugation of blood samples at 2,000g for 10 min at 4 °C. Fifty microlitres of blood plasma was transferred (in duplicate) into a flat-bottom 96-well plate (Corning, 3370) and analysis of FITC–dextran concentration was performed with a fluorescence spectrophotometer setup (Synergy, BioTek) with emission and excitation wavelengths of520 nm and 490 nm, respectively. Plasma samples were protected from light at all times. FITC–dextran concentration was determined from a standard curve generated by serial dilution of FITC–dextran.
Tissue collection and cell purification.
Spleen, MLNs and bones (tibia and femur, both sides) were collected under a laminar flow hood with autoclaved tools under sterile conditions and weight of spleen was recorded. Peripheral blood was collected by cheek bleeding (after sterilizing cheeks with 70% ethanol wipes) into EDTA-coated (Thermo Fisher Scientific, MT-46034CI) 1.5-ml tubes. To obtain a single cell suspension, spleen and MLNs were mashed through a 70-μm cell strainer and bone marrow was flushed out with syringes filled with PBS and also mashed through a 70-μm cell strainer. Erylysis of 10 μl peripheral blood, spleen and bone marrow was performed using the Mouse Erythrocyte Lysing Kit (R&D Systems, WL2000). For analysis of splenic and bone marrow haematopoietic precursors the mouse Lineage Cell Depletion Kit (Miltenyi Biotec, 130-090-858) was used.
Antibodies and flow cytometry.
Single cell suspensions were pelleted and resuspended in FACS buffer (PBS, 2% FCS) for immunostaining and subsequent flow cytometry analysis. Excluding the haematopoietic progenitor cell staining, all cell suspensions were incubated with Fc Block (BD, 553142) before staining with fluorophore-conjugated monoclonal antibodies. All fluorophore-conjugated antibodies used are listed as follows (clone, company, catalogue number): Gr-1 (RB6-8CA, eBioscience, 45-5931-80), c-Kit (2B8, BD Biosciences, 553356), CD11b (M1/70, eBioscience, 25-0112-82), CD34 (RAM34, eBioscience, 11-0341-85), CD16/CD32 (FcyRIII/II) (93, eBioscience, 25-0161-81), CD19 (1D3, BD Biosciences, 563148), CD3 (17A2, BD Biosciences, 564009), B220 (RA3-6B2, BD Biosciences, 563708), TER-119 (TER-119, BD Biosciences, 563323), CD48 (HM48-1, BD Biosciences, 561242), CD135 (A2F10.1, BD Biosciences, 562898), Ly-6C (AL-21, BD Biosciences, 560595), Sca-1 (D7, Biolegend, 108108), CD150 (TC15-12F12.2, Biolegend, 115922), CD126 (D7715A7, BD Biosciences, 740038) and Rat IgG2b (R35-38, BD Biosciences, 562603). Aqua LIVE/DEAD Fixable Aqua Dead Cell Stain Kit was purchased from Life Technologies (L34966). CD11b+Gr1+ myeloid cells were gated on live CD45+ cells and lymphocytes are defined as live CD45+ gated CD11b− cells. For phospho-flow, cells were stimulated with 0, 1 or 10 ng μl−1 murine IL-6 (Biolegend, 575704) for 30 min at 37 °C, 5% CO2, fixed with Fix Buffer I (BD Biosciences, 557870) for 10 min at 37 °C, stained with Sca-1 (Biolegend, 108126) for 20 min at 4 °C and permeabilized with Perm Buffer III (BD Biosciences, 558050) and stained for phospho-Stat3 (pY705, BD Biosciences, 612569), c-Kit, CD34, CD11b, Gr1, CD19 and B220 for 30 min at room temperature. Flow cytometry analysis was performed with a nine-colour BD FACSCanto (BD Biosciences) and Aria Fusion (BD Biosciences; for cell sorting) using FlowJo software (Treestar).
RNA processing and RT-PCR.
Small and large intestines were removed and transferred into cold PBS. A piece (~5 mm) of whole intestinal tissue (duodenum, jejunum, ileum and colon) was soaked in RNAlater (Qiagen, 76106) at 4 °C for 48 h and then stored at −80 °C until further analysis. For RNA extraction a Tissue-Tearor Homogenizer (Biospec) was used. RNA was prepared using the RNeasy Mini Kit (Qiagen, 74136). cDNA synthesis was performed using GoScript (Promega, A5004) according to the manufacturer’s instructions. Expression analysis was performed in duplicate via RT–PCR on a Roche LightCycler 480 using SYBR Green (Clontech, 639265). Expression levels were quantified and normalized to Gapdh expression using the following primer pairs (all mouse):
Gapdh forward: 5′-AGGTCGGTGTGAACGGATTTG-3′; Gapdh reverse: 5′-TGTAGACCATGTAGTTGAGGTCA-3′; Dsp forward: 5’-TACACCTCAGGGCTGGAAAC-3’; Dsp reverse: 5′-GGGCCAGTCTTAGCTCCTCT-3′; Retnlb forward: 5′-ATGAAGCCTACACTGTGTTTCC-3′; Retnlb reverse: 5′-CTGCCAGAAGACGTGACACT-3′; Tjp1 forward: 5′-ACTCCCACTTCCCCAAAAAC-3’; Tjp1 reverse: 5′-CCACAGCTGAAGGACTCACA-3′; Ang4 forward: 5′-GGTTGTGATTCCTCCAACTCTG-3′; Ang4 reverse: 5′-CTGAAGTTTTCTCCATAAGGGCT-3′; Ocln forward: 5′-ACTGGGTCAGGGAATATCCA-3’; Ocln reverse: 5′-TCAGCAGCAGCCATGTACTC-3’; Il6 forward: 5′-CCAAGAGGTGAGTGCTTCCC-3′; Il6 reverse: 5′-CTGTTGTTCAGACTCTCTCCCT-3′
RNA sequencing processing and data analysis.
RNA sequencing libraries were prepared using the Illumina TruSeq protocol and sequenced with single-end 100-bp reads on an Illumina HiSeq2500. Adaptor sequences and low quality score bases were first trimmed using Trim Galore. The resulting reads were aligned to the mouse genome reference sequence (GRCm38/mm10) using the TopHat2 software package33 with a Top Hat transcript index from Ensembl. The number of read fragments overlapping with annotated exons of genes was tabulated using HTSeq34 using the following parameters: -q -m intersection-nonempty -s no. Non-coding or low-expressed genes with an average read count lower than 10 were discarded, resulting in 15,045 genes in total. Using normalized gene counts for three Tet2+/+ and three Tet2−/− samples for each of the four tissue compartments, we identified differentially expressed genes using the R package limma35. Our linear model had the following design: Expression ~ Genotype: Tissue. Once we identified jejunum as the tissue with the largest differences in gene expression between Tet2+/+ and Tet2−/− samples, we increased our sample size for this tissue for a total of seven Tet2+/+ and seven Tet2 −/− jejunum samples. We corrected for batch effects between the first and second set of samples using ComBAT36. We considered a gene as differentially expressed if statistically supported at a Q-value37 false discovery rate <0.1 and a |log2(fold change)|>0.5.
Bacterial cultures and species identification.
Organs were aseptically removed, weighed and transferred immediately to an anaerobic chamber (Coy Systems) for manual homogenization in 300 μl of pre-reduced (autoclaved, sterile filtered (0.22 μm), oxygen reduced with vacuum degasification) PBS + 0.1% L-cysteine (Sigma-Aldrich, 168149). Homogenates (100 μl per plate) were plated onto BD BBL Brucella agar with 5% sheep blood, Hemin and vitamin K1 agar plates (Fisher Scientific, L97848) and incubated anaerobically. For aerobic cultures tissue homogenates were plated onto Teknova brain heart infusion (BHI) agar plates (Fisher Scientific, 50-841-098) and incubated aerobically. Plates were sealed with parafilm and incubated upside down and after 48 h (aerobic) or 120 h (anaerobic) the colony-forming units (CFUs) were quantified. Results are displayed as CFUs per gram (g) tissue.
Representative bacterial colonies grown on agar plates were picked with sterile pipette tips and stored at −80 °C until analysis. At day of analysis picked bacterial colonies were thawed at room temperature, resuspended with 6 μl of sterile water and bacteria were lysed by heating up the samples to 95 °C for 10 min. Samples were subsequently cooled down to 4 °C and then the DNA (2 μl) was used as template DNA in PCR reactions amplifying the 16S rRNA gene using universal bacterial 16S rRNA primers (27F, 5′-AGAGTTTGATCMTGGCTCAG-3′ and 1525R, 5′-AAGGAGGTGATCCAGCC-3′) with reaction conditions: 95 °C for 5 min followed by 35 cycles of 95 °C for 30 s, 55 °C for 30 s, 72 °C for 2 min and then 72 °C for 20 min. The amplification product (10 μl) was incubated with 2 μl ExoSAP-IT (Thermo Fisher, 78200.200.UL) for 37 °C for 15 min, followed by 80 °C for 15 min. Amplicons were sequenced by capillary sequencing, and the resulting sequences were analysed using BLASTN and the 16S ribosomal RNA sequences database for species identification38.
Bacterial lysates.
Individual bacterial strains were grown up anaerobically in lactobacillus MRS broth (Fisher Scientific, DF0881-17-5) for 48 h, and sonicated for 3 × 20 s in cold PBS. The homogenate was centrifuged at 10,000g for 20 min to remove debris and filtered through a 0.2-μM filter. 16S copies of the homogenate were quantified by qPCR using the universal primers (340F, 5′-ACTCCTACGGGAGGCAGCAGT-3′) and (514R, 5′-ATTACCGCGGCTGCTGGC-3′) and purified genomic DNA from Blautia producta (Prevot) (ATCC, 27340D-5) as a standard39.
HEK-TLR2 Quanti-Blue secreted embryonic alkaline phosphatase reporter assay.
HEK-Blue TLR2 cells (provided by the Gajewski laboratory) were plated in HEK-Blue detection medium (InvivoGen, hb-det2) containing a substrate for alkaline phosphatase at 5 × 10⁴ cells per well in 96-well plates and incubated with different concentrations of Pam3CSK4 (InvivoGen, tlrl-pms), LPS (InvivoGen, tlrl-peklps) or bacterial lysates normalized to 16S rRNA copies. Alkaline phosphatase activity was measured after 5 h by reading optical density at 620 nm.
DNA extraction from tissue or faeces for 16S qPCR.
Total DNA was extracted from organs (collected under sterile conditions, ~30 mg spleen, ~30 mg MLN and 50 μl peripheral blood) and faeces using the DNeasy Blood & Tissue Kit (Qiagen, 69504) and the Fast DNA Stool Mini Kit (Qiagen, 51604), respectively. Quantitative PCR (qPCR) of 16S rRNA-encoding genes was performed as previously described30. In brief, qPCR was performed on a Roche Light Cycler 480 (Roche Scientific) using the primers (340F, 5′-ACTCCTACGGGAGGCAGCAGT-3′) and (514R, 5′-ATTACCGCGGCTGCTGGC-3′). Reactions were run at 95 °C for 3 min, followed by 40 cycles of 95 °C for 15 min and 63 °C for 60 s. Specific amplification of targets was quantified using dilution curves of a purified pCR4-TOPO vector (Invitrogen) containing a cloned 16S rRNA-encoding gene from Blautia producta (Prevot) (ATCC, 27340D-5) as a standard39 for both blood and faeces. Standards ranging in concentration from 108–100 plasmid copies per pl were run in parallel with our samples for both blood and faeces during each qPCR run. Using those results, a standard curve was generated to quantify the number of copy numbers within the samples. To determine the bacterial load in the faeces samples, the results were normalized to faecal weight. Bacterial 16S rRNA gene qPCRs from MLN and spleen were normalized to the host murine Ifnb1 gene (forward: 5′-CCATCCAAGAGATGCTCCAG-3′; reverse 5′-GTGGAGAGCAGTTGAGGACA-3′). C57BL/6 wild-type germ-free mice served as negative control (Fig. 1b).
16S rRNA amplicon library preparation, sequencing and data analysis.
Faeces, jejunal and colon contents, and mucosal scrapings from the jejunum were collected and snap-frozen in liquid nitrogen. Bacterial DNA was extracted using the Fast DNA Stool Mini Kit (Qiagen, 51604). 16S rRNA amplicon library preparation and sequencing was performed as previously described30. Raw sequencing data were de-multiplexed, and partially overlapping paired-end reads were merged using illumina-utils40. Mismatches at the overlapping regions of pairs were resolved using the base with the higher Q-score, and the merged sequences were kept for downstream analyses only (1) if they contained less than three mismatches at the overlapping region, and (2) if 66% of the bases in the first half of each read had an average Q-score of 30. The quality-filtered reads were partitioned into ecologically relevant units using minimum entropy decomposition (MED)41 with default parameters. Using Shannon entropy, MED resolves a given amplicon dataset iteratively into oligotypes, which are able to describe differences between microbial groups at a single-nucleotide resolution22. The taxonomy of oligotypes was inferred through GAST42. The metaMDS function in the vegan43 library was used to generate ordinations of samples based on their oligotype profiles using non-metric multidimensional scaling with Bray–Curtis distances, and the envfit function in vegan with 999 permutations was used to test whether the genotype or the source of samples were significantly associated with differences between microbiomes. The pheatmap library for R was used to generate heat-map displays of the sample oligotype profiles, and the hierarchical clustering of samples in heat maps employed Bray–Curtis distances, and the average linkage algorithm.
Analysis of cytokine production in blood plasma and intestinal explants.
Blood was collected by cheek bleeding (after sterilizing cheeks with 70% ethanol wipes) in EDTA (Thermo Fisher Scientific, MT-46034CI)-coated tubes, centrifuged at 2,000g for 10 min at 4 °C and plasma was stored at −80 °C until cytokine analysis. One-centimetre pieces from the jejunum and colon were collected, opened longitudinally, washed in PBS and explants were cultured in 500 μl RPMI 1640 medium (Fisher Scientific, MT-10-040-CV) containing 10% FBS, 200 U ml−1 penicillin, and 200 μg ml−1 streptomycin (MP Biomedicals, 091670249) for 48 h. The IL-6 cytokine amount in blood plasma and in supernatants of intestinal explants was determined with BioPlex multianalyte technology (Biorad) according to manufacturer’s instructions.
In vitro haematopoietic methylcellulose colony-forming assay.
Similar to a related study9, lineage depleted (mouse Lineage Cell Depletion Kit (Miltenyi Biotec, 130-090-858) haematopoietic progenitors of the bone marrow and the spleen were seeded in duplicate in cytokine-supplemented methylcellulose (MethoCult, M3434, STEMCELL Technologies) at a density of 5,000 cells per plate (bone marrow) or 25,000 cells per plate (spleen). Colonies were counted every 7 days and 10,000 cells per plate were seeded for replatings. The average number of colonies per 10,000 plated cells is shown for 5 sequential platings. For anti-mouse IL-6 antibody (MP5-20F3, Bio X Cell, BE0046) and isotype (HRPN, Bio X Cell, BE0088) treatment, anti-IL-6 antibody or isotype was freshly added to the cytokine-supplemented methylcellulose medium before every replating at a concentration of 100 μg ml−1.
Haematoxylin and eosin staining.
Jejunum was flushed with cold PBS (GE Healthcare Life Science, SH30028.02) followed by immediate flushing with 10% formalin (Fisher Scientific, L14416). A section of ~3 cm from jejunum was cut with a razor blade, cut open longitudinally and pinned out with needles in wax boxes. Tissue was fixed for 24 h at room temperature and pre-embedded in 2% agar (Sigma, A7921). Haematoxylin and eosin staining was performed on 5-μm paraffin-embedded intestinal sections. The haematoxylin and eosin stained slides were digitized (objective: ×20; camera: CIS 3CCD 2 Mega Pixel) with the Pannoramic MIDI Scan System (3DHISTECH). The Panoramic viewer software (3DHISTECH) was used for imaging.
Immunofluorescence staining.
For ZO-1 staining, jejunum and proximal colon was dissected and cross-sections were frozen in optimum cutting temperature compound (Tissue-Tek). Frozen sections of 5-μm thicknesses were cut and fixed in 1% paraformaldehyde in 1× PBS for 30 min at room temperature. After washing in PBS, three 5-min incubations in PBS with 50 mM NH4Cl were performed, followed by permeabilization in PBS with 0.5% NP-40 for 20 min, and three additional 5-min washes in PBS. Tissue sections were then incubated with mouse IgG ZO-1 monoclonal antibody (ZO1-1A12, Thermo Fisher Scientific, 33-9100) in PBS with 10% normal donkey serum overnight at 4 °C, washed five times with PBS with 1% normal donkey serum (5 min each) and incubated with Alexa Fluor 594-conjugated donkey anti-mouse (IgG, Jackson ImmunoResearch, 715-586-151) and Hoechst 33342 (ThermoFisher Scientific, H3570) for 1 h at room temperature. After incubation, tissue was washed five times with PBS with 1% normal donkey serum (5 min each) and mounted in Pro-Long Gold slides followed by imaging using an Olympus IX81 inverted microscope with a Photometrics CoolSNAP HQ2 camera. For cleaved caspase 3 and TUNEL staining, jejunum was dissected and cross-sections were fixed in 10% formalin, and then processed for paraffin sectioning. Five-micrometre sections were dewaxed by immersion in xylene and hydrated by serial immersion in ethanol and PBS. Antigen retrieval was performed by incubating sections in a pressure cooker (Cuisinart) for 15 min in Target Retrieval Solution (DAKO, S1699). Sections were washed with PBS (twice for 10 min), and blocking buffer (TBS containing 10% BSA (EMD Millipore Sigma, 82-045-1) and OmniPur Triton X-100 (0.3%, EMD Millipore Sigma, 9400) was added for 1 h. Sections were incubated with anti-pan-keratin (dilution 1:200, ABCAM, ab6401) and anti-cleaved caspase 3 (dilution 1:500, Cell Signaling Technology, 9661S) antibody in blocking buffer overnight at 4 °C and then incubated with goat anti-mouse IgG1 Alexa Fluor 488 (Thermo Fisher Scientific, A21121) or goat anti-rabbit Alexa Fluor 594 (Thermo Fisher Scientific, A11037) labelled secondary antibodies (dilution 1:400, Thermo Fisher Scientific) for 30 min. Sections were mounted with Fluoromount-G (Beckman Coulter, 731604). DNA fragmentation in gut sections was assayed by TUNEL assay in formalin-fixed sections according to the manufacturer’s instructions (Roche Applied Science, 12156792910). Sections were stained with DAPI (10 μg ml−1, Invitrogen, D1306) and mounted with Fluoromount-G (Beckman Coulter, 731604). As a positive control, jejunum sections of VDTR mice (mice expressing diphtheria toxin receptor under the villin promoter (epithelial specific)) treated with 10 ng of diphtheria toxin per g of body weight, for 12 h, were used44.
Statistical analysis.
The majority of experiments were repeated at least three times to obtain data for indicated statistical analyses. Mice were allocated to experimental groups on the basis of their genotype and randomized within the given sex- and age-matched group. Because our mice were inbred and matched for age and sex, we always assumed similar variance between the different experimental groups. We did not perform an a priori sample size estimation but always used as many mice per group as possible in an attempt to minimize type I and type II errors. Investigators were not blinded during experiments and outcome assessment, except for microscopic analysis of fluorescent immunostaining, which was performed blinded. For bacterial culture experiments (aerobic and anaerobic) (Fig. 1d) a representative image out of five biological replicate experiments is shown. For microscopy analyses (Extended Data Figs. 2a–c, 4d, 10g) representative images out of at least three biological replicate experiments are shown. All experimental and control animals were littermates and none were excluded from the analysis at the time of collection. The number of mice per group is described in the corresponding figure legends as n and all quantitative data are presented as mean ± error of the mean (s.e.m.), unless otherwise indicated. Data were first analysed for normal distribution using D’Agostino and Pearson omnibus normality tests. Normally distributed data were analysed using a paired or unpaired two-tailed Student’s t-test for single comparisons, and one-way or two-way ANOVA for multiple comparisons. ANOVA analysis was followed by a Sidak’s post hoc test. Data that were not normally distributed were analysed using unpaired two-tailed Mann–Whitney U-test for single comparisons, and Kruskal-Wallis, Dunn’s post hoc test for multiple comparisons. Correlations were calculated using the Pearson and Spearman correlation. Figures and statistical analysis were generated using GraphPad Prism 6 (GraphPad Software). The statistical test used and P values are indicated in each figure legend. P values of <0.05 were considered to be statistically significant. *P< 0.05, **P< 0.01, ***P < 0.001 and ****P< 0.0001.
Reporting summary.
Further information on experimental design is available in the Nature Research Reporting Summary linked to this paper.
Data availability.
Datasets that support the findings of this study have been deposited online in the Gene Expression Omnibus (GEO) under accession number GSE99333. Source Data for all mouse experiments have been provided. All other data are available from the corresponding author upon reasonable request.
Extended Data
Extended Data Fig. 1 |. Tet−/− mice display variability in PMP penetrance that correlates with bacteraemia.
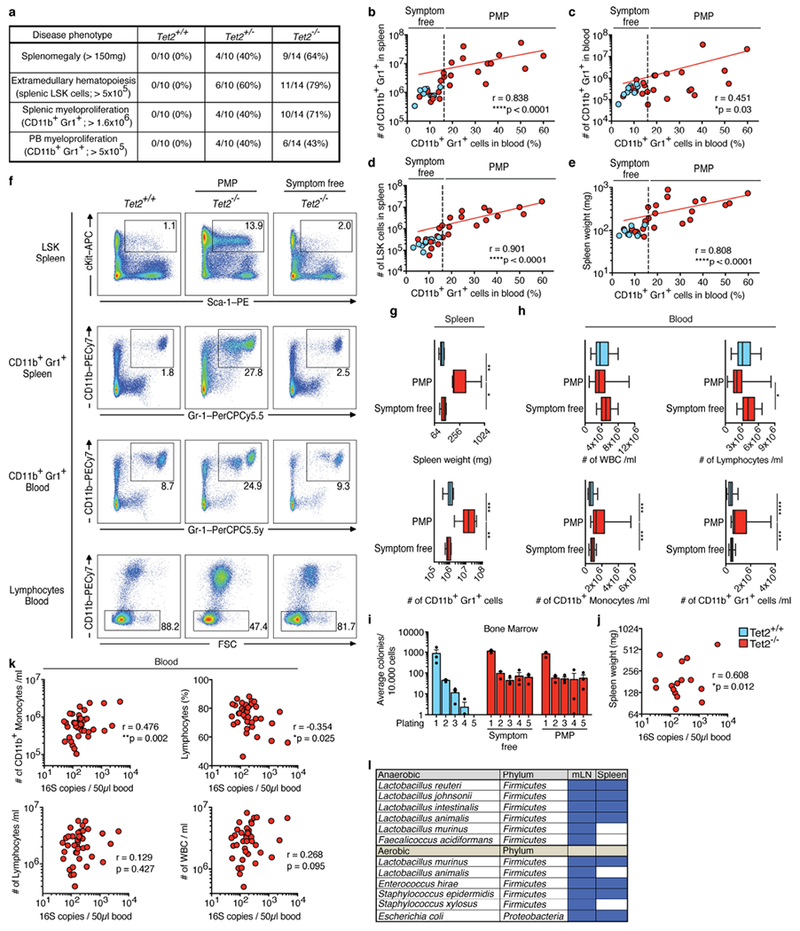
a, Penetrance of PMP assessed by splenomegaly, splenic LSK cell expansion and CD11b+Gr1+ myeloid cell expansion in spleen and peripheral blood. b–e, Correlation between frequency of peripheral-blood CD11b+Gr1+ myeloid cells (peripheral-blood biomarker) and numbers of CD11b+Gr1+ myeloid cells in spleen (b) and peripheral blood (c), numbers of LSK cells (d) and splenomegaly (e), in Tet+/+ and Tet−/− mice. In b–e, dotted vertical lines indicate level of 16% for peripheral-blood CD11b+Gr1+ myeloid cells (level determined by the distribution in wild-type littermates). The peripheral-blood biomarker (frequency of CD11b+Gr1+ myeloid cells) was used to categorize Tet−/− mice either as symptom free (≤16% CD11b+Gr1+ myeloid cells) or as mice with PMP (>16% CD11b+Gr1+ myeloid cells). Spearman correlation test excluding Tet2+/+ mice. Red lines indicate regression line calculated for Tet−/− data points (n = 10 (blue), 23 mice (red). f–i, Symptom-free, Tet−/− mice with PMP and littermate controls were used. f, Representative dot blots are shown of LSK cells in the spleen, CD11b+Gr1+ myeloid cells in the spleen and peripheral blood, and lymphocytes in peripheral blood. Data are representative of five independent experiments with similar results. g, Spleen weight (top; n = 11 (blue), 9 (red, PMP) or 5 mice (red, symptom free)) and numbers of CD11b+Gr1+ myeloid cells in the spleen (bottom; n = 10 (blue), 12 (red, PMP) or 7 mice (red, symptom free)). h, Numbers per ml of peripheral blood of live CD45+ gated white blood cells (WBC) (top left), lymphocytes (top right), CD11b+ monocytes (bottom left) and CD11b+Gr1+ myeloid cells (bottom right) (n = 15 (blue), 15 (red, PMP) or 32 mice (red, symptom free)). i, In vitro HSC self-renewal colony-forming assay of haematopoietic progenitors of the bone marrow (n = 3 mice). Mean ± s.e.m. j, k, Correlation between 16S gene copies in the peripheral blood and spleen weight (n = 16 mice) (j) or numbers of CD11b+ monocytes (k top left), percentage of lymphocytes (k top right), numbers of lymphocytes (k bottom left), and numbers of leukocytes (WBC) (k bottom right) in the peripheral blood (n = 40 mice). Pearson correlation test. l, Bacterial colonies from Fig. 1e, f identified by 16S sequencing; blue rectangles indicate presence of bacteria. In g, h, boxes represent median values and interquartile ranges; whiskers represent minimum and maximum values. One-way ANOVA, Sidak’s post hoc test. Data are representative of at least three independent experiments. *P < 0.05, **P < 0.01, ***P < 0.001, ****P < 0.0001.
Extended Data Fig. 2 |. Tet−/− mice display no anatomical changes in the jejunum.
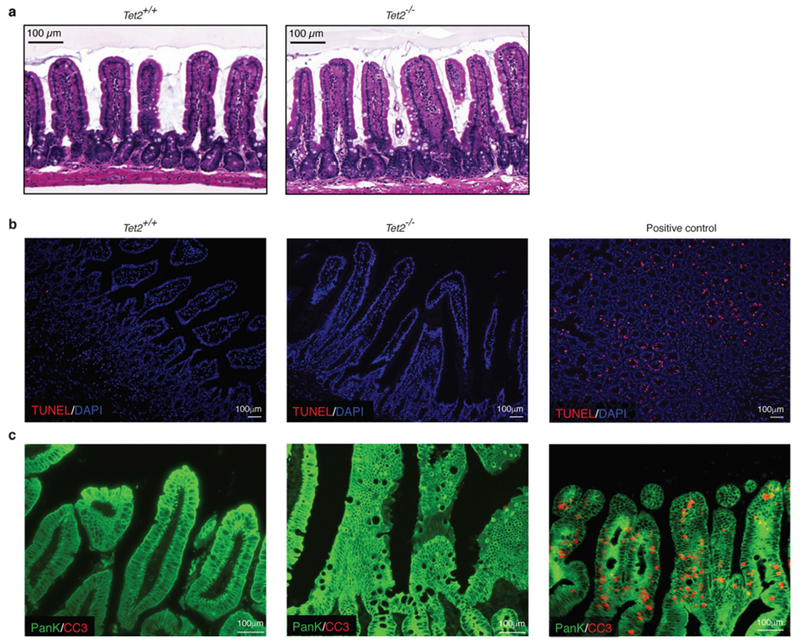
a, Representative images of haematoxylin and eosin-stained sections of the jejunum. b, c, Immunofluorescence analyses of sections of the jejunum of Tet2+/+ and Tet2−/− mice. b, No difference was observed between the groups in the number of apoptotic cells using the TUNEL assay (red). Nuclei of intestinal cells were visualized with DAPI (blue). c, No difference was observed in the number of apoptotic (cleaved caspase 3-positive (CC3), red) epithelial cells (pan-keratin-positive, (PanK), green) between the groups. In b, c, Jejunum sections of diphtheria-toxin-treated VDTR mice were used as a positive control. Data are representative of at least two independent experiments.
Extended Data Fig. 3 |. Disruption of barrier integrity drives PMP.
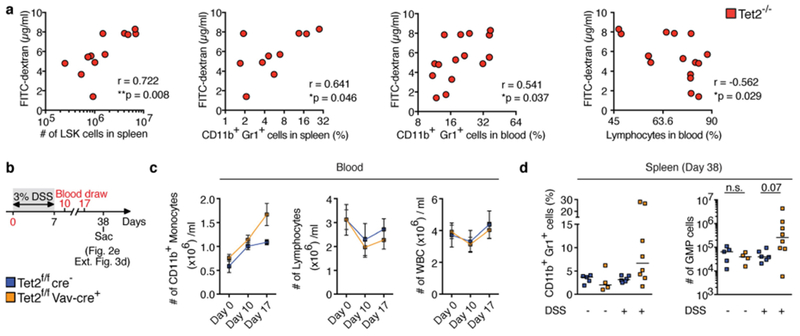
a, FITC-dextran concentration in blood plasma correlates with numbers of LSK cells (left, n = 12 mice), frequency of CD11b+Gr1+ myeloid cells in the spleen (middle left, n = 10 mice), peripheral blood (middle right, n = 15 mice) and frequency of lymphocytes (right, n = 15 mice). Pearson correlation test. b, Schematic of DSS treatment of symptom-free Tet2f/fVavcre mice that are over 20 weeks old, and littermate controls. c, Numbers of CD11b+ monocytes (left), lymphocytes (middle) and leukocytes (WBC) (right) before, during and after DSS treatment (n = 5 (blue) or 8 (orange) mice). Mean ± s.e.m. d, Percentage of CD11b+Gr1+ myeloid cells (left) and numbers of GMP (right) at end point analysis (n = 5 (Tet2f/fcre−, without DSS), 4 (Tet2f/fVavcre, without DSS), 6 (Tet2f/fcre−, with DSS) or 8 (Tet2f/fVavcre, with DSS) mice). Centre is median, Kruskal–Wallis, Dunn’s post hoc test. *P < 0.05, **P < 0.01. Data are representative of at least two independent experiments.
Extended Data Fig. 4 |. Tight junction ZO-1 is markedly reduced in the jejunum but not in the colon of Tet2−/− mice.
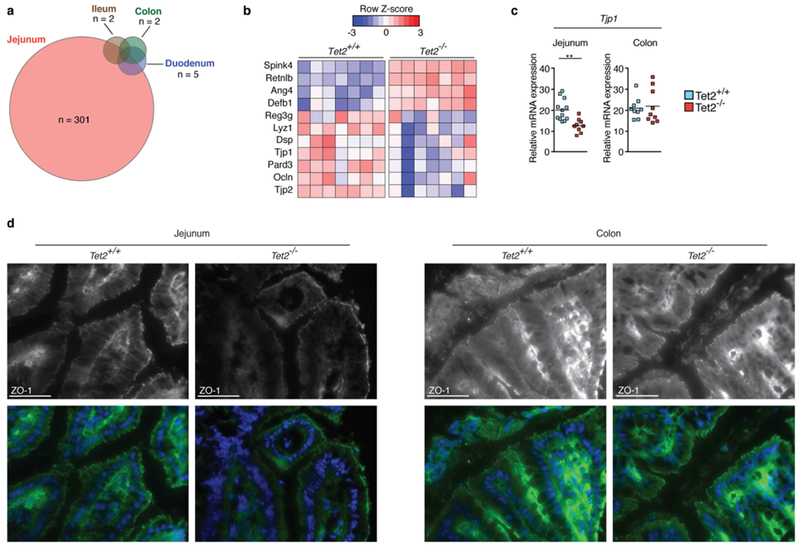
a, RNA sequencing of whole intestinal tissue of duodenum, jejunum, ileum and colon of three Tet2−/− and three Tet2+/+ mice. Venn diagram illustrating the number of differentially expressed genes (|log2(fold change)| > 0.5 and false discovery rate < 0.1); see Supplementary Table in Tet2−/− mice compared to littermate controls. b, RNA sequencing of the jejunum of seven Tet2−/− and seven Tet2+/+ mice (the full list of differentially expressed genes is shown in Supplementary Table. Heat map of a selection of antimicrobial peptides and tight junction genes. c, Gene expression of tight junction gene (ZO-1, Tjp1) in the jejunum (left; n = 12 (Tet2+/+) or 9 (Tet2−/−) mice) and colon (right; n = 9 mice in both cases). Centre is mean, two-tailed unpaired t-test. d, ZO-1 immunofluorescence shows reduced tight junction staining of epithelial cells in the jejunum (left) but no difference in colonic epithelial cells (right) of Tet2−/− mice. Representative images are shown from Tet2+/+ (n = 3 mice) and Tet2−/− mice (n = 7 mice). Scale bars, 100 μm. Green, ZO-1; blue, DAPI. **P < 0.01. Data are representative of at least two independent experiments.
Extended Data Fig. 5 |. Absence of Tet2 expression in haematopoietic cells leads to barrier dysfunction and PMP.
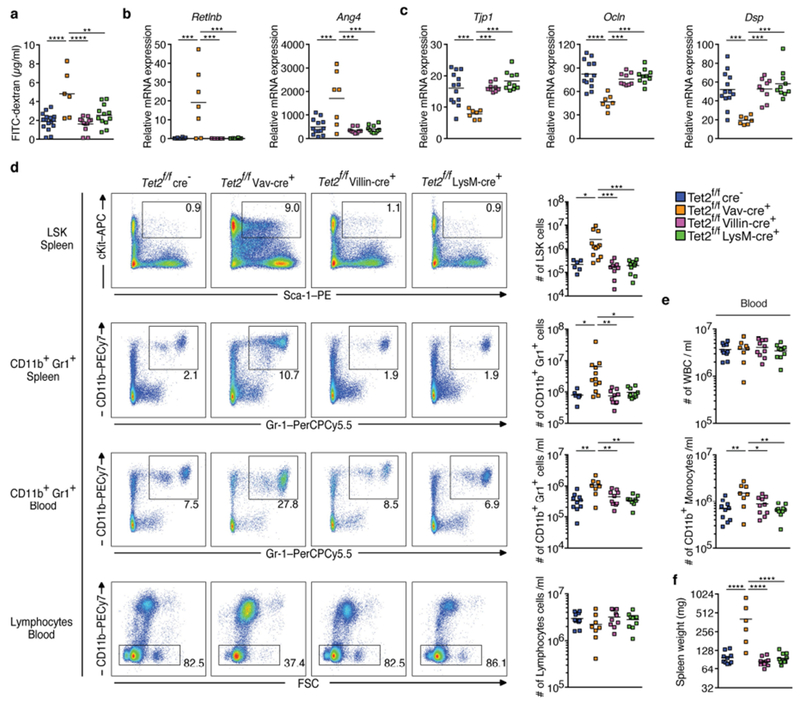
a, Intestinal permeability measurement by blood plasma FITC-dextran concentrations (n = 16 (Tet2f/fcre−), 6 (Tet2f/fVavcre), 12 (Tet2f/fVillincre) or 12 (Tet2f/fLysMcre) mice). b, c, Gene expression of antimicrobial peptides Retlnb (b left), Ang4 (b right) and (c) tight junction genes ZO-1 (Tjp1) (left), occludin (Ocln) (middle), and desmoplakin (Dsp) (right) in the jejunum (n = 13 (Tet2f/fcre−), 7 (Tet2f/fVavcre), 9 (Tet2f/fVillincre) or 10 (Tet2f/fLysMcre) mice). d, Representative dot blots (left) and numbers of LSK cells (right) in the spleen, CD11b+Gr1+ myeloid cells in the spleen (n = 6 (Tet2f/fcre−), 12 (Tet2f/fVavcre), 10 (Tet2f/fVillincre) or 10 (Tet2f/fLysMcre) mice) and peripheral blood, and lymphocytes in the peripheral blood (n = 10 (Tet2f/fcre−) 8 (Tet2f/fVavcre), 10 (Tet2f/fVillincre) or 10 (Tet2f/fLysMcre) mice). e, White blood cell (WBC) count (top) and cell number per ml of blood of CD11b+ monocytes (bottom) (n = 10 (Tet2f/fcre−) 8 (Tet2f/fVavcre), 10 (Tet2f/fVillincre) or 10(Tet2f/fLysMcre) mice). f, Spleen weight is shown (n = 10 (Tet2f/fcre−) 6 (Tet2f/fVavcre), 10 (Tet2f/fVillincre) or 10 (Tet2f/fLysMcre) mice). In a–f, centre is mean, one-way ANOVA, Sidak’s post hoc test. *P < 0.05, **P < 0.01, ***P < 0.001, ****P < 0.0001. Data are representative of three independent experiments.
Extended Data Fig. 6 |. Microbial signals are sufficient for PMP in Tet2−/− mice.
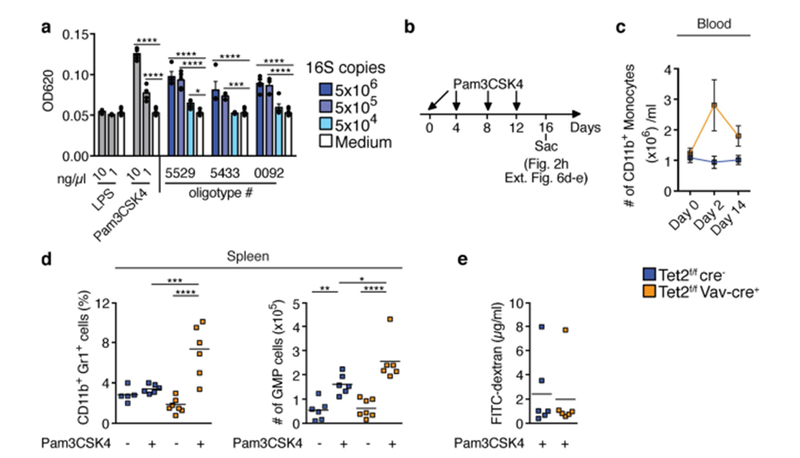
a, TLR2 activation measured using a HEK-TLR2 reporter assay (n = 5 biological replicates). b, Schematic of Pam3CSK4 in vivo treatment of symptom-free Tet2f/fVavcre mice that are over 20 weeks old, and littermate controls. c, Numbers of CD11b+ monocytes prior (day 0), during treatment (day 2) and at end point analysis (day 14) (n = 6 mice). Mean ± s.e.m. d, Percentage of CD11b+Gr1+ myeloid cells (left, n = 5 (Tet2f/fcre−, no Pam3CSK4), 6 (Tet2f/fcre−, with Pam3CSK4), 7 (Tet2f/fVavcre, no Pam3CSK4) or 6 (Tet2f/fVavcre, with Pam3CSK4) mice) and numbers of GMP cells (right, n = 6 (Tet2f/fcre−, no Pam3CSK4), 6 (Tet2f/fcre−, with Pam3CSK4), 7 (Tet2f/fVavcre) no Pam3CSK4) or 6 (Tet2f/fVavcre) with Pam3CSK4) mice). e, Intestinal permeability measurement by blood plasma FITC-dextran concentrations at end point analysis (n = 6 mice in all cases). a, c–e, Centre is mean. a, d, One-way ANOVA, Sidak’s post hoc test, *P < 0.05, **P < 0.01, ***P < 0.001, ****P < 0.0001. Data are representative of at least two independent experiments.
Extended Data Fig. 7 |. Microbial community structures are similar between Tet2−/− mice and littermate controls.
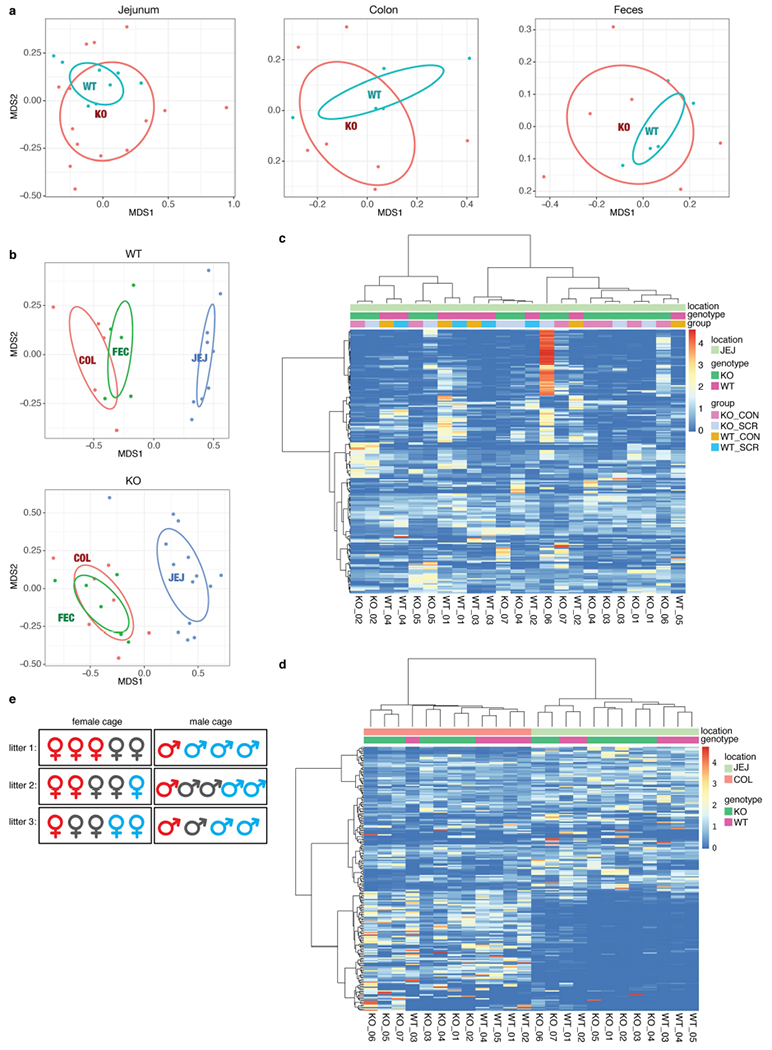
a, b, Non-metric multidimensional scaling of samples based on their oligotype profiles (with Bray–Curtis distance). a, Microbial community structures within the same body site—that is, jejunum (left, n = 14 (Tet2 (KO)) or 9 mice (Tet2+/+(WT))), colon (middle, n = 7 (KO) or 5 mice (WT)) and faeces (right, n = 6 (KO) or 5 mice (WT))—do not differ significantly across genotypes based on envfit test with 999 permutations (P > 0.05, two-tailed). b, Microbial community structures within the same genotype—WT (top, n = 5 (colonic sample (COL) or faecal sample (FEC)) or 9 mice (jejunal sample (JEJ)) and KO (bottom, n = 6 (FEC), 7 (COL) or 14 mice (JEJ))—significantly differ across body sites based on the same test (P < 0.001). c, d, Heat-map displays of oligotypes across samples. Clustering dendrograms are computed with Bray–Curtis distance and average linkage algorithm using the oligotype profiles. The intensity of colours indicates the per cent abundance of a given oligotype (rows) in a given sample (columns). c, Comparison of genotypes for samples collected from a single body site. d, Comparison of genotypes for samples collected across body sites. e, Co-housing does not affect the development of PMP in Tet2f/fVavcre mice. Representative cage configurations of 3 litters from Tet2f/fVavcre mice with PMP that are over 20 weeks old (red), symptom-free Tet2f/fVavcre mice (grey), and littermate controls (blue). CON, luminal content; SCR, scraping samples.
Extended Data Fig. 8 |. Microbial signals are required for PMP in Tet2−/− mice.
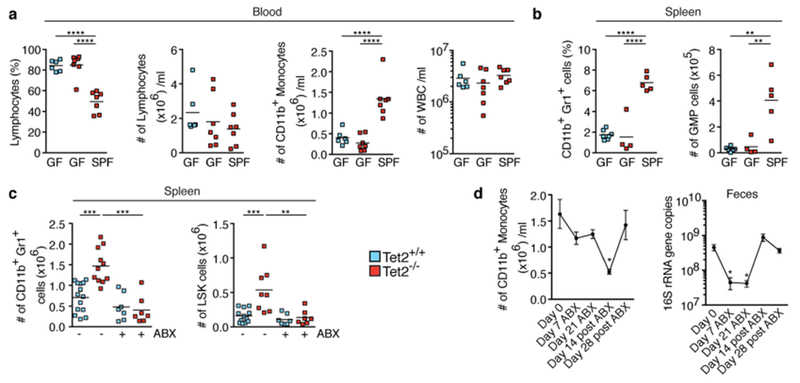
a, b, Germ-free, SPF-housed Tet2−/− mice that are over 40 weeks old, and germ-free wild-type controls, analysed for percentage of lymphocytes (a left), numbers of lymphocytes (a middle left), numbers of CD11b+ monocytes (a middle right) and numbers of leukocytes (WBC) (a right) (n = 6 (Tet2+/+, GF), 7 (Tet2−/−, GF) or 7 (Tet2−/−, SPF) mice), and percentage of CD11b+Gr1+ myeloid cells (b left) and numbers of GMP cells (b right), (n = 7 (Tet2+/+, GF), 4 (Tet2−/−, GF) or 5 (Tet2−/−, SPF) mice). c, Mice treated with antibiotics (ABX) before onset of PMP (see schematic in Fig. 3c. Numbers of CD11b+Gr1+ myeloid cells (left; n = 14 (Tet2+/+, no ABX), 11 (Tet2−/− no ABX), 7 (Tet2+/+, with ABX) or 7 (Tet2−/−, with ABX) mice) and LSK cells (right; n = 12 (Tet2+/+, no ABX), 8 (Tet2−/−, no ABX), 7 (Tet2+/+, with ABX) or 7 (Tet2−/−, with ABX) mice). d, Tet2−/− mice monitored for the number of CD11b+ monocytes (left, n = 7 mice) and 16S gene copies in the faeces (right, n = 6 mice) before, during and after antibiotics treatment. Mean ± s.e.m., repeated measures one-way ANOVA, Sidak’s post hoc test. In a–c, centre is mean, one-way ANOVA, Sidak’s post hoc test, *P < 0.05, **P < 0.01, ***P < 0.001, ****P < 0.0001. Data are representative of at least two independent experiments.
Extended Data Fig. 9 |. Antibiotic treatment reverses PMP in Tet2−/− mice.
a–j, Tet2−/− mice with PMP that are over 20 weeks old, and littermate controls, were treated with and without antibiotics (ABX) for four weeks. a, Numbers of peripheral-blood CD11b+ monocytes (n = 13 mice). Lines connect values obtained from the same mouse sampled before (−) and after (+) ABX treatment. b, c, Representative dot blots and percentage of CD11b+Gr1+ myeloid cells (b) (n = 20 (Tet2+/+, no ABX), 21 (Tet2−/−, no ABX), 6 (Tet2+/+ with ABX) or 14 (Tet2Ȓ/−, with ABX) mice) and LSK cells in the spleen (c) (n = 11 (Tet2+/+, no ABX), 12 (Tet2−/−, no ABX), 6 (Tet2+/+ with ABX) or 12 (Tet2Ȓ/−, with ABX) mice). d, Representative dot blots and numbers of bone marrow-derived LSK cells (n = 11(Tet2+/+,, no ABX), 13 (Tet2Ȓ/−, no ABX), 6 (Tet2+/+, with ABX) or 12 (Tet2Ȓ/−, with ABX) mice). e, f, Representative dot blots and numbers of splenic (e) (n = 6 (Tet2+/+, no ABX), 12 (Tet2Ȓ/−, no ABX), 5 (Tet2+/+, with ABX) or 12 (Tet2Ȓ/−, with ABX) mice) and bone marrow-derived (f) LSK gated CD34+Flt3− (Flt3 is also known as CD135) short-term (ST)-HSCs and CD34−Flt3− long-term (LT)-HSCs (n = 6 (Tet2+/+, no ABX), 13 (Tet2Ȓ/−, no ABX), 5 (Tet2+/+, with ABX) or 12 (Tet2Ȓ/−, with ABX) mice). g, h, Representative dot blots and numbers of splenic (g) (n = 5(Tet2+/+, no ABX), 10 (Tet2Ȓ/−, no ABX), 5 (Tet2+/+, with ABX) or 10 (Tet2Ȓ/−, with ABX) mice) and bone marrow-derived (h) LSK gated CD150+ CD48− cells (n = 5 (Tet2+/+, no ABX), 11 (Tet2Ȓ/−, no ABX), 5 (Tet2+/+, with ABX) or 10 (Tet2Ȓ/−, with ABX) mice). i, j, Representative dot blots and numbers of splenic (i) (n = 6 (Tet2+/+, no ABX), 12 (Tet2Ȓ/−, no ABX), 5 (Tet2+/+, with AbX) or 12 (Tet2Ȓ/−, with ABX) mice) and bone marrow-derived (j) c-Kit+Sca-1− (LK gated) GMP, common myeloid progenitor (CMP) and megakaryocyte-erythroid progenitor (MEP) cells (n = 6 (Tet2+/+, no ABX), 13 (Tet2−/−, no ABX), 5 (Tet2+/+, with ABX) or 12 (Tet2Ȓ/−, with ABX) mice). In b–j, centre is mean, one-way ANOVA, Sidak’s post hoc test. Data are representative of at least three independent experiments. *P < 0.05, **P < 0.01, ***P < 0.001, ****P < 0.0001.
Extended Data Fig. 10 |. Bacteria-induced IL-6 is required for PMP in Tet2−/− mice.
a, Gene expression of Il6 in the spleen of SPF-housed Tet2−/− mice, littermates and germ-free Tet2−/− mice (n = 7 (Tet2+/+, SPF), 10 (Tet2−/−, SPF) or 4 (Tet2−/−, GF) mice). b, IL-6 cytokine levels in blood plasma of Tet2−/− mice with PMP treated with antibiotics (ABX) for four weeks (n = 5 mice). Lines connect values obtained from the same mouse sampled before and after antibiotics treatment. Two-tailed paired t-test. c, IL-6 cytokine levels in blood plasma of DSS-treated symptom-free Tet2f/fVavcre mice that are over 20 weeks old, and littermate controls (see schematic in Extended Data Fig. 3b (n = 6 (Tet2+/+) or 9 (Tet2−/−) mice). d, IL-6 cytokine levels in blood plasma of Tet2f/fVavcre mice that are over 20 weeks old, and littermate controls, treated with the TLR1/2 agonist Pam3CSK4 (see schematic in Extended Data Fig. 6b (n = 6 (Tet2+/+) or 8 (Tet2−/−) mice). e, Correlation between IL-6 cytokine levels in blood plasma of Tet2−/− mice and numbers of peripheral-blood CD11b+ monocytes (n = 49 mice). Pearson correlation test. f, g, In vitro HSC self-renewal colony-forming assay of haematopoietic progenitors of the spleen from Tet2−/− mice (red lines) and littermate controls (blue lines) in the presence of anti-IL-6 antibody or isotype control (ISO) after the first replating (n = 3 mice). g, Representative images of colonies after the 5th replating. Scale bars, 100 μm. h, Representative histogram (left) and quantification of (right) mean fluorescence intensity (MFI) of IL-6Rα+c-Kit+Sca-1 − (LK gated) CD34+FcγRIII/II+ GMPs from the bone marrow, (n = 5 (Tet2+/+ SPF), 6 (Tet2−/−, SPF), 4 (Tet2+/+ GF) or 3 (Tet2−/−, GF) mice). i, Representative flow cytometry plot of Stat3 phosphorylation (pY705) response after 30-min stimulation with 10 ng ml−1 IL-6 in splenic c-Kit+Sca-1− (LK gated) CD34+ and CD34− myeloid progenitors (MP). j, Numbers of CD11b+ myeloid cells (n = 7 (Tet2+/+) or 6 (Tet2−/−) mice). k, l, CD11b+F4/80+ macrophages and CD11b+Gr1+ myeloid cells of the spleen, from Tet2−/− mice and littermate controls, were FACS sorted. Gene expression of Il6 in macrophages (k) and CD11b+Gr1+ cells (l) (n = 7 (Tet2+/+) or 6 (Tet2−/−) mice). Centre is median. m, Representative histogram (left) and quantification of (right) MFI of IL-6Rα+CD11b+Gr1+ myeloid cells in the spleen (n = 5 (Tet2+/+, SPF), 6 (Tet2−/− SPF), 4 (Tet2+/+ GF) or 4 (Tet2−/−, GF) mice). n, Representative histogram (left) and quantification of (right) MFI of IL-6Rα+c-Kit+Sca-1− (LK gated) CD34+FcγRIII/II+ GMPs from the spleen of Tet2f/fLysMcre mice and littermate controls (n = 5 mice). Centre is mean. o, p, anti-IL-6 antibody (+) or ISO treatment (−) of Tet2−/− mice with PMP that are over 20 weeks old, and littermate controls (see schematic in Fig. 4g. o, Percentage of CD11b+Gr1+ myeloid cells (left; n = 10 (Tet2+/+, with anti-IL-6), 6 (Tet2−/−, with anti-IL-6) or 7 (Tet2−/−, without anti-IL-6) mice) and numbers of GMPs (right; n = 11 (Tet2+/+, with anti-IL-6), 6 (Tet2−/−, with anti-IL-6) or 8 (Tet2−/−, without anti-IL-6) mice) in the spleen. p, Intestinal permeability was assessed by blood plasma FITC–dextran concentrations (n = 6 mice in all cases). q, IL-6 in supernatants from intestinal explants: jejunum (left; n = 6 (Tet2+/+) or 5 (Tet2−/−) mice) and colon (right; n = 6 mice in both cases). Centre is mean. a, h, m, p, Centre is mean, one-way ANOVA, Sidak’s post hoc test. c, d, j, Centre is median, two-tailed Mann–Whitney U-test. o, Centre is median, Kruskal–Wallis, Dunn’s post hoc test. Data are representative of at least three independent experiments; *P < 0.05, **P < 0.01, ***P < 0.001. r, Model showing that extrinsic (microbial-induced inflammatory) and intrinsic (IL-6Rα expression) signals are required for PMP in Tet2−/− mice. In detail, small-intestinal barrier dysfunction (reduced ZO-1 and upregulation of defence response genes), which occurs spontaneously or upon intestinal damage, leads to bacterial translocation and to high levels of IL-6. Bacterial translocation can be bypassed when Tet2-deficient mice receive systemic microbial signals. Microbial-induced IL-6 is sensed by Tet2−/− myeloid progenitor (MP) cells that overexpress IL-6Rα and are highly sensitive to IL-6 (Stat3 (pY705)). Subsequently, MPs expand upon IL-6 signals and preferentially differentiate into mature myeloid cells with IL-6-producing capacities. This cycle results in the development of PMP. Treatment with antibiotics or neutralizing anti-IL-6 antibody can revert PMP, indicating that microbial inflammatory signals are required for PMP in the context of Tet2 deficiency. However, whether bacteria-induced inflammatory signals also create a permissive environment that induces the acquisition of cooperative oncogenic mutations that lead to the development of leukaemia remains to be determined. The mechanisms through which Tet2 deficiency in haematopoietic cells leads to a microbiota-dependent impairment of gut barrier function remains to be addressed.
Supplementary Material
Acknowledgements
We thank the University of Chicago DNA Sequencing Core facility for assistance with sequencing; the Calcul Québec and Compute Canada for providing access to the supercomputer Briaree from the University of Montreal; the Histology Core facility at the University of Chicago Human Tissue Resource Center for assistance with histology; S. Hwang (University of Chicago) for providing LysM-Cre mice; and V. Abadie (Universite de Montreal) for discussions and critical reading of the manuscript. This work was supported by grants from the Cancer Center Support Grant P30CA014599 to B.J.; Digestive Diseases Research Core Center P30DK42086 at the University of Chicago to R.H., E.B.C., C.R.W. and B.J.; P01DK072201, R01DK110352 and 5R01CA161373 to S.A.L. and G.C.F.; F32 DK105728-01A1 to J.F.P.; CCFA Research Fellowship Award (ID: 480735) to M.M.; FWF Austrian Science Fund (P30324-B21) and Christian Doppler Society (I-CARE) to G.B.; and by a CIHR grant MOP (#20003029), a Canada Research Chair to E.F.V. and a Canada Research Chair to L.B.B. A.P was supported by a fellowship from FRQS.
Footnotes
Online content
Any Methods, including any statements of data availability and Nature Research reporting summaries, along with any additional references and Source Data files, are available in the online version of the paper at https://doi.org/10.1038/s41586-018-0125-z.
Reviewer information Nature thanks S. Grivennikov, K. Shannon, Y Xiong and the other anonymous reviewer(s) for their contribution to the peer review of this work.
Competing interests The authors declare no competing interests.
Extended data is available for this paper at https://doi.org/10.1038/s41586-018-0125-z.
Supplementary information is available for this paper at https://doi.org/10.1038/s41586-018-0125-z.
Publisher’s note: Springer Nature remains neutral with regard to jurisdictional claims in published maps and institutional affiliations.
References
- 1.Delhommeau F et al. Mutation in TET2 in myeloid cancers. N. Engl. J. Med 360, 2289–2301 (2009). [DOI] [PubMed] [Google Scholar]
- 2.Kosmider O et al. TET2 gene mutation is a frequent and adverse event in chronic myelomonocytic leukemia. Haematologica 94, 1676–1681 (2009). [DOI] [PMC free article] [PubMed] [Google Scholar]
- 3.Busque L et al. Recurrent somatic TET2 mutations in normal elderly individuals with clonal hematopoiesis. Nat. Genet 44, 1179–1181 (2012). [DOI] [PMC free article] [PubMed] [Google Scholar]
- 4.Abdel-Wahab O & Levine RL Mutations in epigenetic modifiers in the pathogenesis and therapy of acute myeloid leukemia. Blood 121, 3563–3572 (2013). [DOI] [PMC free article] [PubMed] [Google Scholar]
- 5.Genovese G et al. Clonal hematopoiesis and blood-cancer risk inferred from blood DNA sequence. N. Engl. J. Med 371, 2477–2487 (2014). [DOI] [PMC free article] [PubMed] [Google Scholar]
- 6.Jaiswal S et al. Age-related clonal hematopoiesis associated with adverse outcomes. N. Engl. J. Med 371, 2488–2498 (2014). [DOI] [PMC free article] [PubMed] [Google Scholar]
- 7.Jan M, Ebert BL & Jaiswal S Clonal hematopoiesis. Semin. Hematol 54, 43–50 (2017). [DOI] [PMC free article] [PubMed] [Google Scholar]
- 8.Moran-Crusio K et al. Tet2 loss leads to increased hematopoietic stem cell self-renewal and myeloid transformation. Cancer Cell 20, 11–24 (2011). [DOI] [PMC free article] [PubMed] [Google Scholar]
- 9.Quivoron C et al. TET2 inactivation results in pleiotropic hematopoietic abnormalities in mouse and is a recurrent event during human lymphomagenesis. Cancer Cell 20, 25–38 (2011). [DOI] [PubMed] [Google Scholar]
- 10.Bowman RL, Busque L & Levine RL Clonal hematopoiesis and evolution to hematopoietic malignancies. Cell Stem Cell 22, 157–170 (2018). [DOI] [PMC free article] [PubMed] [Google Scholar]
- 11.Kunimoto H et al. Cooperative epigenetic remodeling by TET2 loss and NRAS mutation drives myeloid transformation and MEK inhibitor sensitivity. Cancer Cell 33, 44–59.e48 (2018). [DOI] [PMC free article] [PubMed] [Google Scholar]
- 12.Kogan SC et al. Bethesda proposals for classification of nonlymphoid hematopoietic neoplasms in mice. Blood 100, 238–245 (2002). [DOI] [PubMed] [Google Scholar]
- 13.Ko M et al. Ten-Eleven-Translocation 2 (TET2) negatively regulates homeostasis and differentiation of hematopoietic stem cells in mice. Proc. Natl Acad. Sci. USA 108, 14566–14571 (2011). [DOI] [PMC free article] [PubMed] [Google Scholar]
- 14.Li Z et al. Deletion of Tet2 in mice leads to dysregulated hematopoietic stem cells and subsequent development of myeloid malignancies. Blood 118, 4509–4518 (2011). [DOI] [PMC free article] [PubMed] [Google Scholar]
- 15.Boettcher S & Manz MG Regulation of inflammation- and infection-driven hematopoiesis. Trends Immunol 38, 345–357 (2017). [DOI] [PubMed] [Google Scholar]
- 16.Sartor RB Microbial influences in inflammatory bowel diseases. Gastroenterology 134, 577–594 (2008). [DOI] [PubMed] [Google Scholar]
- 17.Marchiando AM, Graham WV & Turner JR Epithelial barriers in homeostasis and disease. Annu. Rev. Pathol 5, 119–144 (2010). [DOI] [PubMed] [Google Scholar]
- 18.Chassaing B, Aitken JD, Malleshappa M & Vijay-Kumar M Dextran sulfate sodium (DSS)-induced colitis in mice. Curr. Protoc. Immunol 104, 15.25.1–15.25.14 (2014). [DOI] [PMC free article] [PubMed] [Google Scholar]
- 19.Shen L, Weber CR, Raleigh DR, Yu D & Turner JR Tight junction pore and leak pathways: a dynamic duo. Annu. Rev. Physiol 73, 283–309 (2011). [DOI] [PMC free article] [PubMed] [Google Scholar]
- 20.Chapman CG et al. TET-catalyzed 5-hydroxymethylcytosine regulates gene expression in differentiating colonocytes and colon cancer. Sci. Rep 5, 17568 (2015). [DOI] [PMC free article] [PubMed] [Google Scholar]
- 21.Zhao Z et al. The catalytic activity of TET2 is essential for its myeloid malignancy-suppressive function in hematopoietic stem/progenitor cells. Leukemia 30, 1784–1788 (2016). [DOI] [PMC free article] [PubMed] [Google Scholar]
- 22.Eren AM et al. Oligotyping: differentiating between closely related microbial taxa using 16S rRNA gene data. Methods Ecol. Evol 4, 1111–1119 (2013). [DOI] [PMC free article] [PubMed] [Google Scholar]
- 23.Wells JM Immunomodulatory mechanisms of lactobacilli. Microb. Cell Fact 10, S17 (2011). [DOI] [PMC free article] [PubMed] [Google Scholar]
- 24.Kristinsson SY et al. Chronic immune stimulation might act as a trigger for the development of acute myeloid leukemia or myelodysplastic syndromes. J. Clin. Oncol 29, 2897–2903 (2011). [DOI] [PMC free article] [PubMed] [Google Scholar]
- 25.Panteli KE et al. Serum interleukin (IL)-1, IL-2, sIL-2Ra, IL-6 and thrombopoietin levels in patients with chronic myeloproliferative diseases. Br. J. Haematol 130, 709–715 (2005). [DOI] [PubMed] [Google Scholar]
- 26.Miller CL & Lai B Human and mouse hematopoietic colony-forming cell assays. Methods Mol. Biol 290, 71–89 (2005). [DOI] [PubMed] [Google Scholar]
- 27.Johnson DE, O’Keefe RA & Grandis JR Targeting the IL-6/JAK/STAT3 signalling axis in cancer. Nat. Rev. Clin. Oncol 15, 234–248 (2018). [DOI] [PMC free article] [PubMed] [Google Scholar]
- 28.Cimmino L et al. Restoration of TET2 function blocks aberrant self-renewal and leukemia progression. Cell 170, 1079–1095.e1020 (2017). [DOI] [PMC free article] [PubMed] [Google Scholar]
- 29.Slack E et al. Innate and adaptive immunity cooperate flexibly to maintain host-microbiota mutualism. Science 325, 617–620 (2009). [DOI] [PMC free article] [PubMed] [Google Scholar]
- 30.Meisel M et al. Interleukin-15 promotes intestinal dysbiosis with butyrate deficiency associated with increased susceptibility to colitis. ISME J 11, 15–30 (2017). [DOI] [PMC free article] [PubMed] [Google Scholar]
- 31.Stefka AT et al. Commensal bacteria protect against food allergen sensitization. Proc. Natl Acad. Sci. USA 111, 13145–13150 (2014). [DOI] [PMC free article] [PubMed] [Google Scholar]
- 32.Furuta GT et al. Hypoxia-inducible factor 1-dependent induction of intestinal trefoil factor protects barrier function during hypoxia. J. Exp. Med 193, 1027–1034 (2001). [DOI] [PMC free article] [PubMed] [Google Scholar]
- 33.Kim D et al. TopHat2: accurate alignment of transcriptomes in the presence of insertions, deletions and gene fusions. Genome Biol 14, R36 (2013). [DOI] [PMC free article] [PubMed] [Google Scholar]
- 34.Anders S, Pyl PT & Huber W HTSeq—a Python framework to work with high-throughput sequencing data. Bioinformatics 31, 166–169 (2015). [DOI] [PMC free article] [PubMed] [Google Scholar]
- 35.Ritchie ME et al. limma powers differential expression analyses for RNA-sequencing and microarray studies. Nucleic Acids Res 43, e47 (2015). [DOI] [PMC free article] [PubMed] [Google Scholar]
- 36.Johnson WE, Li C & Rabinovic A Adjusting batch effects in microarray expression data using empirical Bayes methods. Biostatistics 8, 118–127 (2007). [DOI] [PubMed] [Google Scholar]
- 37.Storey JD, Bass AJ, Dabney A & Robinson D qvalue: Q-value estimation for false discovery rate control. R package version 2.8.0. http://github.com/jdstorey/qvalue (2015). [Google Scholar]
- 38.Altschul SF, Gish W, Miller W, Myers EW & Lipman DJ Basic local alignment search tool. J. Mol. Biol 215, 403–410 (1990). [DOI] [PubMed] [Google Scholar]
- 39.Huse SM et al. Comparison of brush and biopsy sampling methods of the ileal pouch for assessment of mucosa-associated microbiota of human subjects. Microbiome 2, 5 (2014). [DOI] [PMC free article] [PubMed] [Google Scholar]
- 40.Eren AM, Vineis JH, Morrison HG & Sogin ML A filtering method to generate high quality short reads using illumina paired-end technology. PLoS ONE 8, e66643 (2013). [DOI] [PMC free article] [PubMed] [Google Scholar]
- 41.Eren AM et al. Minimum entropy decomposition: unsupervised oligotyping for sensitive partitioning of high-throughput marker gene sequences. ISME J 9, 968–979 (2015). [DOI] [PMC free article] [PubMed] [Google Scholar]
- 42.Huse SM et al. Exploring microbial diversity and taxonomy using SSU rRNA hypervariable tag sequencing. PLoS Genet 4, e1000255 (2008). [DOI] [PMC free article] [PubMed] [Google Scholar]
- 43.Oksanen J, Kindt R, Legendre P, O’Hara B & Stevens MH Vegan: community ecology package. https://CRAN.R-project.org/package=vegan (2007).
- 44.Cummings RJ et al. Different tissue phagocytes sample apoptotic cells to direct distinct homeostasis programs. Nature 539, 565–569 (2016). [DOI] [PMC free article] [PubMed] [Google Scholar]
Associated Data
This section collects any data citations, data availability statements, or supplementary materials included in this article.
Supplementary Materials
Data Availability Statement
Datasets that support the findings of this study have been deposited online in the Gene Expression Omnibus (GEO) under accession number GSE99333. Source Data for all mouse experiments have been provided. All other data are available from the corresponding author upon reasonable request.