Abstract
Objectives
Describe a technique for the description and classification of laryngotracheal stenosis in children using 3-dimensional reconstructions of the airway from computed tomography (CT) scans.
Study Design
Cross-sectional.
Setting
Academic tertiary care children’s hospital.
Subjects and Methods
Three-dimensional models of the subglottic airway lumen were created using CT scans from 54 children undergoing imaging for indications other than airway disease. The base lumen models were deformed in software to simulate subglottic airway segments with 0%, 25%, 50%, and 75% stenoses for each subject. Statistical analysis of the airway geometry was performed using metrics extracted from the lumen centerlines. The centerline analysis was used to develop a system for subglottic stenosis assessment and classification from patient-specific airway imaging.
Results
The scaled hydraulic diameter gradient metric derived from intersectional changes in the lumen can be used to accurately classify and quantitate subglottic stenosis in the airway based on CT scan imaging. Classification is most accurate in the clinically relevant 25% to 75% range of stenosis.
Conclusions
Laryngotracheal stenosis is a complex diagnosis requiring an understanding of the airway lumen configuration, anatomical distortions of the airway framework, and alterations of respiratory aerodynamics. Using image-based airway models, we have developed a metric that accurately captures subglottis patency. While not intended to replace endoscopic evaluation and existing staging systems for laryngotracheal stenosis, further development of these techniques will facilitate future studies of upper airway computational fluid dynamics and the clinical evaluation of airway disease.
Keywords: pediatric airway, laryngotracheal stenosis, 3-dimensional modeling, medical image processing
Laryngotracheal stenosis (LTS) is the most common long-term complication of intubation in neonates. LTS is typically classified by the overall degree of stenosis based on endoscopic evaluation. Additional consideration is given to the location of the stenosis in the subglottic, glottic, or tracheal airway. Little or no consideration is given to the exact shape of the stenosis, and there are no clinical methods to evaluate the stenotic airway in terms of air transport. Descriptions of the lesions based on 2-dimensional assessments do not adequately predict the effect of airway narrowing on air transport parameters. We examine a method for accessing and classifying the laryngotracheal airway in 3 dimensions as a preliminary to further study of the effects of LTS on respiratory aerodynamics. Our objective is to establish a quantitative, 3-dimensional model of the laryngotracheal region for diagnosis and computational modeling of airway stenosis in children.
Methods
The study was approved by the Louisiana State University (LSU) Health Sciences Center institutional review board (LSUHSC IRB 9366). The project is part of a larger effort to characterize the computational fluid dynamics of the pediatric upper airway jointly conducted by the LSU departments of otolaryngology and engineering.
High-resolution computed tomography (CT) scans of the head, neck, and chest regions were studied in children from birth to 12 years of age. Fifty-four studies were selected from the radiology database at Children’s Hospital of New Orleans. The scan sets were collected retrospectively with study dates from September 1, 2015, through December 31, 2016. All selected studies were performed for indications other than airway disease. Prior to modeling, all studies were reviewed for the absence of airway abnormalities. Additional exclusion criteria included vocal fold closure, presence of an artificial airway, and motion artifact. Only studies that included sections from the hypopharynx to the proximal main bronchi were included. Typical indications for the studies included cervical abscess, neck mass, spinal lesion, and metastatic workup.
Scanning parameters were consistent throughout the studies. A 0.5-mm slice thickness with 512 × 512-pixel sections was used in all cases. There was no gantry tilt. All studies were processed with a low-pass convolutional kernel. Image-smoothing effects were corrected in the anatomical segmentation protocol. All scan sets were transferred to disk and were de-identified except for study date, patient birth date, and patient sex.
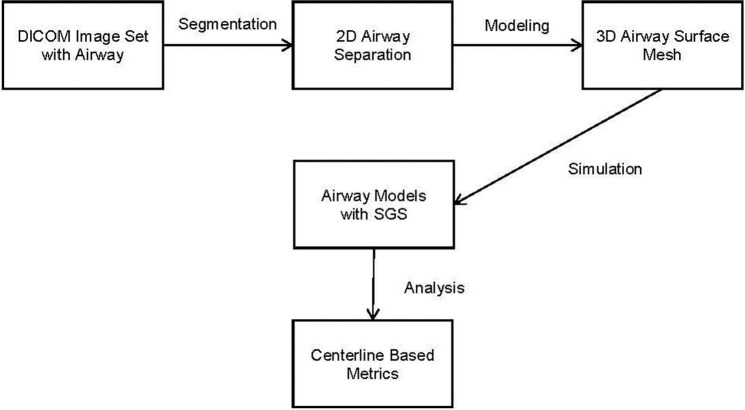
Figure 1 illustrates the project workflow for a given image set. Segmentation is performed on the 2-dimensional images and is defined as the extraction of an anatomical structure or tissue type from the image set. The 3-dimensional representation of the segmentation is called a mask. The mask is used to build a surface representation of the model, the surface mesh. In this case, segmentation separates out air in the respiratory tract. The mask and mesh represent the airway lumen.
Figure 1.
Project workflow. SGS, subglottic stenosis; 2D, 2-dimensional; 3D, 3-dimensional.
Segmentation and Modeling
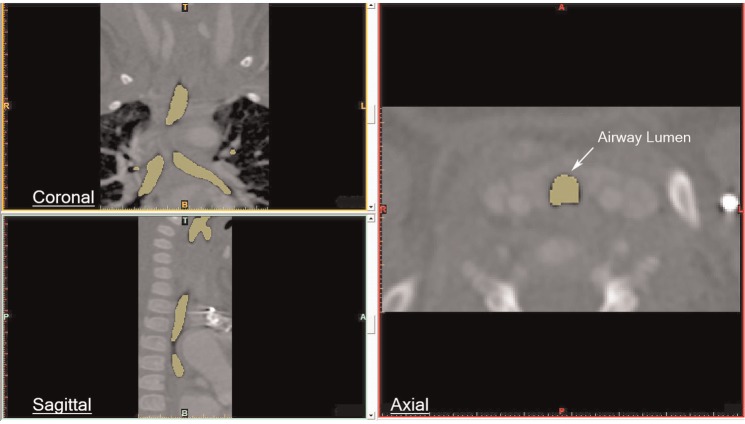
The scan sets were imported into Mimics image-processing and medical modeling software (Materialise, Leuven, Belgium). Segmentation of the pharynx, larynx, trachea, and proximal bronchi was performed using contour extraction and thresholding1 ( Figure 2 ). Typical thresholds for the airway lumen ranged from approximately −1000 to +300 Hounsfield units. Segmentation mask expansion was applied to correct for the convolution kernel setting on the raw images. In a few cases, manual segmentation of 1 or more sections was necessary.
Figure 2.
Segmentation of the airway.
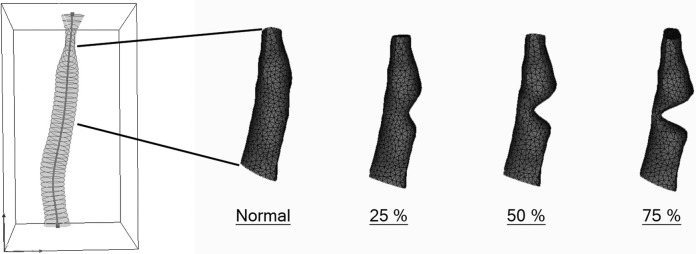
The modeling software created 3-dimensional surface models of the airway lumens that were saved in stereolithographic (stl) format. The model of the subglottis consisted of the portion of the airway starting 1 slice below the most inferior slice through the true vocal folds (noted on the axial 2-dimensional scans) to the point half the distance to the carina. Sinusoidal deformations were applied to the base lumen models to simulate subglottic stenosis. Four subglottic lumen models were saved as 0% (subglottic stenosis [SGS]-0), 25% (SGS-25), 50% (SGS-50), and 75% (SGS-75) stenosis for each image set ( Figure 3 ).
Figure 3.
Airway lumen model indicating subglottis with simulated stenosis.
Centerline Metrics and Analysis
Centerline extraction constructs a 1-dimensional curve that courses through the lumen center, including any branches and end points. The airway centerlines are constructed in software as cubic spline curves from the segmented scan sets.2 Cross-sectional metrics calculated at intervals along the centerline curve provide comparative statistics of the model geometry. Metrics used in this study included the cross-sectional area (A) and perimeter (P) ( Figure 4 ).
Figure 4.
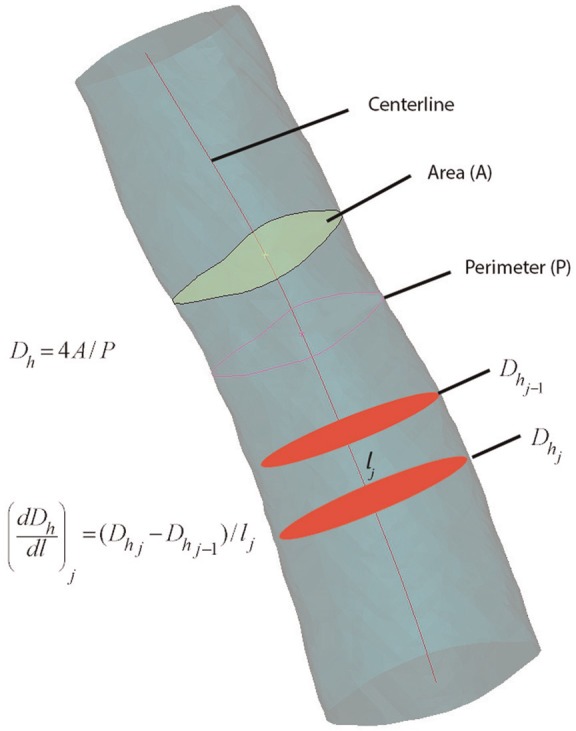
Centerline metrics.
Prior studies have documented the usefulness of the centerline method for virtual bronchoscopy, and several algorithms for centerline extraction have been developed.3,4 Here we use Mimics implementation of the adaptive segmentation and centerline construction algorithm.5 The method has been validated against exact synthetic tubular models, and the median deviation of the centerline from exact measurements is typically less than 1 voxel diameter.2 It reliably extracts up to third-generation airways segmented for the laryngeal, tracheal, and bronchial passages. Problems can occur at the end points of the centerline, and these require manual correction or cutting of the centerline.
Until recently, segmentation and metrics were a matter of time-consuming manual outlining and measurement. Automated and semiautomated techniques currently available allow processing of large numbers of data sets and eliminate the interobserver variation associated with manual segmentation.
Statistical Methods: Geometric Analysis
Meaningful conclusions regarding the image-based airway models require geometric and aerodynamic parameters of 3-dimensional airway patency. We require parameters that are statistically valid across 3-dimensional variation in the tubular shape of the models. Perfect cylinders, for example, are completely specified for computational purposes with the radius and length. For the complex shape of the airway models, we developed a dimensionless parameter that reflects airway patency.
Initial analyses were performed by regressing the models’ average diameter, length, and volume against patient age. A separate multilinear analysis that included age and sex indicated that patient sex did not alter the regression.
At any point along the centerline, the hydraulic diameter, Dh, of a tubular structure is defined as
where is the cross-sectional area and is the perimeter length. The hydraulic diameter equates the cross-sectional shape to a circular disc and is useful for comparing tubular structures with different configurations. The overall length of the subglottis and centerline cross-sectional parameters were tabulated in text files.
Since Dh and length are independent predictors, a dimensionless parameter incorporating these 2 parameters was developed. The hydraulic diameters were collected along k regular centerline intervals for each model. The interinterval changes in Dh were tabulated from the first through the kth sections. The value of the interslice change in Dh divided by the interslice distance along the centerline () yields the gradient of hydraulic diameter ():
We scaled the hydraulic diameter gradient by a factor that captures the rates of contraction—expansion of the lumen to derive the scaled hydraulic diameter gradient (). The scaled hydraulic diameter gradient for slice j is
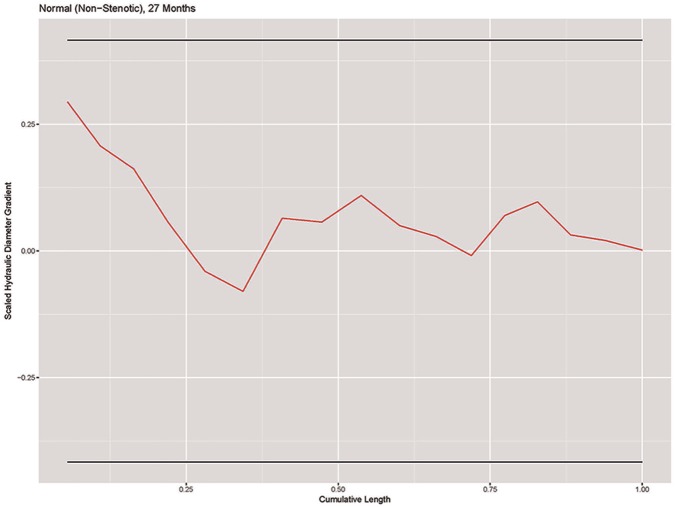
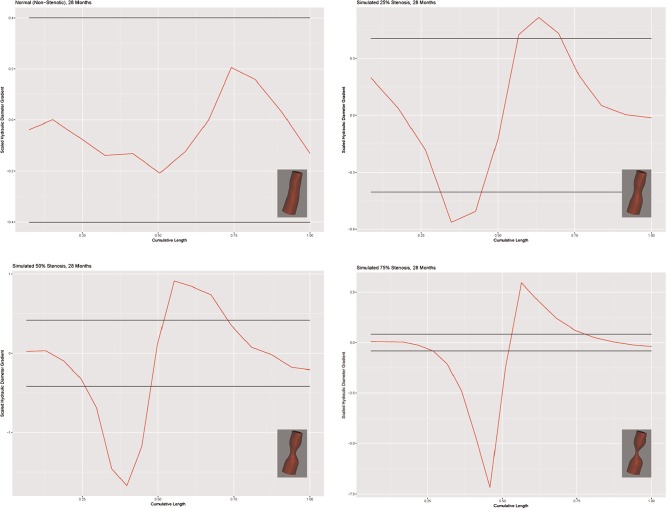
Using the standard deviation of the scaled gradient for the 54 normal models, we derived a normal range of scaled hydraulic diameter variation as a function of model geometry. A plot of the scaled hydraulic diameter gradient vs centerline distance for a normal subglottic airway is shown in Figure 5 . The horizontal lines represent the 95% confidence range.
Figure 5.
Plot of scaled hydraulic diameter gradient vs centerline difference in a representative SGS-0 model. SGS, subglottic stenosis.
Two-Dimensional Stenosis Classification
Due to excessive drift in the centerline fit at the beginning and end of the subglottis, we eliminate the first and last slices. Then, given = 1, . . ., n subjects with = 1, . . ., slices per subject, we calculate the scaled hydraulic diameter gradient for each slice:
For normal models, we assume that δ is normally distributed with mean 0 and an unknown standard deviation.
After fitting a log-normal regression model with as the response and age as the predictor, we find that age is not a strong predictor of the standard deviation of . Therefore, we use the pooled standard deviation,
From the 54 SGS-0 models, we find that = 0.140. Using the pooled standard deviation, we calculate boundaries
where is the xth quantile of the normal distribution. A Bonferroni correction6 is applied to adjust the confidence intervals for the stenotic models to account for the variable number of measurements along the centerline.
For each subject, if < < for all , then we classify the subject as nonstenotic. If any crosses 1 or both boundaries, we classify the subject as stenotic. We then calculate the percentage size of the stenosis as
Classification of 3-Dimensional Models
To extend the concept of the scaled hydraulic diameter gradient as a descriptor of 3-dimensional geometry, we integrate the parameter over the entire model and then divide by the centerline length. From the discrete form of the integration, we developed the total scaled hydraulic diameter gradient as
The total scaled hydraulic diameter gradient is a nondimensional scalar value that captures the geometry of the entire subglottic space.
Results
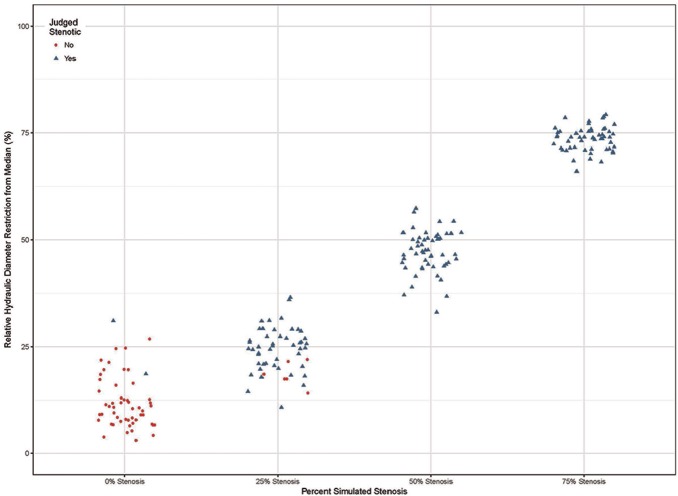
Figure 6 shows the models and scaled Dh gradient plots for a representative case (28-month-old female). The scale is adjusted for each plot to accommodate the size of the graph (hence the visual change in the apparent width of the confidence intervals). The x-axis shows the distance along the centerline with hydraulic diameter gradient along the y-axis. The horizontal lines represent the 95% confidence interval. The scaled hydraulic diameter gradient metric correctly classified the SGS-0 group in 43 of 54 models. Eleven models were classified as stenotic; 2 were classified greater than 25%. The algorithm failed to detect the stenosis in 5 of the models in the SGS-25 group. The algorithm accurately identified a stenosis in all SGS-50 and SGS-75 models. Overall, the determination of stenosis was accurate in the clinically significant range of 25% to 75%. The results are summarized in the scatterplot depicted in Figure 7 .
Figure 6.
Models and scaled hydraulic diameter gradient plots for a 28-month-old female.
Figure 7.
Correlation of Dh gradient with simulated stenosis.
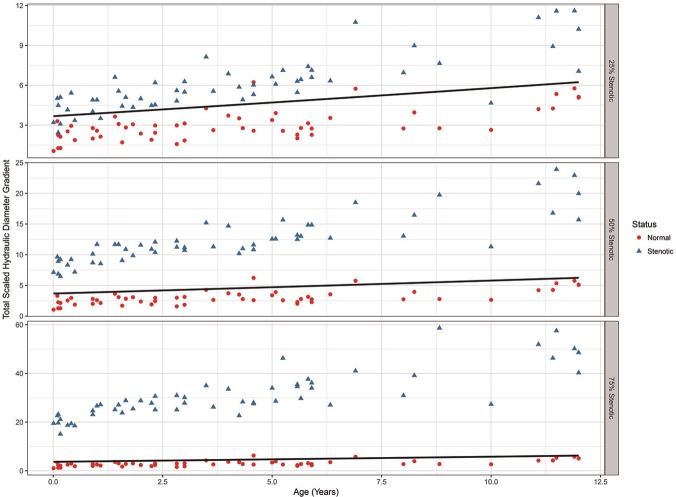
Figure 8 shows the total scaled hydraulic diameter gradient for the SGS-25, SGS-50, and SGS-75 models as a function of age. The circles on each plot are the normal values for the SGS-0 models, and the solid lines represent the 95% upper confidence level for the normal airway. Note the differences in the y-axis scale for each plot. Regression analysis shows a dependence on age that is stable across the degree of stenosis (R2 = 0.42). Increased scatter in older subjects is observed in all the abnormal models and probably reflects nonlinear variability in tracheal length and/or tortuosity. Six subjects in the 25% stenosis group were classified as normal. Five of these were less than 2 years of age. The 50% and 75% stenosis models were all classified as abnormal.
Figure 8.
Total scaled hydraulic diameter gradient vs subject age.
Discussion
Laryngotracheal stenosis is the narrowing of the laryngeal and tracheal airway. Most cases are acquired and result from endotracheal intubation.7 The subglottic space is the most common site of involvement. The narrowing can be partial or complete and can take on a complex configuration in 3 dimensions. Symptoms range from stridor and dyspnea to loss of airway and tracheostomy dependence. The altered aerodynamics may also effect mucocilliary mechanics and airway clearance. Operative airway endoscopy under general anesthesia is the standard for evaluating and staging LTS. The condition is usually managed surgically with endoscopic or open reconstruction of the stenotic segment.8
Most comparative studies of LTS use the Meyer-Cotton classification.9 The system yields a percentage of stenosis based on air leak as a function of endotracheal tube size. Four grades of stenosis are recognized ( Table 1 ). While the air leak provides information about overall upper airway patency, the endoscopy-based system is inherently 2-dimensional and cannot be applied to studies of airway fluid dynamics. Endoscopy-based classification may not correlate with quantitative 3-dimensional measurements and probably does not predict the aerodynamics.
Table 1.
Meyer-Cotton Classification.
| Stenosis | From (%) | To (%) |
|---|---|---|
| Grade 1 | 0 | 50 |
| Grade 2 | 51 | 70 |
| Grade 3 | 71 | 99 |
| Grade 4 | No detectable lumen | |
Statistical classification of 3-dimensional anatomical structures is difficult. Previous studies have focused on complex statistical shape analysis using computer vision techniques. Computational approaches include shape morphing, automated recognition of specific anatomical regions, and computer vision algorithms.10,11 Our approach is simplified by limited segmentation of the airway with recovery of the 3-dimensional shape of the subglottic region. Statistical analysis is then limited to scalar variables relevant to upper airway aerodynamics. We feel this technique could be used to develop a semiautomated approach to airway classification based on focused imaging with limited radiation exposure. The 3-dimensional view may provide additional insights, especially in cases of continued airway symptoms, despite the appearance of an adequate airway on endoscopy.
One of the limitations of our approach is decreased accuracy in classifying the normal and 25% stenoses. However, detection is sensitive and specific in the clinical range of 25% to 75% stenosis, where the aerodynamic effects are less clear. Our preliminary computational fluid dynamics evaluation of the mid-level stenoses indicates significant variation in airway resistance and flow/pressure field characteristics.
As noted, the total scaled hydraulic diameter gradient remains age dependent. Ultimately, one would prefer a single parameter range across all ages that predicts the aerodynamic effects of laryngotracheal stenosis. The total scaled parameter is also path independent and will probably not accurately reflect complex, multilevel stenosis in a single model. We are evaluating spectral methods for analyzing the image-based airway reconstructions that may improve the low-frequency (less narrow) and multilevel stenosis classification. We may also be able to eliminate the age dependence in children younger than 12 years.
The methods and results of this geometric study can be extended to a computational fluid dynamics analysis of the upper airway in children.12 Computational fluid dynamics of the upper airway is complicated by several anatomical features, including the dynamic changes in the airway caliber and configuration as a function of the respiratory cycle. The mucociliary mechanism also requires consideration. Researchers may be able to model these features using fluid-structure interaction models. Once the structural properties of the airway wall are defined mathematically, the 3-dimensional models of the airway used in computational fluid dynamics can be extended to these more complex interactions.
Aerodynamically, airway resistance is probably the best measure of flow alteration in a closed narrow channel such as the laryngotracheal airway.13,14 Other parameters include localized flow velocities, airway wall pressures, airway wall shearing forces, and turbulence. Limiting the aerodynamic study to the subglottic segment does not reflect upstream and downstream effects of stenosis. However, analysis of only the subglottis is efficient and may allow comparison across age groups and differing degrees of stenosis.
Author Contributions
Lee S. McDaniel, study design, data analysis and interpretation, manuscript review and editing; William J. Poynot, literature review, data analysis and interpretation, manuscript review; Keith A. Gonthier, study design, data analysis and interpretation, manuscript review and editing; Michael E. Dunham, principal investigator, literature review, study design, data collection, manuscript preparation and review Tyler W. Crosby, study design, manuscript review and editing.
Disclosures
Competing interests: None.
Sponsorships: None.
Funding source: LSU Biomedical Collaborative Research Program, Pennington Biomedical Research Center.
Footnotes
Sponsorships or competing interests that may be relevant to content are disclosed at the end of this article.
References
- 1. Yushkevich PA, Piven J, Hazlett HC, et al. User-guided 3D active contour segmentation of anatomical structures: significantly improved efficiency and reliability. Neuroimage. 2006;31:1116-1128. [DOI] [PubMed] [Google Scholar]
- 2. Wan M, Liang Z, Ke Q, et al. Automatic centerline extraction for virtual colonoscopy. IEEE Trans Med Imaging. 2002;21:1450-1460. [DOI] [PubMed] [Google Scholar]
- 3. Smistad E, Elster AC, Lindseth F. GPU accelerated segmentation and centerline extraction of tubular structures from medical images. Int J Comput Assist Radiol Surg. 2014;9:561-575. [DOI] [PubMed] [Google Scholar]
- 4. Reynisson PJ, Scali M, Smistad E, et al. Airway segmentation and centerline extraction from thoracic CT—comparison of a new method to state of the art commercialized methods. PLoS One. 2015;10:e0144282. [DOI] [PMC free article] [PubMed] [Google Scholar]
- 5. Jiang G, Gu L. An automatic and fast centerline extraction algorithm for virtual colonoscopy. Conf Proc IEEE Eng Med Biol Soc. 2005;5:5149-5152. [DOI] [PubMed] [Google Scholar]
- 6. Glantz S. Primer of Biostatistics. 7th ed. New York, NY: McGraw-Hill; 2012. [Google Scholar]
- 7. Benjamin B, Holinger L. Laryngeal complications of endotracheal intubation. Ann Otol Rhinol Laryngol. 2008;117:2-20. [Google Scholar]
- 8. Monnier P, ed. Pediatric Airway Surgery, Management of Laryngotracheal Stenosis in Infants and Children. Heidelberg, Germany: Springer; 2011. [Google Scholar]
- 9. Myer CM, O’Connor DM, Cotton RT. Proposed grading system for subglottic stenosis based on endotracheal tube sizes. Ann Otol Rhinol Laryngol. 1994;103:319-323. [DOI] [PubMed] [Google Scholar]
- 10. Heimann T, Meinzer HP, Statistical shape models for 3D medical image segmentation: a review. Med Image Anal. 2009;13:543-563. [DOI] [PubMed] [Google Scholar]
- 11. Lesage D, Angelini ED, Bloch I, et al. A review of 3D vessel lumen segmentation techniques: models, features and extraction schemes. Med Image Anal. 2009;13:819-845. [DOI] [PubMed] [Google Scholar]
- 12. Martonen T, Zhang Z, Lessmann R. Fluid dynamics of the human larynx and upper tracheobronchial airways. Aerosol Sci Technol. 1993;19:133-156. [Google Scholar]
- 13. Wootton D, Luo H, Persak S, et al. Computational fluid dynamics endpoints to characterize obstructive sleep apnea syndrome in children. Appl Physiol. 2014;116:104-112. [DOI] [PMC free article] [PubMed] [Google Scholar]
- 14. Casey KP, Borojeni AA, Koenig LJ, et al. Correlation between subjective nasal patency and intranasal airflow distribution. Otolaryngol Head Neck Surg, 2017;156:741-750. [DOI] [PMC free article] [PubMed] [Google Scholar]


