Abstract
Background.
Although pollution is the largest environmental cause of disease and premature death in the world today, it does not receive consistent and commensurate public attention.
Objectives.
This paper quantifies this phenomenon, tracks recent efforts, and offers strategies for improving pollution awareness.
Methods.
Google Trends allows a user to compare up to five terms or topics simultaneously. Results are displayed as a set of time series. The values displayed are not the actual search counts but percentages relative to the total searches across the specified geography (worldwide, country, state/province, and city) and time period. The resulting numbers are then scaled from 0 to 100 (to create an Interest Index) based on the proportion to all searches on all terms or topics.
Discussion.
Pollution interest can be quite different at a country level compared with the worldwide view. Predictably, pollution interest is highest in many of the countries most affected by pollution. However, many of the wealthiest countries show low interest in pollution.
Conclusions.
Solving any problem begins with awareness, which generates concern and understanding, followed by action. Determining what issues people are searching on provides a reliable barometer of the true interest in and awareness of an issue. Google Trends provides a mechanism to help track ongoing pollution problems and solutions.
Disclaimer.
The author serves as the Chief Technical Officer of Pure Earth. The author had no role in the review of or decision to accept this manuscript.
Competing Interests.
The author declares no competing financial interests
Introduction
In the era of big data, search queries often reveal hidden opinions and unforeseen behaviors. What people say often differs from how they feel, which can be confirmed by examining Internet searches where users are more apt to type in their true feelings.1 Similarly, search engine query data have been used in the healthcare field to track influenza epidemics by detecting the rise in searches such as “do I have the flu?” and “I feel sick”.2
This paper leverages this same tracking mechanism to quantify pollution awareness. Are people truly aware of the pollution problem? Are Influential publications making a difference? Using the underlying search data from Google Trends helps us to answer these questions and plan better strategies.
Methods
Google, the world's most popular search engine, currently processes on average over 40,000 search queries every second, which translates to 1.2 trillion searches annually worldwide.3 Google logs the searches from their News, Search, and YouTube platforms and then provides a sampling on Google Trends4 for review and analysis by anyone. Examining search terms provides a factual perspective on topics which currently interest and concern people.
The Google Trends database is searchable by term, geography, and time with a one-week sampling rate. Google also categories searches into topics - groups of terms that share the same concept across languages. For example, one can query for the specific term “baseball” or the broad topic of “baseball” where the latter includes variations such as baseball schedule, baseball playoffs, mlb, beisbol, etc.
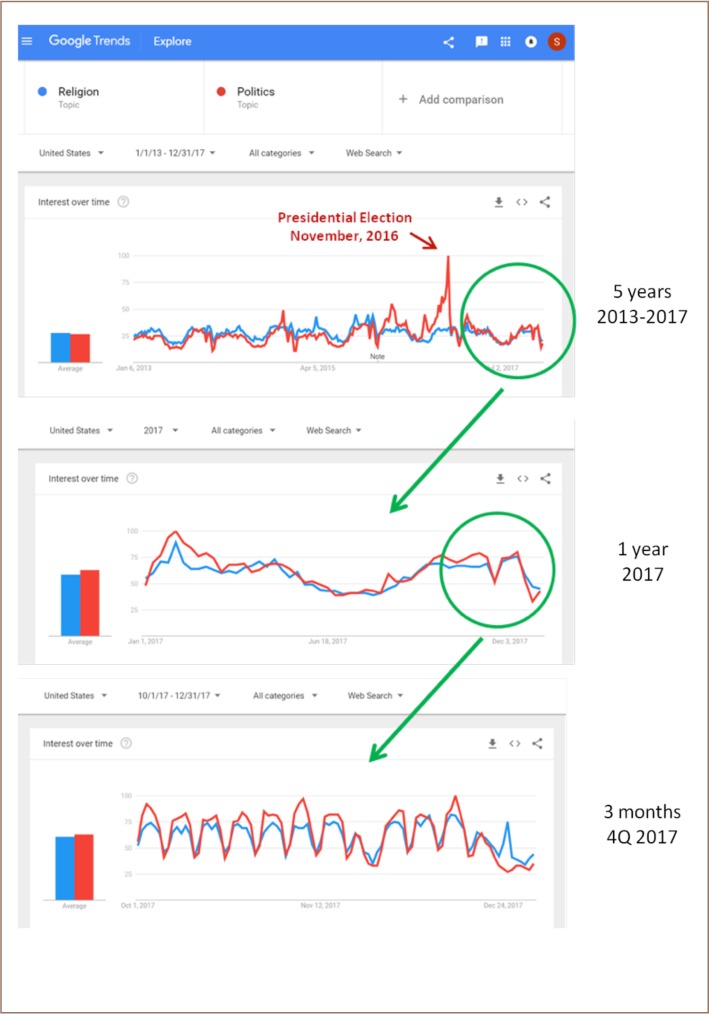
Google Trends allows a user to compare up to five terms or topics simultaneously. Results are displayed as a set of time series. The values displayed are not the actual search counts but percentages relative to the total searches across the specified geography (worldwide, country, state/province, and city) and time period. The resulting numbers are then scaled from 0 to 100 (to create an Interest Index) based on the proportion to all searches on all terms or topics. As an example, Figure 1 shows a screenshot comparing two topics (religion and politics) searched in the United States over three time periods: five years (2013–2017), one year (2017), and 3 months (4Q2017). Clearly, the peak interest occurred for politics in November 2016 during the US Presidential election. Note how the relative proportions remain the same within the data when rescaled in the 1-year and 3-month views.
Figure 1.
United States interest in religion and politics over three time periods
The present study analyzes Google Trends data collected for all categories of web search over the five-year period from 2013 through 2017 comparing four key health topics: pollution, HIV/AIDS (human immunodeficiency virus/acquired immunodeficiency syndrome), tuberculosis, and malaria. For readers interested in processing these same data, note that Google Trends re-labels HIV/AIDS as an illness and malaria and tuberculosis as diseases. Using geographic filters, the data was accumulated and considered at a worldwide level and at country-specific levels. In addition, the 2017 per capita gross domestic product (GDP) per country, obtained from the International Monetary Fund website was folded into the analysis.4
Google Trends data are easily exported into comma-separated values (CSV) format. For ease and flexibility of analysis, the raw CSV data were imported into a relational database, making it available for queries and data processing using structured query language (SQL) and the perl programming language.
Results
The data analysis addresses three specific behaviors:
Worldwide interest in pollution versus other important health issues
Pollution interest and resources by country
Impact of influential publications on pollution awareness
Abbreviations
- GDP
Gross Domestic Product
Worldwide interest in pollution vs. other important health issues
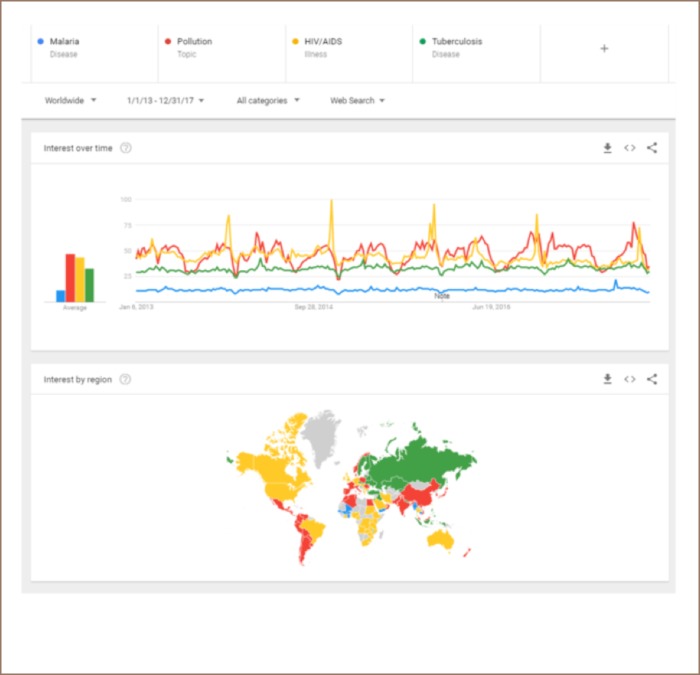
Figure 2 is a screenshot of the Google Trends comparison between the four health issues at a worldwide level for the five-year period from 2013 to 2017. The top graph shows the interest over time and the bottom graph shows the interest by region.
Figure 2.
Google Trends comparison between four health issues from 2013 to 2017 over time and by region
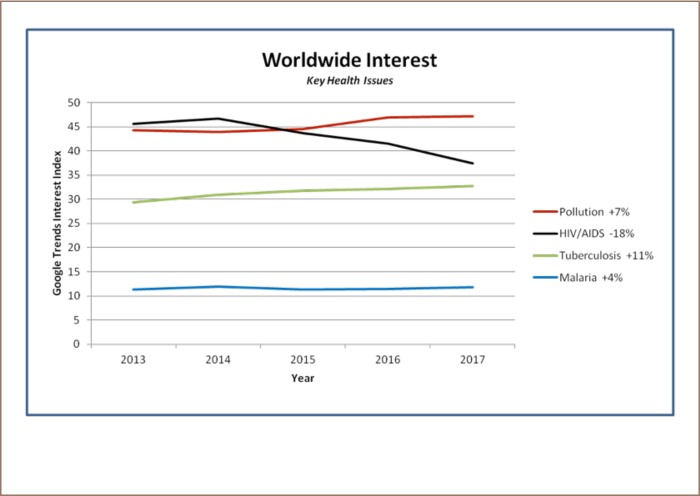
The weekly Interest Index samples were exported and then averaged by issue and year to produce the smoother tracks shown in Figure 3. The corresponding growth rates (calculated as the percent change between the 2013 and 2017 averages for each issue) are shown in the legend. Note that the HIV/AIDS data are plotted black instead of yellow for easier readability.
Figure 3.
Worldwide interest in four key health issues according to Google Trends interest index
Pollution interest and resources by country
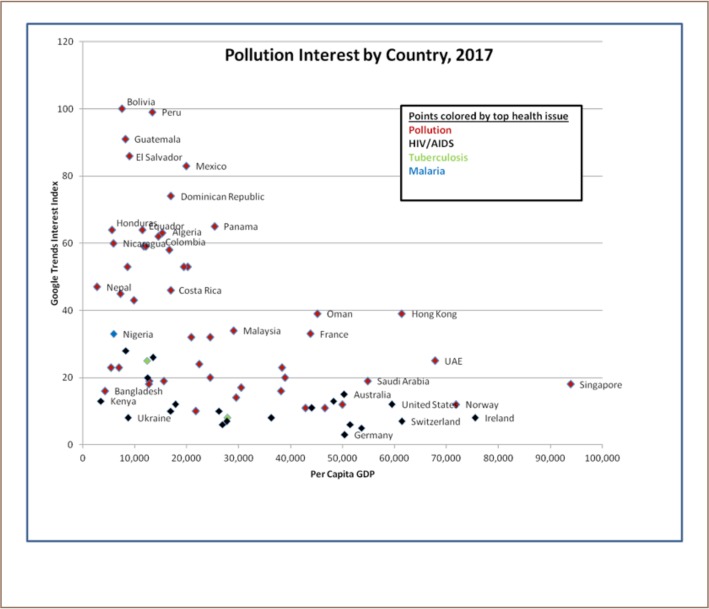
The next analysis considers more recent data with finer geographic granularity. Figure 4 is a scatter plot of the 2017 pollution interest index (y-axis) versus per capita GDP (x-axis). Data points represent individual countries and are color-coded by the highest-ranking health issue (of the four considered) as shown in the legend.
Figure 4.
Pollution interest and resources by country
Impact of influential publications on pollution awareness
Figure 5 focuses on worldwide pollution interest during the 4Q of 2017 when two influential reports were released: The Lancet Commission on pollution and health5 (the Lancet Report), and Toward a Clean World for All: An Evaluation of the World Bank Group's Support to Pollution Management6 (the World Bank Report). The time series chart shows the weekly sampling rate on the x-axis and is annotated with report dates, before/after measurements and the growth trend.
Figure 5.
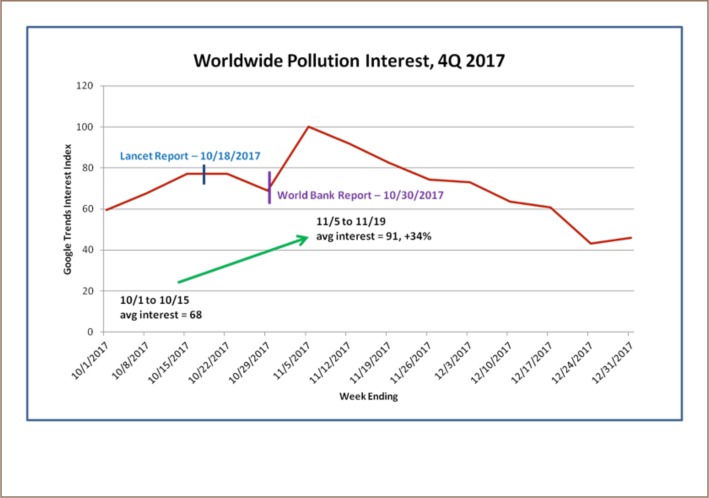
Impact of influential publications on pollution awareness
Discussion
Worldwide interest in pollution vs. other important health issues
The five-year comparison data shows some surprising results, with worldwide interest in pollution currently exceeding the individual interest levels for HIV/AIDS, tuberculosis and malaria. In Figure 3 we see an encouraging crossover in 2015 when pollution interest first exceeded interest in HIV/AIDS. Without knowing the underlying terms that represent each topic, the big question is “is this a fair comparison?” The regional view in Figure 2 supports the data validity, as each health issue is properly aligned with countries where these issues are most prevalent. In addition, Google Trends provides a mechanism for checking related queries where “users also searched these terms.” Top terms for each issue include:
Pollution: contaminacion, la contaminacion, air pollution
HIV/AIDS: aids, sida, hiv
Tuberculosis: tb, tuberculose, tb test
Malaria: symptoms malaria, paludisme, paludismo
Even assuming some classification inaccuracy, the increase in pollution interest is obvious.
Pollution interest and resources by country
Scrutiny of the geography reveals that pollution interest can be quite different at a country level compared with the worldwide view. Predictably, pollution interest is highest in many of the countries most affected by pollution. Of the top ten countries with the highest pollution interest, five are in Central America, three are in South America, one is in the Caribbean, and one is in Africa. In Figure 4 these results are plotted vs. per capita GDP, allowing us to segregate the data into countries (like Panama and Mexico) that have more internal resources available for remediation, versus countries (like Honduras and Bolivia) that may require funding from outside organizations.
Figure 4 shows that many of the wealthiest countries show low interest in pollution. Is this because pollution is not as visible in these nations, or because there are higher priorities? Whatever the reason, public awareness campaigns should emphasize that pollution is a shared threat to all nations.
The impact of influential publications on pollution awareness
The Lancet and World Bank reports5,6 were both released in late October 2017, only twelve days apart. The impact of each report individually, considering how closely they were released, is indistinguishable. Therefore, their combined impact was consideredFigure 5 measures the average interest in the 15 days before the release of the Lancet report and the 15 days after the release of the World Bank report. The measurements reveal a 34% increase in pollution-interest from both reports together. Unfortunately, this is a short-term boost with interest falling back to the original level within 6 weekshighlighting the importance of periodic updates and continual reminders.
For reference, Figure 6 is a screenshot of the full 2017 track showing various peaks and valleys and the same dramatic spike in early November.
Figure 6.

Pollution interest over time
Conclusions
Solving the pollution problem begins with awareness, which generates concern and understanding, followed by action. Determining what issues people are searching on provides a reliable barometer of the true interest in and awareness of an issue. Google Trends provides a mechanism to help track ongoing pollution problems and solutions.
Further studies could use real-time Google Trends data (containing hourly samples over up to seven days) to monitor awareness and remediation as relevant political and environmental events unfold. In these situations, the data could be further refined to state, province, and city levels, as needed, to measure the effectiveness of publicity and communication strategies.
References
- 1.Stephens-Davidowitz S. Everybody lies: big data, new data, and what the internet can tell Us about who we really are. New York: Dey Street Books; 2017. p. 352. p. [Google Scholar]
- 2.Ginsberg J, Mohebbi MH, Patel RS, Brammer L, Smolinski MS, Brilliant L. Detecting influenza epidemics using search engine query data. Nature [Internet] 2009 Feb;457:1012–14. doi: 10.1038/nature07634. [cited 2018 May 23] Available from: https://www.nature.com/articles/nature07634 Subscription required to view. [DOI] [PubMed] [Google Scholar]
- 3.Google trends [Internet] Mountain View, CA: Google; 2006. May 11, [cited 2018 May 23]. Available from: https://trends.google.com. [Google Scholar]
- 4.International monetary fund [Internet] Washington, D.C.: International Monetary Fund; c2017. [cited 2018 May 23] Available from: http://www.imf.org. [Google Scholar]
- 5.The Lancet Commission on pollution and health The Lancet [Internet] 2018 Feb;391(10119):462–512. doi: 10.1016/S0140-6736(17)32345-0. [cited 2018 May 23] Available from: http://www.thelancet.com/commissions/pollution-and-health. [DOI] [PubMed] [Google Scholar]
- 6.The World Bank Toward a Clean World for All: An Evaluation of the World Bank Group's Support to Pollution Management. http://ieg.worldbankgroup.org/evaluations/pollution [cited 2018 May 23]


