Abstract
A miniaturized particulate matter (PM) sensing platform was developed. The platform uses a CMOS imager as sensor, electrostatic particle collector to collect ambient PM on an imaging substrate, and a laser diode as light source to scatter light from the particles. Image processing based PM sensing algorithm was developed to obtain particle number, size and size distribution in real time. The system is compact, power efficient, and low cost. The PM sensing platform is suitable for personal PM exposure monitoring with applications in environmental health, occupational and epidemiological studies.
Keywords: Particulate Matter sensing, environmental sensors, CMOS imager, electrostatic particle collector, image processing algorithm
I. INTRODUCTION
Particulate Matters (PM) has a broad range of adverse health effects especially on the respiratory system. It has been shown that PM can cause airway inflammation due to its oxidative potential [1–2]. Furthermore, their nanometer to micrometer sizes allow them to go deep inside the lungs end up in the blood stream. Clinical studies have correlated higher exposure to PM with higher asthma occurrence rate, especially among children, and smaller PM poses greater health risk than bigger PM [1–5].
In order to better understand PM’s epidemiological effects, large scale and real-time PM exposure monitoring is needed by physicians. Moreover, personalized, real-time PM exposure monitoring is of great value for asthma management. This also applies to anyone who wants to monitor their personal environmental exposure to PM. Hence, large scale, portable and real-time PM monitor is of great value to both researchers and the general public.
PM researchers have developed different types of PM monitors based on different mechanisms over the past several decades and most of which have been commercialized. For example, Virgil et al have studied the efficient design of impactor, which takes advantage of PM’s size dependent inertia to separate PM according to their sizes [6][7]. Particle detection based on dynamic light scattering principle has been a popular approach. Study of the particle behavior under a flow stream inside the Aerodynamic Particle Sizer (APS) has been conducted by Cheng et al [8]. More detailed study includes particle shape based correction and calibration have been conducted by Wang et al, Stein et al and Chien et al [9–11]. Scanning mobility particle analyzer uses particle’s different electrostatic mobility under electrostatic field to separate particles according to their sizes [12]-[13]. In order to detect nanometer sized PM, liquid condensation technique was used to increase particle’s scattered light intensity [14–16].
Despite numerous advancements in developing PM monitors, their disadvantages are also obvious. Firstly, although instrument-grade PM monitors have high sensitivity and can differentiate size, they are in large form factor and usually in bench-top forms, which makes them inconvenient if not impossible to conduct field test. More importantly, they usually cost tens of thousands of dollars and hence impractical for personal monitoring, and for large-scale cohort environmental health studies. The other end of the spectrum is cheap and small form factor smoke detectors and sensors, such as Telaire Dust Sensor [17] and other low cost particle detector modules (Shinyei PPD71, PPD42NJ, and PPD20V) [18], which use scattered light principle to detect dust. However, this type of sensor only works at high dust concentration and can be inaccurate due to particulate matter movement and highly inhomogeneous shape factor, both of which are intrinsic to dynamic light scattering method [19].
This research aims to develop an inexpensive and small form factor PM sensor using CMOS imager for real time PM monitoring. Low cost (e.g., $1), miniaturized, high performance CMOS imagers are readily available [20–23]. For example, Sony IMX219 image sensor has resolution of 3280 by 2464 and pixel size of 1.1 µm, which is suitable for submicron size PM sensing [22]. In addition to CMOS imagers for direct imaging and detection of PM, an efficient way to collect PM for imaging, and lighting condition for low noise imaging of PM are critical. We developed an electrostatic particle collector to collect PM on a transparent substrate, and low background noise optics to image light scattered from the collected particles.
Our personal PM detector offers several distinct features compared to the existing light scattering-based PM detectors:1) Instead of detecting scattered light, we image individual particles, which allows analysis of both particle size and scattering intensity; 2) PM is collected on the substrate, which could be further analyzed with chemical analysis and high resolution imaging tools for detailed chemical composition and morphology study of the collected PM; 3) Electrostatic particle collector can classify particles according to their sizes and can be imaged simultaneously; 4) The optical design and imaging capability make it possible to integrate other optical sensors, such as colorimetric chemical sensors, for simultaneous chemical sensing [21, 24].
II. EXPERIMENTAL RESULTS
In order to use CMOS imager as sensor for PM, detection limit and sensitivity need to be evaluated. In other words, the minimum detectable size of the particles using a commercial CMOS imager under a fixed and optimized laser source must meet the requirements for target applications. Moreover, the correlation between the light intensity of PM particles in the CMOS images verses PM size will be needed. Fig. 1 illustrates the optical setup of the PM detector. A 650 nm wavelength laser source was collimated and directed to illuminate a transparent substrate (glass slide) for PM imaging. To obtain a calibration curve, polystyrene (PS) particles (Bangs Laboratories, Inc.) with well-defined diameters, varying from 0.5 µm to 10 µm, were deposited on the transparent substrate. To minimize possible aggregation of the PS particles, the PS samples were dissolved in ethanol, diluted multiple times then sonicated for an hour. The transparent substrate was dipped in the diluted PS solution, dried out and then placed directly on top of the CMOS imager housing. The CMOS imager used was Quickcam Deluxe from Logitech and its lens was adjusted to a desired focal length to obtain a sharp image of the PS beads on the substrate. The angle between laser beam and the substrate surface was fixed at 20 degrees, which was empirically determined by experiments to obtain higher particle scattered light signal and lower background noise from the scattering of substrate.
Fig. 1.
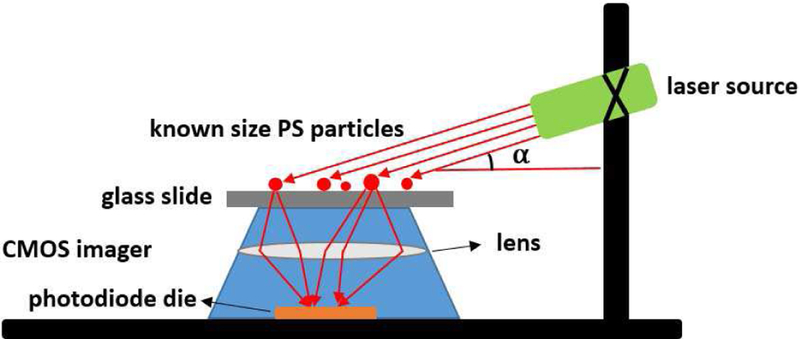
Schematic drawing of CMOS imager PM sensing evaluation.
The setup shown in Fig. 1 does not have sufficient resolution to resolve the size of a micro-scale particle, but the CMOS imager captures the individual particles as bright spots as shown in Fig. 2. In order to confirm that the bright spots were indeed scattered light from individual PS particles, we examined the same substrate with an optical microscope (numerical aperture of 0.4). It is noteworthy to point out that the theoretical optical resolution (the ability to tell two objects apart) of the microscope is 0.81 µm at 650 nm. Nonetheless, since the particles are generally well dispersed and are essentially spherical, by relying on the scattered light, which makes objects appear larger than they really are, we can reliably identify the approximate location of the particles by finding the centroid of the bright spots. The spatial distribution of the particles resolved by the optical microscopy images match well with the scattered light images captured by the CMOS imager as shown in Fig. 2. Additionally, the sizes directly measured with the optical microscope correlate well with the image intensities of the corresponding particles. This analysis confirms that the bright spots captured by the CMOS imager were indeed scattered light signal from individual particles.
Fig. 2.
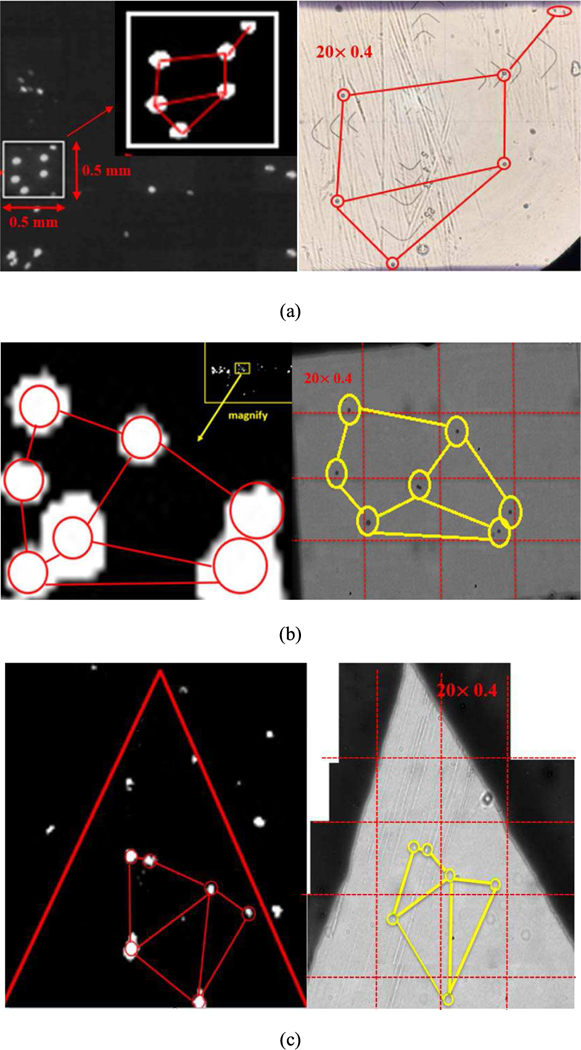
Comparisions of particle distribution pattern between the CMOS imager image and the optical microscope image mosiac at 20 times optical magnification and 0.4 numerical aperture. Size of particles used are (a) 10 µm, (b) 5 µm, and (c) 0.5 µm.
Fig. 3 below shows the experimental data for particle light intensity versus particle diameter in micrometers, as well as the 4th order polynomial fit. 4th order polynomial fit was chosen because Mie scattering theory is assumed for particles ranging from 0.5 µm to 10 µm in diameters [25]. Fraunhofer scattering applies to particles bigger than 50 µm while Rayleigh scattering applies to particles smaller than 1/10 of the scattering light wavelength, hence, neither is used here.
Fig. 3.
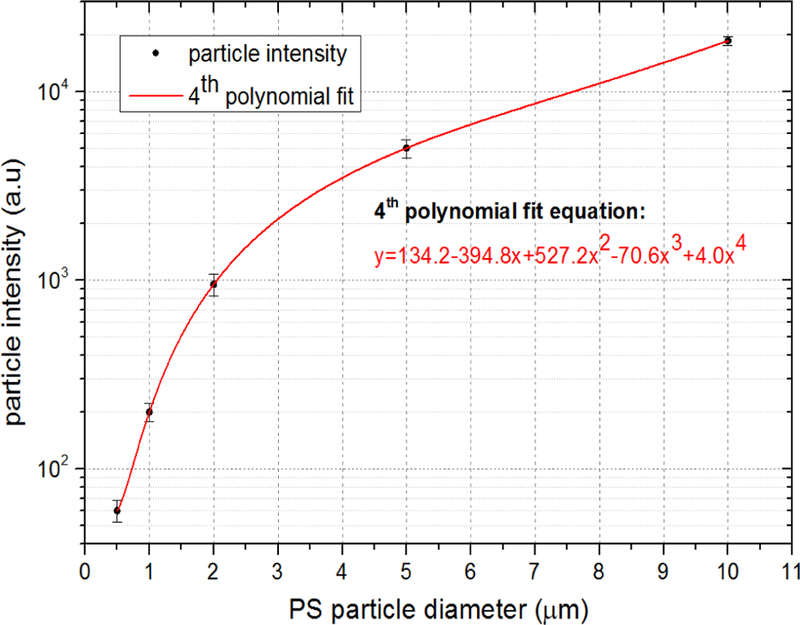
Calibration curve showing PS particle diameter in micrometer and PS particle intensity assuming Mie scattering.
Through careful design of experiments, we demonstrated the capability of this novel imaging based real time PM sensing approach with single particle size resolution and single pixel detection limit, which is not possible for dynamic light scattering method.
III. RESULTS AND DISCUSSION
A. Electrostatic Particle Collector Design, Simulation and Fabrication
In order to collect airborne particles on the imaging substrate, electrostatic principle and active sampling were used. Mizuno and Leonard et al. studied the principle of electrostatic precipitator as well as particle transport physics [26–27]. Electrostatic precipitator has been used to clean industrial gas exhausts and the particle collection process has been simulated to improve the collection efficiency [28–30]. We have simulated using COMSOL 5.0 and designed a miniaturized particle collector with high collection efficiency for the CMOS imager sensing platform.
Firstly, we used SolidWorks to prototype the 3D geometry of the particle collector consisting of a collection chamber 20mm long, 4mm wide, and 0.5 mm in height. Cylindrical inlet and outlet (3 mm and 2 mm in diameters respectively) are located at each side of the collection chamber with a height of 5 mm. The drawing was then imported into COMSOL for simulation as shown in Fig. 4.
Fig. 4.
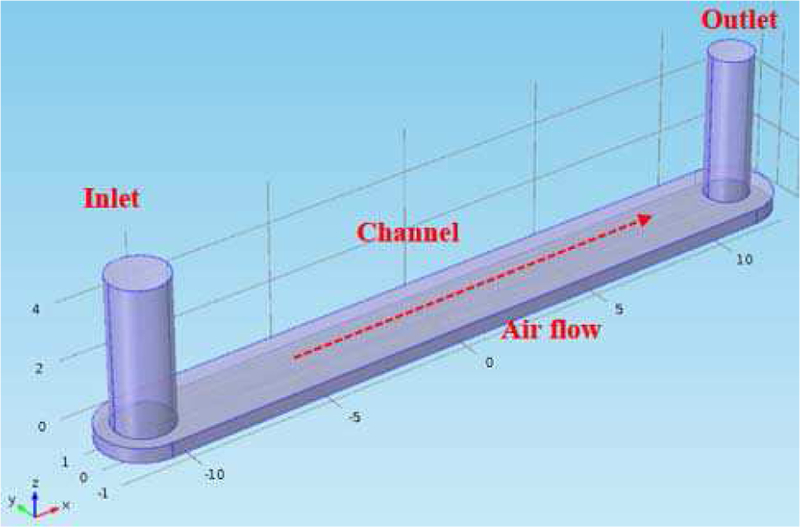
3D drawing of electrostatic particle collector in COMSOL Multiphysics 5.0.
To conduct the simulation, AC/DC physics module that assumes charge conservation was used to establish a time-invariant electrostatic field between the top and ground chamber planes. The ground and the top planes were set to 0 V and 400 V respectively.
Fig. 5. shows the simulated result of the electrostatic field inside the collection chamber. It can be seen that a homogeneous voltage gradient is formed inside the channel area.
Fig. 5.
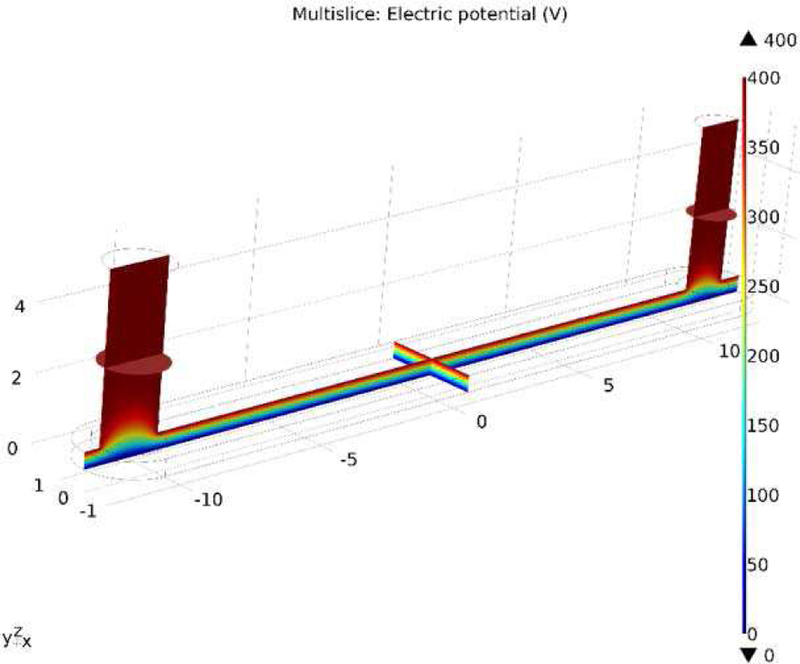
Simulated electrostatic field inside the particle collection chamber.
After establishing the electrostatic field, flow field created by active sampling was modeled using the fluid flow physics module. In order to determine the flow state inside the collection chamber, Reynold number was calculated:
| (1) |
where ρ is the density of air, υ is the characteristic velocity of the fluid with respect to the object, L is the characteristic linear dimension, and µ is the dynamic viscosity of fluid. To make a particle collector that is compact, with low power consumption, and efficient in particles collection, we optimized the Reynold number to be smaller than 20,000, which is within the Laminar flow regime assuming L = 0.025 mm, the linear flow rate less than 2 m/s, and volume flow rate less than 240 cm3/min. Hence, laminar flow model was chosen with turbulence model disabled, and simulations were run at linear flow rates from 0.05 m/s to 2 m/s. Incompressible flow was also assumed due to low backpressure of the collection chamber and no slip was assumed at the fluid-solid interface. For boundary conditions at the inlet, linear flow field speed was manually set while at the outlet, zero pressure is assumed, the flow is normal to the outlet plane, and backflow is suppressed due to linear laminar flow. Equations (2) and (3) below are the steady state incompressible Navier-Stokes and continuity equations respectively:
| (2) |
| (3) |
where ρ is the density of the fluid, u is the velocity field, μ is the dynamic viscosity of fluid, P is the pressure field, and F is the total external force. Fig. 6 below shows the simulated laminar flow with boundary layer established inside the collecting chamber.
Fig. 6.
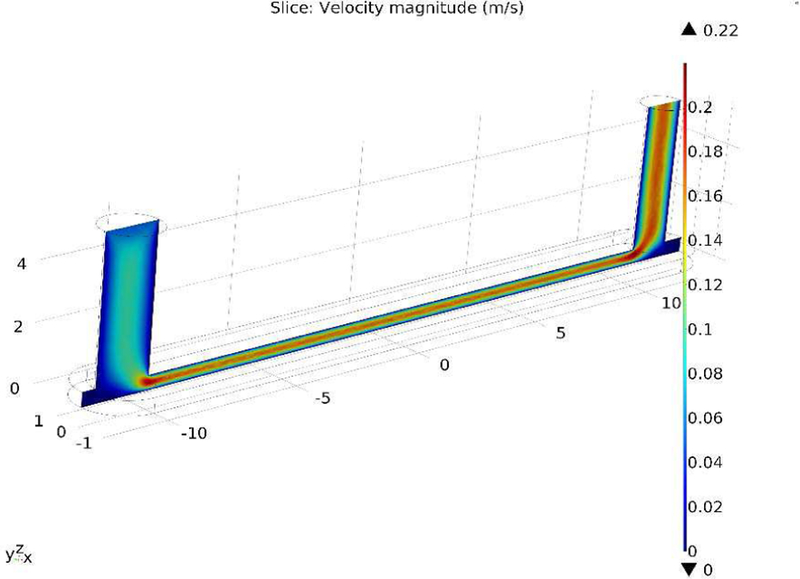
Simulated laminar flow field across the particle collector chamber.
Next, we simulated the particle collection process inside the established electrostatic and flow fields using the Particle Tracing for Fluid Flow module. The following assumptions were made in this simulation.
Particle stops on contact with the wall, i.e. speed reduces to zero instantaneously.
Particle density is assumed to be the same as average density of carbon based particles (0.8 g/cm3).
Brownian motion of particle is negligible compared to motion induced by the flow field.
Each particle carries one positive unit charge.
There is no particle-particle interaction as particles are sparse.
Stokes drag forces on particle are assumed due to low Reynold number.
The governing equations for this simulation are summarized below:
| (4) |
| (5) |
| (6) |
| (7) |
| (8) |
where m p is the mass of the particle, υ is the velocity vector of the particle, t is time, F is the total external force, u is the velocity field of the flow, Fd is the drag force, τ p is the drag force coefficient, ρ p is the particle density, d p is the particle diameter, µ is the dynamic viscosity, e is the value of unit charge, Z is the number of unit charges (which is 1 in this case), −∇V is the electric potential gradient, and Fe is the electrostatic force. Equation (4) represents Netwon’s second law, equation (5) shows that drag force is a vector which is proportional to the flow velocity vector minus the particle velocity vector. Equation (6) is the drag force coefficient, equation (7) is the calculation of electrostatic force, and equation (8) shows that the total external force on the particle is the vector sum of drag force and electrostatic force.
Simulation conditions of flow rate from 0.05 m/s to 2 m/s were used and particle diameters from 0.2 µm till 10 µm were used.
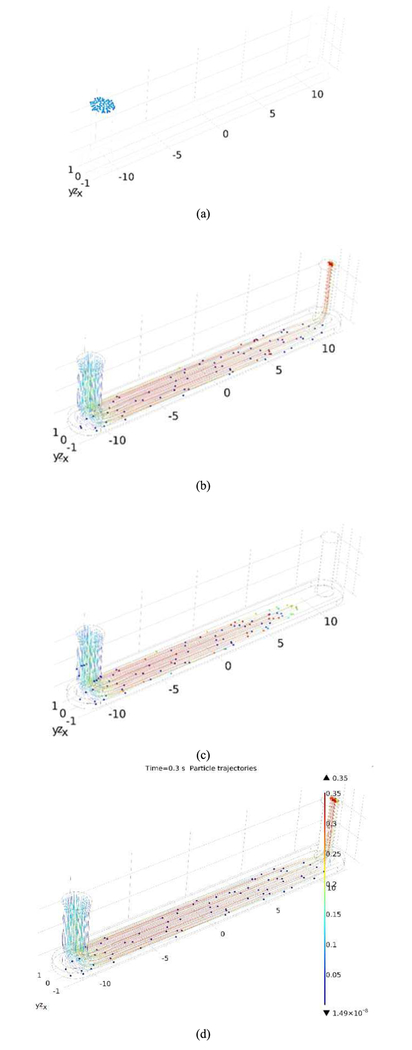
Fig. 7 shows the simulated particle trajectories at different time stamps and color map of particle velocity values. It can be seen that slower particles (blue) were collected on the ground plane while faster particles (red) escaped from the chamber via the outlet. Particle collection efficiency, which depends both on flow rate and particle size, were calculated as the ratio of number of particles collected divided by the number of particles injected (100 in this simulation). Table I below shows the values of collection efficiencies under different conditions.
Fig. 7.
Simulated particle trajectories at different times. (a) t=0s, (b) t=0.1s, (c) t=0.2s, (d) t=0.3s.
TABLE I.
COLLECTION EFFICIENCIES UNDER DIFFERENT CONDITIONS
| Flow Rate (cm3/min) |
8 | 16 | 32 | 120 | 240 | 640 |
|---|---|---|---|---|---|---|
| Particle Diameter (µm) | ||||||
| 0.2 | 1 | 0.75 | 0.36 | 0.1 | 0.07 | 0.01 |
| 0.5 | 0.61 | 0.29 | 0.18 | 0.07 | 0.02 | 0.02 |
| 2 | 0.29 | 0.2 | 0.11 | 0.04 | 0.01 | 0.11 |
| 2 | 0.22 | 0.14 | 0.09 | 0.24 | 0.3 | 0.85 |
| 4 | 0.17 | 0.11 | 0.29 | 0.67 | 0.85 | 1 |
| 5 | 0.14 | 0.12 | 0.44 | 0.9 | 0.92 | 1 |
| 10 | 0.46 | 0.77 | 0.93 | 1 | 1 | 1 |
There are two regions with higher than average collection efficiencies. First region is at lower flow rate and for smaller particles. This result is expected as the slower particles spend more time in the electrostatic chamber and the smaller inertia of the smaller particles makes them easier to move towards the electrode under the same electrostatic field. The second region is at higher flow rate and for larger particles. This result is also expected as the larger momentum of the larger and faster particles causes them to strike the collection surface much like how an impactor works.
After determining the optimal particle collector design and operation flow rate, acrylic was used to fabricate a particle collector. ITO coated PET from Sigma-Aldrich was used as the substrate due to its transparency and electrical conductivity. Epoxy glue was used to seal the machined acrylic housing and the substrate. Fig. 8 shows the fabricated particle collector.
Fig. 8.
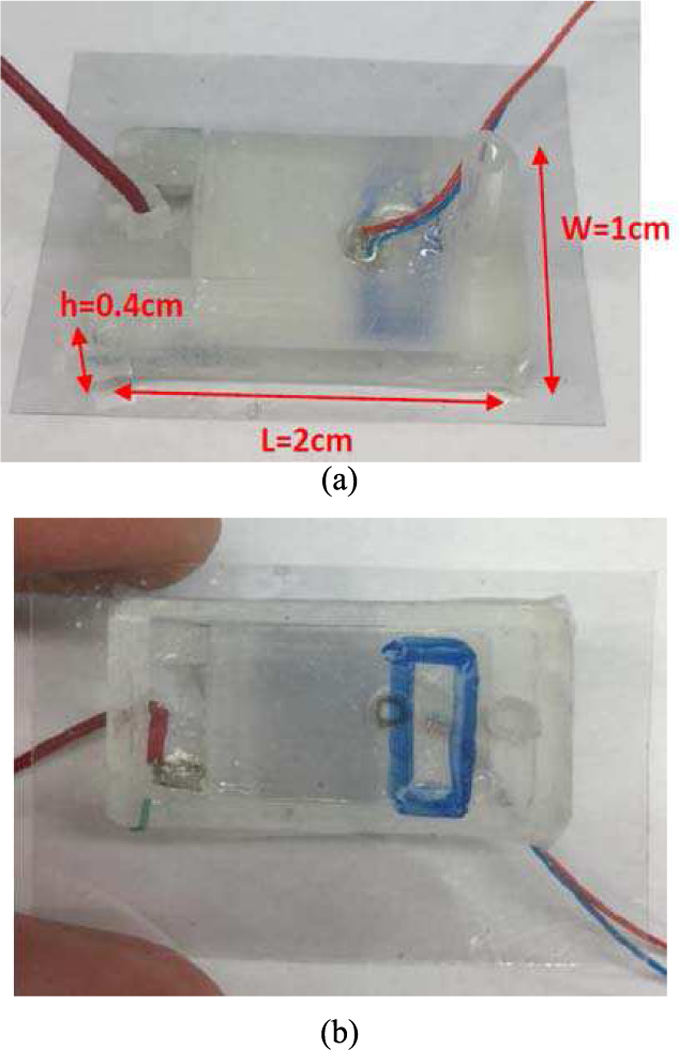
Fabricated particle collector. (a) top view, (b) bottom view.
B. Ambient Particulate Matter Collection using the Particle Collector with the CMOS Imaging Platform
The fabricated particle collector was then tested under ambient environments in two locations where particle concentrations are expected to be different. The first location was inside the Biodesign Institute Building at Arizona State University and the second location was outside the Biodesign Institute Building next to a construction site. Two tests were done at each site for 1 hour and the flow rate was fixed at 10 cm3/min. Images before and after the collection process were analyzed using ImageJ [31]. Collected number of particles and intensity of individual particles were extracted from the images. In order to convert particle intensity to its physical size, calibration curve shown in Fig. 3 was used. Fig. 9 below shows the particle intensity-diameter distribution for both the indoor and outdoor tests.
Fig. 9.
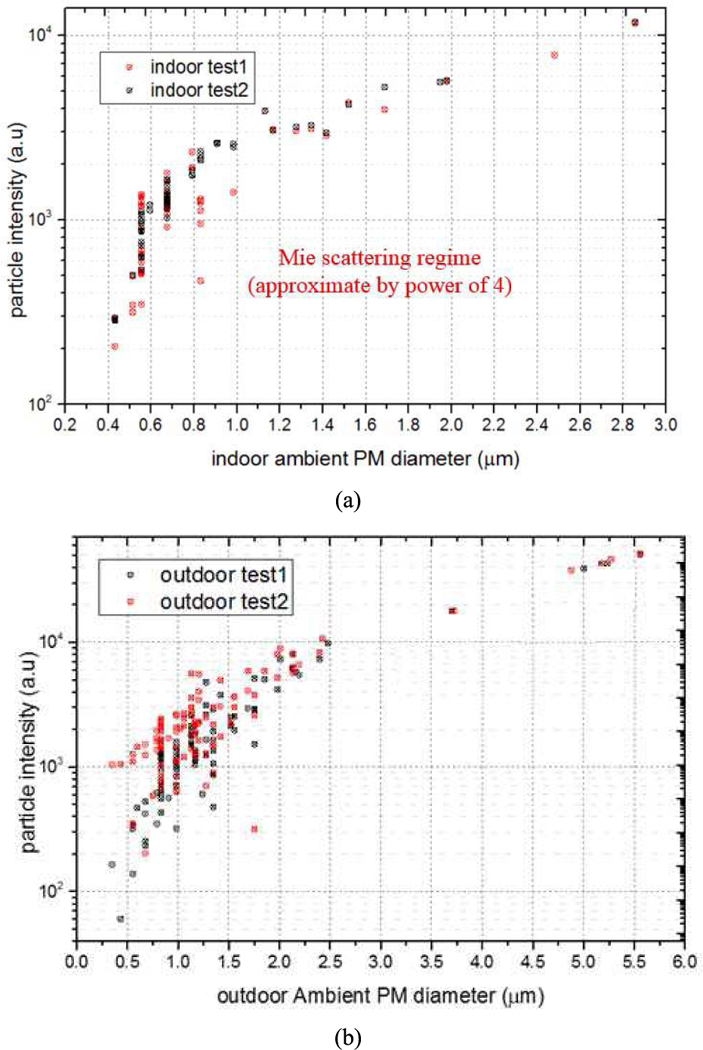
Particle intensity-diameter distribution from the ambient PM collection test. (a) two indoor tests, (b) two outdoor tests.
It can be observed from the figures that more and bigger (>5µm) particles were collected outdoor than indoor for the same collection duration. Outdoor PM are known to have more and bigger inorganic particles, for example SiO2 and metal particles, which are not as common indoor [1].
Based on the particle intensity-diameter distribution, number or density of particles in each particle diameter bin was obtained and plotted in Fig. 10. The resulting particle size distribution can be used to evaluate air quality and estimate particle composition given the profile.
Fig. 10.
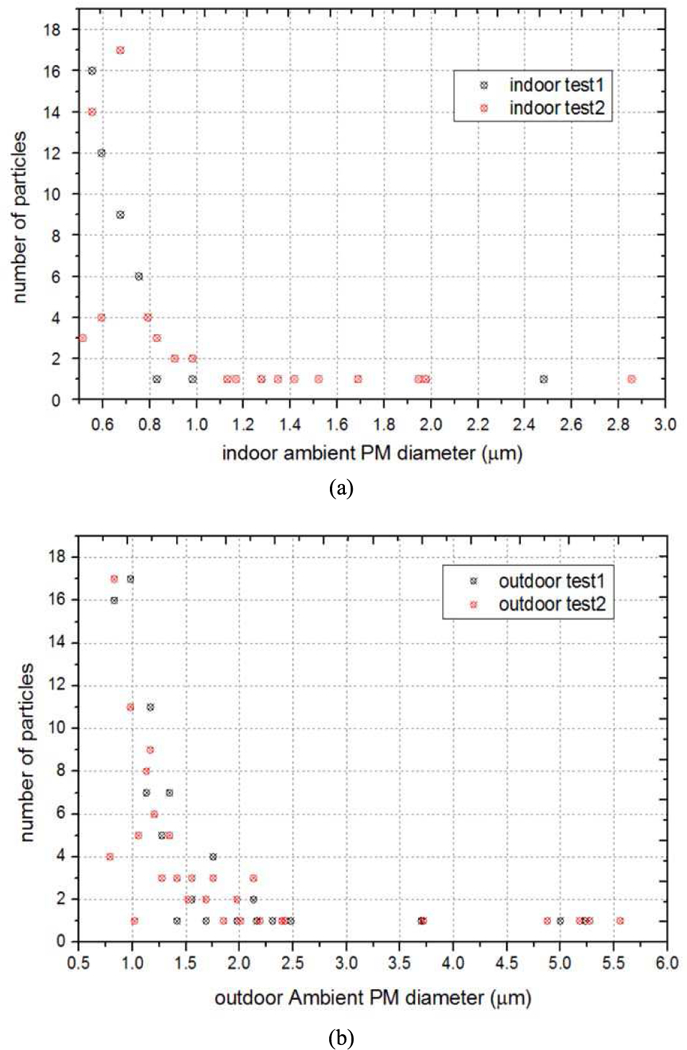
Indoor and outdoor PM size distribution. (a) two indoor tests, (b) two outdoor tests.
It can be observed that the most abundant particle size changed from 0.6 µm when the experiment was performed indoor to around 1 µm when performed outdoor. This set of experiments demonstrated the collection capability of the fabricated particle collector and the difference of PM size distribution profile between indoor and outdoor ambient PM. The electrostatic particulate collector is miniaturized, low cost and capable of collecting PM with a wide range of diameters. The collector features the use of a transparent and replaceable substrate, which makes it an ideal component of CMOS imaging based PM sensing platform.
C. Automated Image-based PM Sensing Algorithms
In order to develop a user-friendly PM sensing platform, we need a robust and real-time image based algorithm which can determine data such as particle number, intensity, diameter, and size distribution. A PM sensing algorithm was developed which processes captured particle images ofour PM sensor (e.g. Fig. 11a, a plot of the intensity component in the YCbCr representation of the image) pixel by pixel in a row, and then row by row until the image is completely scanned. The algorithm maintains an index variable which has the same dimension as the image and labels each pixel according to the particle it is associated with. If the current pixel intensity is lower than a preset intensity threshold, it will be labeled with index zero, otherwise it will be labeled with a positive integer starting from one (Fig. 11b). As the algorithm moves to the next pixel, if the new current pixel’s intensity is greater than the intensity threshold, two situations will be considered. If the distance between the new current pixel and the last pixel with a non-zero label is smaller or equal to a preset distance threshold (e.g. 2), this pixel will be considered as part of the same particle, and it will be labeled with the same integer as the last pixel. However, if the distance is greater than the distance threshold, it indicates that the pixel potentially belongs to a different particle, hence the label will be increased by one, and the pixel will be labeled by the incremented value.
Fig. 11.
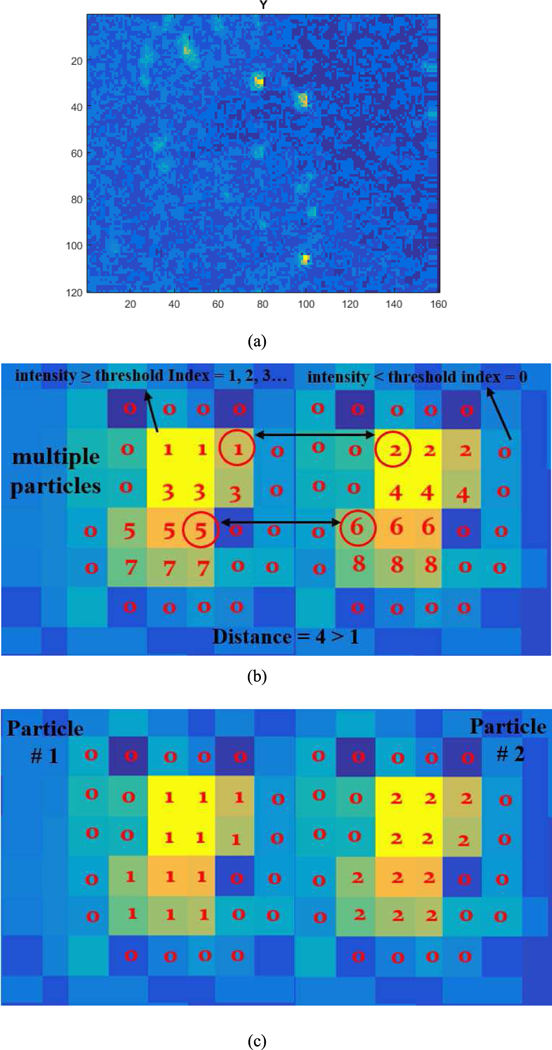
Schematic illustration of the PM sensing algorithm. (a) Matlab plot of PM image showing Y intensity channel. (b) Index matrix before index-updating. (c) Index matrix after index-updating showing two distinct particles.
At this point, pixels belonging to the same particle at different rows will have different labels and need to be updated to have the same label (Illustrated going from Fig. 11b to 11c). The algorithm picks the smallest non-zero label value among a 3-by-3 pixel mask centered by the current pixel being processed and updates the index’s label to the smallest value within the mask. This function guarantees that pixels belonging to the same particle (as evidenced by them adjacent to one another) will have the same label.
Finally, the number of particles is obtained by counting the number of different labels assigned to the pixels, which conveniently is the largest label value. The size of each particle is the pixel number of each distinct label value, while the intensity of each particle is the sum of pixel intensities of all pixels with the same distinct label value. A calibration curve similar to the one shown in Fig. 3 can be applied to the output of the algorithm to obtain size (µm) and size distribution plots.
In order to validate the algorithm, ambient particles were collected using a microblower and the particle collector. The CMOS imager used has a spatial resolution of 820×720, resulting in a detection limit of approximately 0.2 µm (Fig. 12). The algorithm was realized in Python and the plots were generated using Matplotlib package [32–34]. The code was run on a Raspberry Pi 3 [35, 36].
Fig. 12.

Scattered light PM image with resolution 820×720 used to test algorithm.
Finally, to check the accuracy of the algorithm, the manual processed results were compared to those reported by the algorithm. Particle number (233), size, and intensity were found to be the same. Size distribution was obtained after applying the calibration curve (Fig. 3) and normalized probability decreases exponentially with increasing particle size as expected (Fig. 13a and b). The algorithm demonstrated high accuracy, simplicity and low latency (∼5s per image). The automated PM sensing algorithm can be integrated into a portable sensor platform and PM reading can be obtained in real-time. Alternatively, real-time data could be updated to a remote database or synchronized with a mobile phone for further analysis to support personal use and epidemiological studies.
Fig. 13.
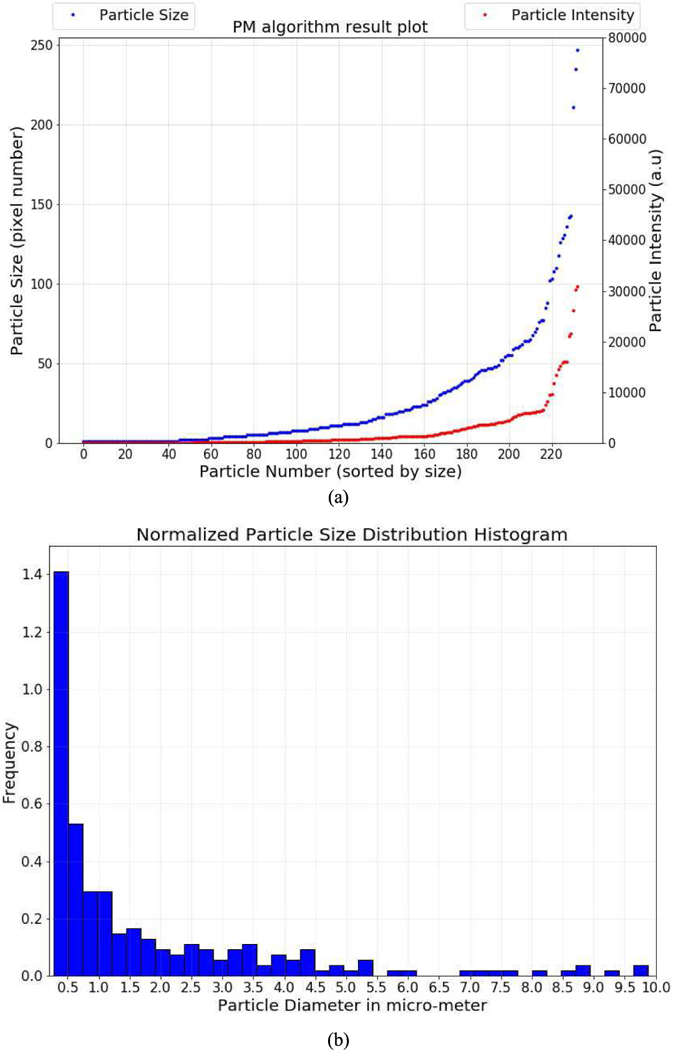
PM sensing algorithm result: (a) particle size and intensity distribution, (b) particle size distribution histogram after applying calibration curve.
IV. CONCLUSIONS
We have developed a PM detector that combines a CMOS imager, a particle collector, and an automated PM sensing algorithm. We have demonstrated that the imaging platform can detect particles as small as 0.2 µm with an image resolution of 820×720. We have performed validation field tests and compared the results with those obtained with a sophisticated reference technology. Our PM detector is low cost and has small form factor. The novel CMOS imaging method features low detection limit, high sensitivity and accuracy; while the particle collector is able to collect ambient PM in various sizes. Furthermore, the real time image processing algorithm can compute particle size, number and size distribution with low latency. Moreover the imaging capability of the PM sensor makes it possible to include other imaging based sensing technologies, such as colorimetric chemical sensors for real time multianalyte monitoring.
ACKNOWLEDGEMENT
Research reported in this paper was supported by NIH, center of NIBIB, under award number: #1U01EB021980–01.
Contributor Information
Zijian Du, School of Electrical, Computer and Energy Engineering, Arizona State University, Tempe, AZ 85287 USA..
Francis Tsow, Department of Electrical Engineering, Arizona State University, Tempe, AZ 85287 USA (tsing.tsow@asu.edu)..
Di Wang, The Biodesign Institute, Arizona State University, Tempe, AZ 85287 USA.
Nongjian Tao, The Biodesign Institute, Arizona State University, Tempe, AZ 85287 USA.
REFERENCES
- [1].Upadhyay Nabin, Clements Andrea, Fraser Matthew & Herckes Pierre, “Chemical Speciation of PM2.5 and PM10 in South Phoenix, AZ”, Journal of the Air & Waste Management Association, 61:3, 302–310. [DOI] [PubMed] [Google Scholar]
- [2].Delfino Ralph J., Staimer Norbert, Tjoa Thomas, Gillen Daniel L., Schauer James J. and Shafer Martin M., “Airway inflammation and oxidative potential of air pollutant particles in a pediatric asthma panel”, Journal of Exposure Science and Enviornmental Epidemiology, 23, 466–473, 2013. [DOI] [PMC free article] [PubMed] [Google Scholar]
- [3].Pope CA, “Cardiovascular Mortality and Long-Term Exposure to Particulate Air Pollution: Epidemiological Evidence of General Pathophysiological Pathways of Disease”. Circulation 109 (1): 71–77. [DOI] [PubMed] [Google Scholar]
- [4].Chen H, Goldberg MS, Villeneuve PJ, “A systematic review of the relation between long-term exposure to ambient air pollution and chronic diseases.” Reviews on environmental health 23 (4): 243–97. [DOI] [PubMed] [Google Scholar]
- [5].Franck Ulrich, Herbarth Olf, Stefan Röder Uwe Schlink, Borte Michael, Diez Ulrike,Ursula Krämer Irina Lehmann, “Respiratory effects of indoor particles in young children are size dependent”, Science of the Total Environment 409 (2011) 1621–1631 [DOI] [PubMed] [Google Scholar]
- [6].Marple Virgil A. and Liu Benjamin Y. H., “On fluid flow and aerosol impaction in inertial impactors.” Journal of colloid and interface science, Vol. 53, No. 1, October 1975. [Google Scholar]
- [7].Marple Virgil A. and Willeke Klaus, “Impactor Design”, Atmospheric Environment, Vol. 10, pp 891–896. [Google Scholar]
- [8].Cheng YS, Chen BT and Yeh HC, “behavior of isometric nonspherical aerosol particles in the aerodynamic particle sizer”, J Aerosol Sci, Vol 21 No 5, pp 701 710, 1990. [Google Scholar]
- [9].Wang Hwa-Chi & John Walter, “Particle Density Correction for the Aerodynamic Particle Sizer”, Aerosol Science and Technology, 06 June 2007.
- [10].Stein Stephen W., Gabrio Brian J. , Oberreit Derek , Hairston Peter , Myrdal Paul B. & Beck Tyler J., “An Evaluation of Mass-Weighted Size Distribution Measurements with the Model 3320 Aerodynamic Particle Sizer”, Aerosol Science and Technology, 30 November 2010.
- [11].Chien Chih-Hsiang, Theodore Alexandros, Chang-YuWu, Hsu Yu-Mei, Birky Brian, “Upon correlating diameters measured by optical particle counters and aerodynamic particle sizers”, Journal of Aerosol Science 101(2016)77–85. [Google Scholar]
- [12].Knutson EO and Whitby KT, “aerosol classification by electric mobility: apparatus, theory and applications”, Aerosol Science, 1975, Vol. 6, 443–451. [Google Scholar]
- [13].Kousaka Y, Okuyama K & Adachi M, “Determination of Particle Size Distributiuon of Ultra-fine Aerosols Using a Differential Mobility Analyzer”, Aerosol Science and Technology, 1985, 4:209–224. [Google Scholar]
- [14].Hering Susanne V., Stolzenburg Mark R. et al. , “A Laminar-Flow, Water-Based Condensation Particle Counter (WCPC)”, Aerosol Science and Technology, 39:659–672, 2005. [Google Scholar]
- [15].Liu Wei, Kaufman Stanley L. et al. , “Water-Based Condensation Particle Counters for Environmental Monitoring of Ultrafine Particles”, J. Air & Waste Manage. Assoc 56:444–455 [DOI] [PubMed] [Google Scholar]
- [16].Jeong Cheol-Heon & Evans Greg J., “Inter-Comparison of a Fast Mobility Particle Sizer and a Scanning Mobility Particle Sizer Incorporating an Ultrafine Water-Based Condensation Particle Counter”, Aerosol Science and Technology, 43:364–373, 2009. [Google Scholar]
- [17].http://www.amphenol-sensors.com/en/ko/products/co2/co2-modules/3222-telaire-smart-dust-sensor.
- [18].http://www.shinyei.co.jp/stc/eng/optical/main_dust.html.
- [19].Wang Y, Li J, Jing H, Zhang Q, Jiang J, & Biswas P, “Laboratory Evaluation and Calibration of Three Low-Cost Particle Sensors for Particulate Matter Measurement”, Aerosol Science and Technology, 49(11), 1063–1077, 2015. [Google Scholar]
- [20].Wong Hong-Sum, “Technology and Device Scaling Considerations for CMOS Imagers.”, IEEE Transactions on Electron Devices, Vol, 43, BO. 12, December 1996. [Google Scholar]
- [21].Noble P, “Self-Scanned silicon image detector arrays,” IEEE Transaction of Electron Devices Vol. ED-15, No. 4, April 1968. [Google Scholar]
- [22].Hynecek J, “BCMD-An improved photosite structure for high-density image sensors,” IEEE Transaction of Electron Devices Vol. 38, No. 5, May, 1991. [Google Scholar]
- [23].Ominivision, “OV20880–4C 20MP product brief.”, Version 1.2, September, 2017.
- [24].Wang Rui, Prabhakar Amlendu, Iglesias Rodrigo A., Xian Xiaojun, Shan Xiaonan, Tsow Francis, Forzani Erica S., and Tao Nongjian, “A Microfluidic-Colorimetric Sensor for Continuous Monitoring of Reactive Environmental Chemicals”, IEEE Sensors Journal, Vol. 12, No. 5, May 2012. [Google Scholar]
- [25].Gordan David J., “Mie Scattering by Optically Active Particles”, Biochemistry, Vol 11, No. 3, 1972. [DOI] [PubMed] [Google Scholar]
- [26].A Mizuno, “Electrostatic Precipitation”, IEEE Transaction on Dieletrics and Electrical Insulation, Vol. 7 No. 5, October 2000. [Google Scholar]
- [27].Leonard G, Mitchner M and Self SA, “Particle Transport in Electrostatic Precipitators.”, Atmospheric Environment, Vol. 14, 1289–1299. [Google Scholar]
- [28].Jaworek Anatol, Krupa Andrzej, Czech Tadeusz, “Modern electrostatic devices and methods for exhaust gas cleaning: A brief review.”, Journal of Electrostatics 65, 133–155, 2007. [Google Scholar]
- [29].Intra Panich, Yawootti Artit, Rattanadecho Phadungsak, “Numerical and experimental studies of collection efficiency of an ion electrostatic collector for a mini-volumn electrical PM detector.”, Journal of Electrostatics 72, 477–486, 2014. [Google Scholar]
- [30].Choi BS, J Fletcher CA, “Turbulent particle dispersion in an electrostatic precipitator.”, Applied Mathematical Modelling 22, 1009–1021, 1998. [Google Scholar]
- [31].Schindelin J; Rueden CT & Hiner MC et al. , “The ImageJ ecosystem: An open platform for biomedical image analysis”, Molecular Reproduction and Development, PMID 26153368, 2015. [DOI] [PMC free article] [PubMed]
- [32].van Rossum G, “Python tutorial, Technical Report CS-R9526”, Centrum voor Wiskunde en Informatica (CWI), Amsterdam, May 1995. [Google Scholar]
- [33].van der Walt Stéfan, Colbert S. Chris and Varoquaux Gaël. “The NumPy Array: A Structure for Efficient Numerical Computation”, Computing in Science & Engineering, 13, 22–30 (2011). [Google Scholar]
- [34].Hunter John D.. Matplotlib: “A 2D Graphics Environment , Computing in Science & Engineering”, 9, 90–95 (2007). [Google Scholar]
- [35].Kurkovsky Stan, Williams Chad, “ Raspberry Pi as a Platform for the Internet of Things Projects: Experiences and Lessons”, ITiCSE ‘17, July 3–5, 2017, Bologna, Italy. [Google Scholar]
- [36].Johnston Steven J and Cox Simon J, “The Raspberry Pi: A Technology Disrupter, and the Enabler of Dreams”, Electronics 2017, 6, 51. [Google Scholar]


