

Abstract
In vivo brain connectomics have heavily relied on using functional and diffusion Magnetic Resonance Imaging (MRI) modalities to examine functional and structural relationships between pairs of anatomical regions in the brain. However, research work on brain morphological (i.e., shape-to-shape) connections, which can be derived from T1-w and T2-w MR images, in both typical and atypical development or ageing is very scarce. Furthermore, the brain cannot be only regarded as a static shape, since it is a dynamic complex system that changes at functional, structural and morphological levels. Hence, examining the ‘connection’ between brain shape and its changes with time (e.g., growth) may help advance our understanding of connectomic brain dynamics as well as disorders that may affect it. To address these limitations, we unprecedentedly introduce two population-based shape and growth connectivity analysis tools that further extend the field of connectomics to brain morphology and dynamics: the morphome and the kinectome. Specifically, for a population of anatomically labelled shapes, the morphome identifies a network of anatomical shape regions that are connected when morphologically similar at a single timepoint, whereas the kinectome identifies anatomical shape regions that elicit similar evolution dynamics across successive timepoints. These proposed generic tools can be easily invested to examine how a baseline shape influences its deformation trajectory at later timepoints using any longitudinal shape data. We evaluated these tools on 23 infants, with right and left cortical surfaces reconstructed at birth, 3, 6, 9 and 12 months of age. Investigating the relationship between the neonatal morphome and the postnatal kinectome (from birth to 1 year of age) gave insights into brain connectivity at birth and how it develops over time.
Index Terms: Brain Connectivity, Growth and Shape, Morphome, Kinetcome, Cortex Morphology, Shape Similarity Networks
1. INTRODUCTION
Brain connectomics marked a new era for brain function (using task-based and resting state fMRI) and structure (using diffusion tensor imaging) analysis using big neuroimaging data, such as the Human Connectome Project [1], the Baby Connectome Project [2], and UK Biobank [3]. However, while providing tools for quantifying connections between different neuroanatomical structures, conventional connectomics tools are not particularly designed to investigate the morphology (or shape) of the brain and its dynamic changes with time (e.g., cortical growth and cortical atrophy). Specifically, ‘shape-to-shape’ connections, where we measure the morphological similarity between the brain structure shape and another brain structure shape, are rarely explored in the neuroscience state-of-the-art –with the exception of recent works introducing cortical morphological networks for brain disorder diagnosis [4, 5]. Previous works showed that brain morphology can be affected by different psychiatric disorders. For instance, hemispheric shape asymmetries appeared to be influenced by sexually dimorphic factors or by schizophrenia pathophysiology [6]. Furthermore, although complex and variable, the morphology of cortical gyri and sulci at birth predicted pathological functioning in certain developmental and neuropsychiatric disorders [7], thereby highlighting that brain morphology and function are intertwined. Moreover, different cortical attributes identified cortical shape-related alterations manifesting during a brain disorder progression such as temporal and parietal cortical thinning in both autistic children [8] and non-demented Down’s syndrome subjects [9].
On the other hand, since the brain is a highly complex dynamic system, it would be more comprehensive to model it as an evolving shape rather than a static one. Indeed, shape evolution modeling is one of the most growing research fields in computational anatomy [10] with diverse applications to studying changes in anatomical structures in age brain development [11] and ageing [12]. Brain morphological changes were also reported in brain disorders and diseases such as basal ganglia shape compression in boys with attention deficit hyperactivity disorder [13], and hippocampal atrophy and ventricular enlargement in Alzheimer’s disease [14]. However, to the best of our knowledge, no previous studies examined the ‘shape-to-shape’ and ‘growth-to-growth’ relationship in developing or ageing brains.
To address all these limitations, for the first time, we take the connectomics field one step further into examining shape-growth connections. To this aim, we propose two novel connectivity-based tools, the morphome, and the kinectome, that investigate shape-to-shape and growth-to-growth relationship with application to developing cortical surfaces using neonatal and postnatal structural T1-w and T2-w MR images. While the morphome, a population-based morphological connectivity atlas, pins down cortical regions that morphologically ‘wire’ together in the developing infant population, the kinectome, a population-based growth connectivity atlas, identifies cortical regions that develop similarly from birth timepoint. The main contributions of our work can be summarized as follows. First, we propose novel brain connectivity-based analysis tools that investigate both the morphology and dynamics of the brain as an interconnected complex system. Second, we evaluate these tools on developing cortical surfaces from birth till 1 year of age to reveal population-based shape and growth traits. Third, we investigate the relationship between the estimated morphome and kinectome in developing brains.
2. ESTIMATION OF SHAPE AND GROWTH BRAIN NETWORK ATLASES
In this section, we introduce our multi-step framework to estimate a shape network atlas and a growth network atlas for a population of longitudinal cortical brain networks (Fig. 1). In the first step, for each subject, we model the morphology of each cortical surface using the multidirectional varifold metric proposed in [15] as well as its developmental trajectory encoded by the estimated deformation velocity field from baseline to the last acquisition timepoint. In the second stage, we generate for each subject: (1) a shape brain network, where the strength of each connection between two cortical regions of interest (ROIs) represents the similarity in shape between these regions; and (2) a growth brain network, where the strength of each connection is defined as the correlation between the average developmental trajectories of two ROIs. In the third stage, we generate the morphome through integrating shape brain networks of neonates and the kinectome through averaging their corresponding growth brain networks. We detail each of these three stages below.
Fig. 1. Construction of shape and growth brain network atlases: the morphome and the kinectome.
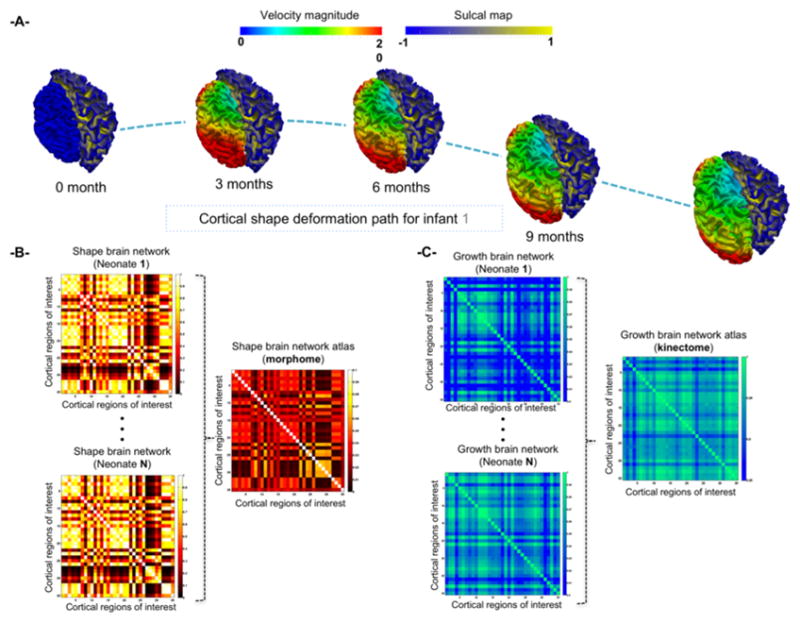
(A) Estimating the deformation of the left hemisphere using the varifold-based regression model from birth till 12 months of age (right hemisphere at 12-month kept static for comparison). (B) For each neonate, we generate a shape brain network that encodes similarity in shape between pairs of cortical regions using the multi-directional varifold metric [15], then we integrate all shape networks using non-linear similarity network fusion [16] into a shape network atlas or a morphome. (C) For each infant, we generate a growth brain network that quantifies the correlation between developmental trajectories (from birth to 1 year-old) of pairs of cortical regions using the multi-directional varifold regression model, then we average all growth networks into a growth network atlas or a kinectome.
Geodesic multidirectional varifold regression for shape and growth modeling
Given a set of shapes {S1, …, SNS} for Ns subjects, we nest each of these into a multidirectional varifold space W*, where each shape Sk (i.e., k–th subject in the population) is represented as a sum of two ‘orthogonal’ varifolds, one along its non-oriented normal vector n⃡ direction and the other along its non-oriented principal curvature direction κ⃡: Sk = ∫ ω(x)t n⃡ (x)dλ(x) + ∫ ω(x)t κ⃡ (x)dλ(x), where dλ(x) represents Lebesgue measure on the surface [17]. The square-integrable 3D vector field ω characterizes the geometry of the surface shape through local convolutions using a reproducing Hilbert kernel KW.
In a discrete space, a surface S with M meshes (triangles) is approximated by the sum of Dirac varifolds evaluated at the center positions xi of its M meshes using their corresponding non-oriented normal and principal curvature directions: . This elegant mathematical representation of a surface shape allows to capture the shape geometric details, which are larger than a fixed scale σW (standard deviation of the kernel KW). Representing a shape as a multi-directional varifold has several appealing properties. First, it captures complex shape patterns through exploring its local neighborhood in comparison to conventional cortical measures (e.g., cortical thickness) used in [4, 5]. Second, it allows to perform shape matching without the need to establish point-to-point correspondence between two shapes. Last, it embeds shapes into a vector space, where operations on shapes (e.g., addition, substraction) can be easily performed.
Since each shape is measured longitudinally at different timepoints t ∈ [0, T], we estimate its evolution trajectory through deforming the baseline multidirectional varifold onto a set of target multidirectional varifolds { } respectively observed at different timepoints. To do so, we model this longitudinal shape deformation from baseline as a minimization problem [17]: , where γ represents a trade-off between the deformation smoothness energy and the similarity between ground-truth and deformed shapes. ϕ(x, t), t ∈ [0, 1] represents a smooth invertible deformation (i.e., diffeomorphism), fully defined by a set of Nz control points zi and their attached initial deformation momenta αi. vt denotes the estimated smooth shape deformation velocity field, which belongs to a reproducing kernel Hilbert space V, spanned by Gaussian kernel KV with standard deviation σV, and is defined at a location x and timepoint t as: .
Shape and growth brain networks estimation for each subject
To compare two cortical ROIs Ri and Rj in morphology, we compute the multidirectional varifold distance between them: dW*(Ri, Rj) = ||Ri − Rj||W*, where Mi is the number of meshes for Ri and accordingly Mj for Rj. Through computing multidirectional varifold similarity between pairs of ROIs, we generate the shape brain network (Fig. 1–B). To build the growth brain network that captures the relationship between cortical ROI-based developmental trajectories over a specific time-window t ∈ [0, T], we first compute the mean spatiotemporal velocity ṽ(x, t), t ∈ [0, T] over all vertices in each cortical region of interest. Next, to quantify the similarity in growth patterns between two cortical ROIs, we compute Pearson correlation coefficient between the mean spatiotemporal velocity signals of both ROIs.
The morphome and the kinectome
To generate the morphome for a set of individuals, we integrate their shape brain networks using the recently developed nonlinear similarity network fusion (SNF) method by [16]. Since SNF well captures shared traits between networks and is also robust to noise and data heterogeneity [16]. On the other hand, to generate the kinectome, we simply average the growth brain networks of different individuals in the population. Note that for merging growth networks we did not use the non-linear fusion method which inherently computes the correlation between subjects since growth networks are computed using Pearson correlation. To further identify strong ‘morphological’ connections between ROIs at a fixed common timepoint, we sparsify the morphome at Ps%. Hence, the morphome is transformed into a weighted sparse network. Analogously, by sparsifying the kinectome at Ps%, we highlight strong positive kinetic correlations between different ROIs. This identifies anatomical regions that dynamically develop similarly. Notably, unlike the morphome, which captures shape characteristics at a fixed timepoint, the kinectome is estimated based on shape evolution trajectories across successive observation timepoints. Hence, the kinectome encodes dynamic shape information.
Investigating shape-growth connectional relationship
To explore the relationship between shape and growth trends in a specific population of Ns individuals, we first compute Pearson correlation between Ns growth and shape networks, then identify statistically significant differences using paired t-test.
3. EXPERIMENTS AND DISCUSSION
Dataset and Parameter Setting
We evaluated our proposed shape and growth connectomic tools on Ns = 23 infants, each with longitudinal reconstructed left and right cortical surfaces at around birth, 3, 6, 9 and 12 months of age. Each cortical surface was parcellated into 35 cortical regions. For multidirectional varifold surface representation, we set σW = 5 for the shape kernel KW, σV = 25 for the deformation kernel KV, and γ = 0.001 for the energy JW* [15]. To estimate sparse morphome and kinectome, we set the sparsification threshold to Ps = 15% as suggested in the field of connectomics [18].
Insights into connectomic brain development
To analyze both estimated neonatal morphome and postnatal kinectome, we sparsified both network atlases at 15%. The outputted sparse connectivity matrices are displayed in Fig. 2 for both left and right hemispheres. While the morphome pinpoints pairwise cortical connections between ROIs with strongly similar morphology (Fig. 2–A and C), the kinectome identifies connections between ROIs with strongly correlated kinetic evolution patterns (Fig. 2–B and D). Further, for each cortical region in the right hemisphere, we summed its corresponding row and column values in the morphome matrix, thereby revealing in both hemispheres hubs or highly connected nodes of cortical regions that densely ‘wired’ to morphologically most similar cortical regions such as the inferior parietal cortex, postcentral gyrus, precentral gyrus, rostral middle frontal gyrus, superior frontal gyrus and superior parietal cortex. The left morphome additionnally included the lateral occipital cortex. Most of these were located in the back of the frontal lobe such as the precentral gyrus and the parietal lobe such as the inferior and superior parietal cortices. Interestingly, it was reported in [19] that the structural regional co-variance within the frontal-parietal network is particularly strongly determined by genetic factors. This may explain the dense morphological ‘wiring’ of these hubs that ‘influence’ the morphology of different cortical regions.
Fig. 2. The estimated neonatal morphome and postnatal kinectome sparsified at 15% for both left and right hemispheres.

Each node in the circular graph denotes a cortical region. Region names are included in Fig. 3.
Similarly, for both left and right kinectomes, we identified cortical regions with more kinetic connections with other cortical regions that elicit similar developmental trajectories, such as the entorhinal cortex, lateral occipital cortex, lateral orbitofrontal cortex and pars orbitalis. Additionally, the right kinectome also included the lingual gyrus, superior temporal gyrus and insula cortex, which indicates that more cortical regions in the right kinectome develop more similarly. The present data support heterochronic development in human cerebral cortex where the speed of growth varies with time across different regions as shown in Fig. 1–A and demonstrated using the growth brain network. The disparity in the identified cortical regions between the left and the right kinectomes (Fig. 2) may be attributed to developmental asynchronies of two hemispheres. Indeed, the left hemisphere matures more slowly than the right hemisphere [20]. This can also be interpreted in the light of the dynamics of signaling from one developing tissue to another or receiving the simultaneous signaling from multiple cortical regions, which can also explain the synchronized maturation of different cortical regions (i.e., their developmental trajectories are highly correlated) [19]. Unlike the morphome, which involved regions in primarily the frontal lobe and was quite consistent between hemispheres, the kinectome exhibited sparser connections linking regions in different lobes, which largely differed between both hemispheres.
Insights into neonatal shape and postnatal growth relationship
Fig. 3 plots Pearson correlation coefficient between shape and growth networks in 35 cortical regions. For both left and right hemispheres, ~ 20% of the cortical regions had a statistically significant high correlation between their shape and growth networks in our cohort (r > 0.4, p ≪ 0.001). These included bilateral superior temporal sulcus, caudal middle frontal gyrus, fusiform gyrus, inferior parietal cortex, inferior temporal gyrus and isthmus cingulate cortex, along with the right anterior cingulate cortex –mainly belonging to the temporal, frontal and limbic lobes. This might indicate that similar cortical regions develop similar growth trends during the first year of postnatal development. Clearly, both cortical hemispheric developments are marked by correlated and anti-correlated shape-velocity behaviors largely consistent across cortical regions, where distinctive cortical areas exhibited highly significant correlation values.
Fig. 3. Exploring the relationship between shape and growth brain networks.

We compute Pearson correlation coefficient between shape and growth networks in 35 cortical regions in our cohort. * denotes p < 0.05 and ** denotes p ≪ 0.001.
We would like to point out that although our analysis identified similar cortical regions that displayed coherent similar growth across subjects, these need to be validated in larger neonatal longitudinal datasets, which highlights the need to amass more MRI infant data. Moreover, our findings motivate new theories with regard to neonatal shape-growth characteristics and compel researcher to further explore our observations in large neonate and infant neurodevelopmental datasets with a denser distribution of acquisition timepoints. The model presented here is a highly promising starting point, given that it can be generalized to different complex shapes and allows to examine the spatiotemporal dynamics of shapes as well as quantifying their high-dimensional (here 3D) morphology. Besides, it will be more intriguing to interpret our findings in the light of multiple covariates such as stress during development [21], and also cortical genomic networks since brain shapes are heritable [22].
4. CONCLUSION
We proposed novel connectomic tools to examine shape and growth brain connectivity using longitudinal MRI T1-w/T2-w sequence. We applied our tools to developing cortical surfaces from birth till 12 months of age, which gave us compelling insights into cortical shape, growth, and their relationship. Our tools are generic and can be utilized to examine any anatomical shape development (e.g., hippocampus atrophy in dementia). The proposed morphome and kinectome can be easily aggregated with functional and structural connectivity networks to get a more comprehensive understanding of brain development as well as to detect, model and classify anatomical shape abnormalities in future works.
Acknowledgments
This work is funded by: MH100217, MH108914, MH107815, MH110274
References
- 1.Glasser MF, Coalson TS, Robinson EC, Hacker CD, et al. A multi-modal parcellation of human cerebral cortex. Nature. 2016;536:171–178. doi: 10.1038/nature18933. [DOI] [PMC free article] [PubMed] [Google Scholar]
- 2.Fallik D. The human connectome project turns to mapping brain development, from birth through early childhood. Neurology Today. 2016;16(19):7–9. [Google Scholar]
- 3.Miller KL, Alfaro-Almagro F, Bangerter NK, Thomas DL, et al. Multimodal population brain imaging in the UK Biobank prospective epidemiological study. Nature Neuroscience. 2016;19:1523–1536. doi: 10.1038/nn.4393. [DOI] [PMC free article] [PubMed] [Google Scholar]
- 4.Lisowska A, Rekik I for ADNI. Pairing-based ensemble classifier learning using convolutional brain multiplexes and multi-view brain networks for early dementia diagnosis. MICCAI-Connectomics in Neuroimaging. 2017:42–50. [Google Scholar]
- 5.Soussia M, Rekik I. High-order connectomic manifold learning for autistic brain state identification. MICCAI-Connectomics in Neuroimaging. 2017:51–59. [Google Scholar]
- 6.Narr KL, Bilder RM, Luders E, Thompson PM, Woods RP, Robinson D, Szeszko PR, Dimtcheva T, Gurbani M, Toga AW. Asymmetries of cortical shape: effects of handedness, sex and schizophrenia. Neuroimage. 2007;34(3):939–948. doi: 10.1016/j.neuroimage.2006.08.052. [DOI] [PMC free article] [PubMed] [Google Scholar]
- 7.Dubois J, Benders M, Borradori-Tolsa C, Cachia A, Lazeyras F, Ha-Vinh Leuchter R, Sizonenko S, Warfield S, Mangin J, Huppi P. Primary cortical folding in the human newborn: an early marker of later functional development. Brain. 2008;131(Pt 8):2028–2041. doi: 10.1093/brain/awn137. [DOI] [PMC free article] [PubMed] [Google Scholar]
- 8.Wallace G, Dankner N, Kenworthy L, Giedd J, Martin A. Age-related temporal and parietal cortical thinning in autism spectrum disorders. Brain. 2010;133(Pt 12):3745–3754. doi: 10.1093/brain/awq279. [DOI] [PMC free article] [PubMed] [Google Scholar]
- 9.Romano A, Cornia R, Moraschi M, Bozzao A, Chiacchiararelli L, Coppola V, Iani C, Stella G, Albertini G, Pierallini A. Age-related cortical thickness reduction in non-demented down’s syndrome subjects. J Neuroimaging. 2015;26(1):95–102. doi: 10.1111/jon.12259. [DOI] [PubMed] [Google Scholar]
- 10.Miller MI. Computational anatomy: shape, growth, and atrophy comparison via diffeomorphisms. NeuroImage. 2004;23:S19–S33. doi: 10.1016/j.neuroimage.2004.07.021. [DOI] [PubMed] [Google Scholar]
- 11.Li G, Nie J, Wang L, Shi F, Gilmore J, Lin W, Shen D. Measuring the dynamic longitudinal cortex development in infants by reconstruction of temporally consistent cortical surfaces. Neuroimage. 2014;90:266–279. doi: 10.1016/j.neuroimage.2013.12.038. [DOI] [PMC free article] [PubMed] [Google Scholar]
- 12.Lemaitre H, Goldman A, Sambataro F, Verchinski B, Meyer-Lindenberg A, Weinberger D, Mattay V. Normal age-related brain morphometric changes: nonuniformity across cortical thickness, surface area and gray matter volume? Neurobiol Aging. 2012;33(3):617.e1–617.e9. doi: 10.1016/j.neurobiolaging.2010.07.013. [DOI] [PMC free article] [PubMed] [Google Scholar]
- 13.Qiu A, Crocetti D, Adler M, Mahone EM, Denckla MB, Miller MI, Mostofsky SH. Basal ganglia volume and shape in children with attention deficit hyperactivity disorder. American Journal of Psychiatry. 2009;166(1):74–82. doi: 10.1176/appi.ajp.2008.08030426. [DOI] [PMC free article] [PubMed] [Google Scholar]
- 14.Apostolova L, Green A, Babakchanian S, Hwang K, Chou Y, Toga A, Thompson P. Hippocampal atrophy and ventricular enlargement in normal aging, mild cognitive impairment (MCI), and alzheimer disease. Alzheimer Dis Assoc Disord. 2012;26(1):17–27. doi: 10.1097/WAD.0b013e3182163b62. [DOI] [PMC free article] [PubMed] [Google Scholar]
- 15.Rekik I, Li G, Lin W, Shen D. Multidirectional and topography-based dynamic-scale varifold representations with application to matching developing cortical surfaces. Neuroimage. 2016;135:152–162. doi: 10.1016/j.neuroimage.2016.04.037. [DOI] [PMC free article] [PubMed] [Google Scholar]
- 16.Wang B, Mezlini A, Demir F, Fiume M, Tu Z, Brudno M, Haibe-Kains B, Goldenberg A. Similarity network fusion for aggregating data types on a genomic scale. Nat Methods. 2014;11(3):333–337. doi: 10.1038/nmeth.2810. [DOI] [PubMed] [Google Scholar]
- 17.Rekik I, Li G, Lin W, Shen D. Predicting infant cortical surface development using a 4D varifold-based learning framework and local topography-based shape morphing. Med Image Anal. 2015;28:1–12. doi: 10.1016/j.media.2015.10.007. [DOI] [PMC free article] [PubMed] [Google Scholar]
- 18.Bullmore E, Sporns O. The economy of brain network organization. Nat Rev Neurosci. 2012;13(5):336–349. doi: 10.1038/nrn3214. [DOI] [PubMed] [Google Scholar]
- 19.Hanson J, Chung M, Avants B, Rudolph K, Shirtcliff E, Gee J, Davidson R, Pollak S. Structural variations in prefrontal cortex mediate the relationship between early childhood stress and spatial working memory. J Neurosci. 2012;32(23):7917–7925. doi: 10.1523/JNEUROSCI.0307-12.2012. [DOI] [PMC free article] [PubMed] [Google Scholar]
- 20.Roshchupkin GV, Gutman BA, Vernooij MW, Jahanshad N, Martin NG, Hofman A, McMahon KL, et al. Heritability of the shape of subcortical brain structures in the general population. Nature communications. 2016;7 doi: 10.1038/ncomms13738. [DOI] [PMC free article] [PubMed] [Google Scholar]