

Abstract
Experimental detection of RNA splicing branchpoints is difficult. To date, high-confidence experimental annotations exist for 18% of 3′ splice sites in the human genome. We develop a deep-learning-based branchpoint predictor, LaBranchoR, which predicts a correct branchpoint for at least 75% of 3′ splice sites genome-wide. Detailed analysis of cases in which our predicted branchpoint deviates from experimental data suggests a correct branchpoint is predicted in over 90% of cases. We use our predicted branchpoints to identify a novel sequence element upstream of branchpoints consistent with extended U2 snRNA base-pairing, show an association between weak branchpoints and alternative splicing, and explore the effects of genetic variants on branchpoints. We provide genome-wide branchpoint annotations and in silico mutagenesis scores at http://bejerano.stanford.edu/labranchor.
Keywords: RNA splicing, RNA splicing branchpoints, alternative splicing, deep learning
INTRODUCTION
Following transcription, which produces RNA molecules identical to the DNA sequence, vast stretches of RNA, called introns, are “spliced out” leaving a string of “exons,” which comprise the final messenger RNA. Splicing involves three mechanistically essential sites: the 5′ and 3′ splice sites (5′SS and 3′SS), which define the up and downstream end of an intron, respectively, and a branchpoint, which serves as the nucleophile in the first catalytic step of splicing (Fig. 1A) and is generally located 18–45 nt upstream of the 3′SS (Fig. 1G; Mercer et al. 2015). The branchpoint is recognized by base-pairing of the surrounding nucleotides to U2 snRNA and selection on the branchpoint nucleotide itself by an interaction with SF1 (Pascolo and Séraphin 1997; Peled-Zehavi et al. 2001). Overall 3′SS recognition is facilitated by a combination of this selection on the branchpoint, U2AF65 binding the polypyrimidine tract (PPT), and U2AF35 recognizing the core 3′SS signal (Fig. 1A), along with a diverse cast of supporting factors (Berglund et al. 1998; Hoskins and Moore 2012).
FIGURE 1.

Overview of branchpoints and their genome-wide prediction using LaBranchoR. (A) Branchpoints play a key role in 3′SS recognition and are essential to the mechanism of splicing. (B) RNA sequencing reads that span a 5′SS-branchpoint junction implicate branchpoints. The first part of these reads (yellow) align upstream of a branchpoint and the second part of these reads (red) align downstream from a 5′SS. In this way, the downstream end of the first part of the read marks the branchpoint. (C) Cartoon of information flow in a bidirectional LSTM. The RNA sequence upstream of a 3′SS is input to the model, and a predicted probability of being a branchpoint is outputted for each nucleotide. (D) Model performance on held-out test sets in comparison with two existing methods. Model performance is defined as the fraction of 3′SSs where the highest scoring position overlaps with an experimentally determined branchpoint. Each cluster of bars indicates the performance on a different test set: “High Conf” refers to Mercer et al. (2015) high confidence sites, “Low Conf” refers to the complete set of Mercer et al. (2015) sites, “Taggart” refers to the Taggart et al. (2017) predictions. The “<5” test sets count the highest scoring position as overlapping with an experimental branchpoint if there is an experimental branchpoint <5 nt from it. (*) Significant difference with P < 1 × 10⁻¹⁴ by a two-sided Fisher exact test. Local sequence context (E), PhyloP conservation as a function of position relative to a branchpoint averaged across all branchpoints (F), and position relative to 3′SS (G) for predicted and experimentally determined branchpoints.
The locations of the 5′ and 3′SSs can be easily recovered from RNA sequencing (RNA-seq) reads spanning between exons. Similarly, RNA-seq reads spanning 5′SS–branchpoint junctions can in principle provide the positions of branchpoints (Fig. 1B; Taggart et al. 2012). However, the branched intron by-product is quickly degraded making these reads exceptionally rare. In fact, a study analyzing a massive collection of internally generated and ENCODE RNA-seq data provided annotations for 16% of known introns (Taggart et al. 2017), and even when specialized sequencing methods were employed, coverage increased to only 18% of branchpoints (Mercer et al. 2015). Furthermore, reads that are generated from 5′SS–branchpoint junctions sometimes provide imprecise information about branchpoint location due to errors in reverse transcription caused by the unusual 2′-OH linkage present (Taggart et al. 2017). Together, these factors have caused the characterization of branchpoints to lag far behind that of 5′ and 3′ SSs.
The lack of branchpoint annotations has slowed our understanding of the basis of 3′SS selection and makes it difficult to diagnose diseases caused by mutations to branchpoint sequences and the trans-acting factors that recognize them. However, even with our limited knowledge, it has been shown that branchpoints play a role in Mendelian disease (Mercer et al. 2015; Signal et al. 2018), as well as more complex diseases, such as SF3b-associated cancers (Alsafadi et al. 2016), and it has been reported that expression levels of SF1 play a vital role in aging (Heintz et al. 2017).
In response to the limited experimental branchpoint annotations and the importance of knowing branchpoints for understanding the basis of 3′SS selection and branchpoint-related diseases, we developed a computational method to predict branchpoints, LaBranchoR (Long short-term memory network Branchpoint Retriever). Specifically, we focus on the problem of predicting the most likely branchpoint given the associated 3′SS, which we took to be the most salient task given the widespread availability of 3′SS positions. LaBranchoR is based on a bidirectional long short-term memory network (LSTM), a “deep learning” algorithm shown to be wildly successful in modeling sequential data such as time-series and natural language (Hochreiter and Schmidhuber 1997; Lipton et al. 2015). The use of an LSTM allowed us to build a model based on solely the RNA sequence, free from the biases of hand-engineered features.
Throughout our study, we compare LaBranchoR to two recently proposed computational methods, which focus on two distinct tasks: a machine learning approach for branchpoint prediction, branchpointer (Signal et al. 2018), and a method to remove noise in the experimental data proposed by Taggart et al. (2017). Branchpointer employs an ensemble of support vector machines and gradient boosting tree classifiers, which take as input a library of engineered features. Branchpointer is trained on the same set of experimental branchpoints as our model: the “high confidence” set of branchpoints reported by Mercer et al. (2015). Taggart et al. (2017) explicitly modeled U2 snRNA base-pairing potential, ignoring the branchpoint position itself, and the likelihood of observing a given nucleotide skipping distance to resolve noise introduced by nucleotide skipping. They used this model to produce maximum likelihood branchpoint predictions for an expanded set of RNA-seq data including a diverse range of cell lines.
In this study, we show that LaBranchoR has strong predictive performance, exceeding that of previous methods. By learning genome-wide patterns, LaBranchoR makes robust predictions that appear to often be more accurate than the raw data itself. After showing the accuracy of our predictions, we use them to evaluate genome-wide properties of branchpoints and find that we recover known trends, as well as several novel insights. We conclude that branchpoint strength plays a role, similar to that of 3′SS strength, in alternative splicing. We identify a novel upstream recognition element, which is consistent with recent cryo-EM models of the spliceosome depicting the relevant bases in duplex with U2 snRNA (Galej et al. 2016; Bertram et al. 2017). Finally, we show that LaBranchoR predictions overlap with more pathogenic variants than previous computational predictions, as well as the raw data itself.
RESULTS
We used a bidirectional LSTM network to learn a mapping between RNA sequence and branchpoint locations (Fig. 1C). The RNA sequence 1–70 bp upstream of each 3′SS served as the sole input to our model. We trained our model on the high confidence set of branchpoints annotated by Mercer et al. (2015). We reserved the 7570 branchpoints across 4306 3′SSs on chromosome 1 for testing, the 10,187 branchpoints across 7093 3′SSs on chromosomes 2, 3, 4 for model selection. The remaining 39,051 branchpoints across 27,711 3′SSs were used for model training. We then used our trained model to predict branchpoints for the remaining 169,182 annotated 3′SSs. While our model predicts branchpoint probabilities for all 70 bp upstream of each 3′SS, we chose to focus our analysis on a single predicted branchpoint per 3′SS, corresponding to the highest of the predictions.
LaBranchoR provides accurate genome-wide branchpoint annotations
Our model's predictions generally agree with branchpoints implicated by both Mercer et al. (2015) and Taggart et al. (2017). On a test set held out from model training and parameter tuning, we found that our predicted branchpoint coincided with a high confidence Mercer site for 75% of 3′SSs (Fig. 1D). Expanding this analysis to consider Mercer low confidence sites and cases where our prediction lies within 4 nt of a Mercer site yields an accuracy of 84% and 91%, respectively. Restricting to Mercer sites with an A at the branchpoint yields an overlap of 87%, and further requiring a U at the −2 position yields an overlap of 93%. Briefly dropping our strategy of predicting one branchpoint per 3′SS and instead predicting all nucleotides above a given probability threshold to be branchpoints, we find that at false discovery rates of 10 and 50% LaBranchoR achieves recalls of 35% and 72% for all branchpoints, 46% and 92% for only A branchpoints, and 62% and 98% for A branchpoints with a U at the −2 position, respectively. Our predictions have a lower agreement with the Taggart set, where we find that our prediction overlaps an annotated site for only 56% of 3′SSs and that 80% of the time our prediction lies within 4 nt of an annotated site. Notably, restricting to Taggart sites with an A at the branchpoint yields a higher overlap of 71% and 84%, respectively (Supplemental Fig. S1A).
Our performance represents a 28 percentage point improvement over the most commonly used branchpoint prediction method, SVM-BPFinder (Corvelo et al. 2010), and a 7–15 percentage point improvement over the current state-of-the-art method, branchpointer (Fig. 1D; Signal et al. 2018). Comparing to branchpointer on our test set yielded an 8 percentage point advantage, and even when only considering branchpoints in positions −18 to −45 from the 3′SS, where branchpointer makes predictions, we maintain a 7 percentage point increase in performance (Supplemental Fig. S1B). However, this evaluation of their performance is overly optimistic, as branchpointer had seen roughly 80% of the data from our test set in its training. On the intersection of our test sets, LaBranchoR outperforms branchpointer by a 12 and 15 percentage point margin for the −18 to −45 and −5 to −60 ranges, respectively (Supplemental Fig. S1C,D). Area under receiver-operator curve and precision-recall curve statistics for all mentioned evaluations are in Supplemental Table S1.
We found that the bulk trends in sequence motifs, positional distribution, and conservation signatures are similar, but display a few key differences between our predicted, Mercer, and Taggart branchpoints (Fig. 1E–G). Our predictions and the Taggart set have a similar sequence motif, which closely matches the motif expected for base-pairing with U2 snRNA (Wu and Manley 1991), with stronger nucleotide content biases than the Mercer set (Fig. 1E). However, our predictions show a higher rate of A branchpoint nucleotides. While this could represent a “modal collapse” of our model, a strong bias to an A at the branchpoint is supported by a study of positional k-mer enrichment (Lim et al. 2011). Additionally, the branchpoint nucleotide was not considered in the Taggart et al. (2017) denoising strategy, so there could exist cases where a slightly stronger U2 base-pairing sequence without an A was incorrectly selected over a different position with an A nucleotide at the branchpoint.
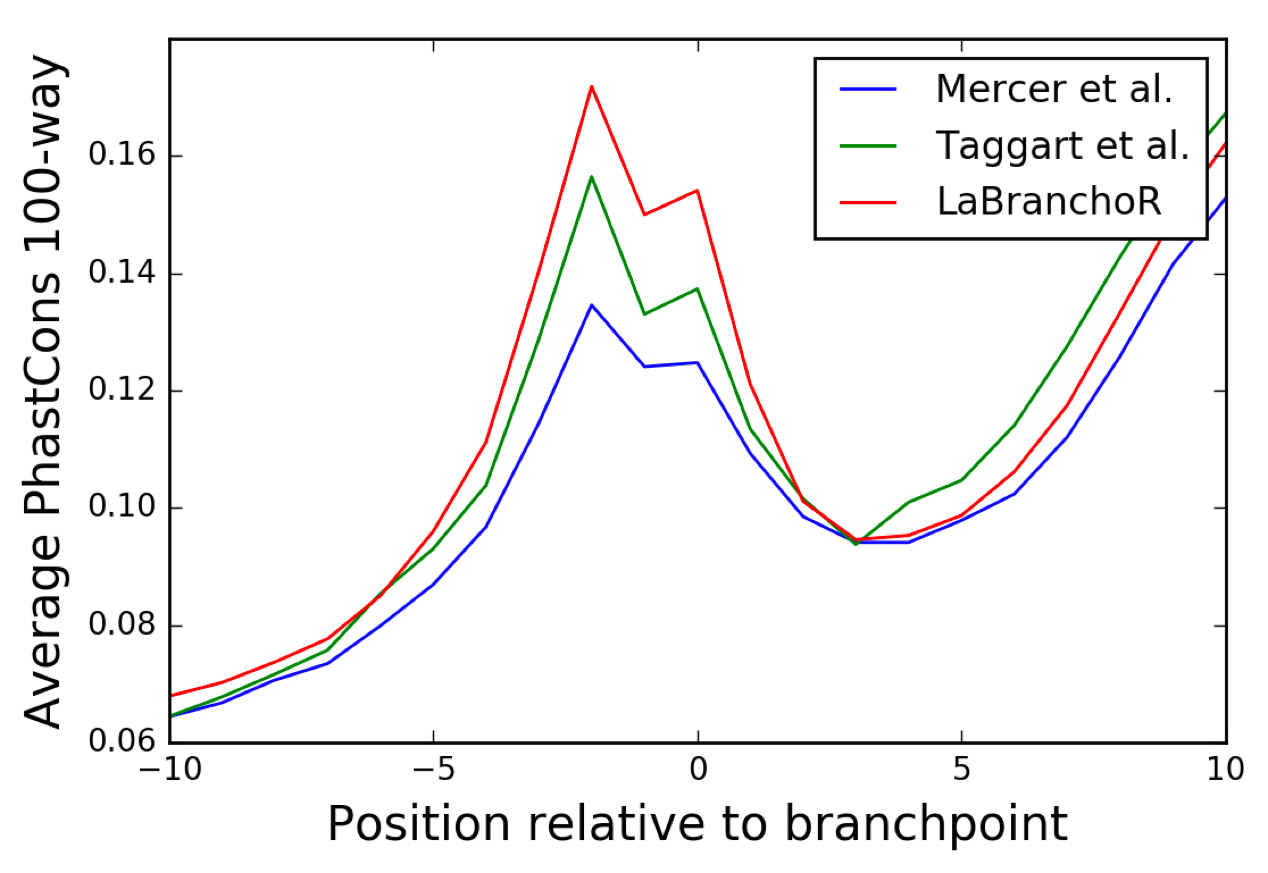
Branchpoints have previously been observed to have a distinct conservation signature, closely aligning with the bias in nucleotide content at each position (Fig. 1F; Mercer et al. 2015). Since conservation was not seen by LaBranchoR during training, it can be used as an independent validation metric. We considered PhastCons (Siepel et al. 2005) and PhyloP (Pollard et al. 2010) scores, which measure the probability that a base is part of a conserved element and the –log(P-value) that a base is not under selection, respectively. We expect both of these metrics to be higher in branchpoints than their surrounding regions, since branchpoints are required for splicing. We found that the Mercer, Taggart, and our predicted branchpoints display a similarly shaped PhastCons and PhyloP (Fig. 1F; Supplemental Fig. S2) conservation signature, but the increase in conservation at the branchpoint and −2 position is stronger for our predictions than the experimentally determined sites.
Conservation signatures and sequence motifs support LaBranchoR predictions
Considering these observations, we performed a more fine-grained analysis of the conservation signatures and sequence motifs in cases where we agree and disagree with the Mercer and Taggart set for 3′SSs in our test set (and validation set for the Taggart set to arrive at roughly equal numbers). For both the Taggart and Mercer set, the strongest conservation signatures are present where predictions match the experimental data (Fig. 2A,B). Interestingly, the intersection of LaBranchoR and Taggart sites results in the strongest conservation signature and a −2 U and branchpoint A are nearly always present (Fig. 2B; Supplemental Fig. S3). We found that predictions matching a Mercer low confidence branchpoint resulted in only a slightly weaker conservation signature than those matching high confidence sites (Fig. 2A).
FIGURE 2.

Conservation signatures and sequence motifs support LaBranchoR predictions. (A) Average PhastCons and PhyloP conservation signatures centered on LaBranchoR predictions matching a Mercer et al. (2015). high confidence site (Match), matching a Mercer et al. (2015) low confidence site (Match Low Conf), 1–4 nt from a Mercer et al. (2015) site (<4 off, predicted), and more than 4 nt from a Mercer et al. (2015) site (>4 off, predicted), as well as centered on Mercer et al. (2015) sites 1–4 nt from a predicted site (<4 off, Mercer) and more than 4 nt from a LaBranchoR prediction (>4 off, Mercer). (B) Equivalent figure for Taggart et al. (2017) branchpoints. (C) The unusual 2′-OH linkage present at branchpoints can result in reverse transcriptase skipping over nucleotides near the branchpoint, causing the raw experimental data to differ from the true branchpoint. LaBranchoR predictions shifted 1 and 2 nt toward the 3′SS of Mercer et al. (2015) sites have the expected sequence motifs and PhyloP conservation signature. (D) Taggart et al. (2017) branchpoints often differ from LaBranchoR predictions by small shifts toward the 3′SS. LaBranchoR predictions shifted 1 and 2 nt away from the 3′SS of Taggart et al. (2017) sites have the expected sequence motifs and PhyloP conservation signature.
In cases where our predictions disagree with the Taggart and Mercer sets, conservation signatures, and sequence motifs generally support our predictions over the experimental data, suggesting that performance estimated by explicit overlap with the experimental data is a loose lower bound. We found that the Mercer sites often disagreed with our predictions by small shifts away from the 3′SS, likely due to reverse transcriptase skipping nucleotides due to the unusual 2′-OH linkage at the branchpoint. In cases where our predicted branchpoints differ by a 1 or 2 nt shift from a Mercer site, sequence motifs centered on our predicted branchpoints display a similar motif to the expected branchpoint motif (Fig. 2C). Furthermore, average PhyloP conservation plots centered on the relevant Mercer sites show a clear shift from the signature observed in bulk (Fig. 2C). Conversely, the Taggart sites often disagreed with our predictions by small shifts toward the 3′SS, perhaps representing overcompensation for nucleotide skipping in their denoising protocol. Again, we observe that sequence motifs and conservation signatures centered on our predictions resemble bulk trends, whereas those centered on the Taggart data are shifted (Fig. 2D). Overall, in cases where our predictions lie 1–4 nt from a Taggart or Mercer site, conservation signatures centered on our predictions more closely resemble the consensus conservation signature than when centered on the experimental coordinates (Fig. 2A,B).
In cases where our predictions disagree by larger shifts (4+) from an experimental branchpoint, we found that our predicted branchpoints display a stronger PhastCons signature. For both the Mercer and Taggart data, the conservation signature centered on the experimental coordinate showed no clear increase in relation to the branchpoint (Fig. 2A,B). However, the story was not as clear for PhyloP conservation scores, as we found that all three sets show an increase at the −2 position, although the signature appears to be more similar to the consensus signature when centered on our predicted coordinates than the experimental coordinates.
Cytosine branchpoints and branchpoints without a −2 uracil have distinct properties
The strong trend toward A nucleotides at the branchpoint and U at the −2 position in our predicted set led us to consider if branchpoints lacking these properties displayed any distinct patterns. While C branchpoints represented only 1.5% of predicted branchpoints and 10% of Taggart branchpoints, about a fifth of predicted and Taggart branchpoints lack a U at the −2 position, so this subset represents a significant proportion of branchpoints in the genome. We chose to analyze the properties of these sites in parallel as they both likely represent weaker than average branchpoints and were, in fact, found to follow many of the same trends.
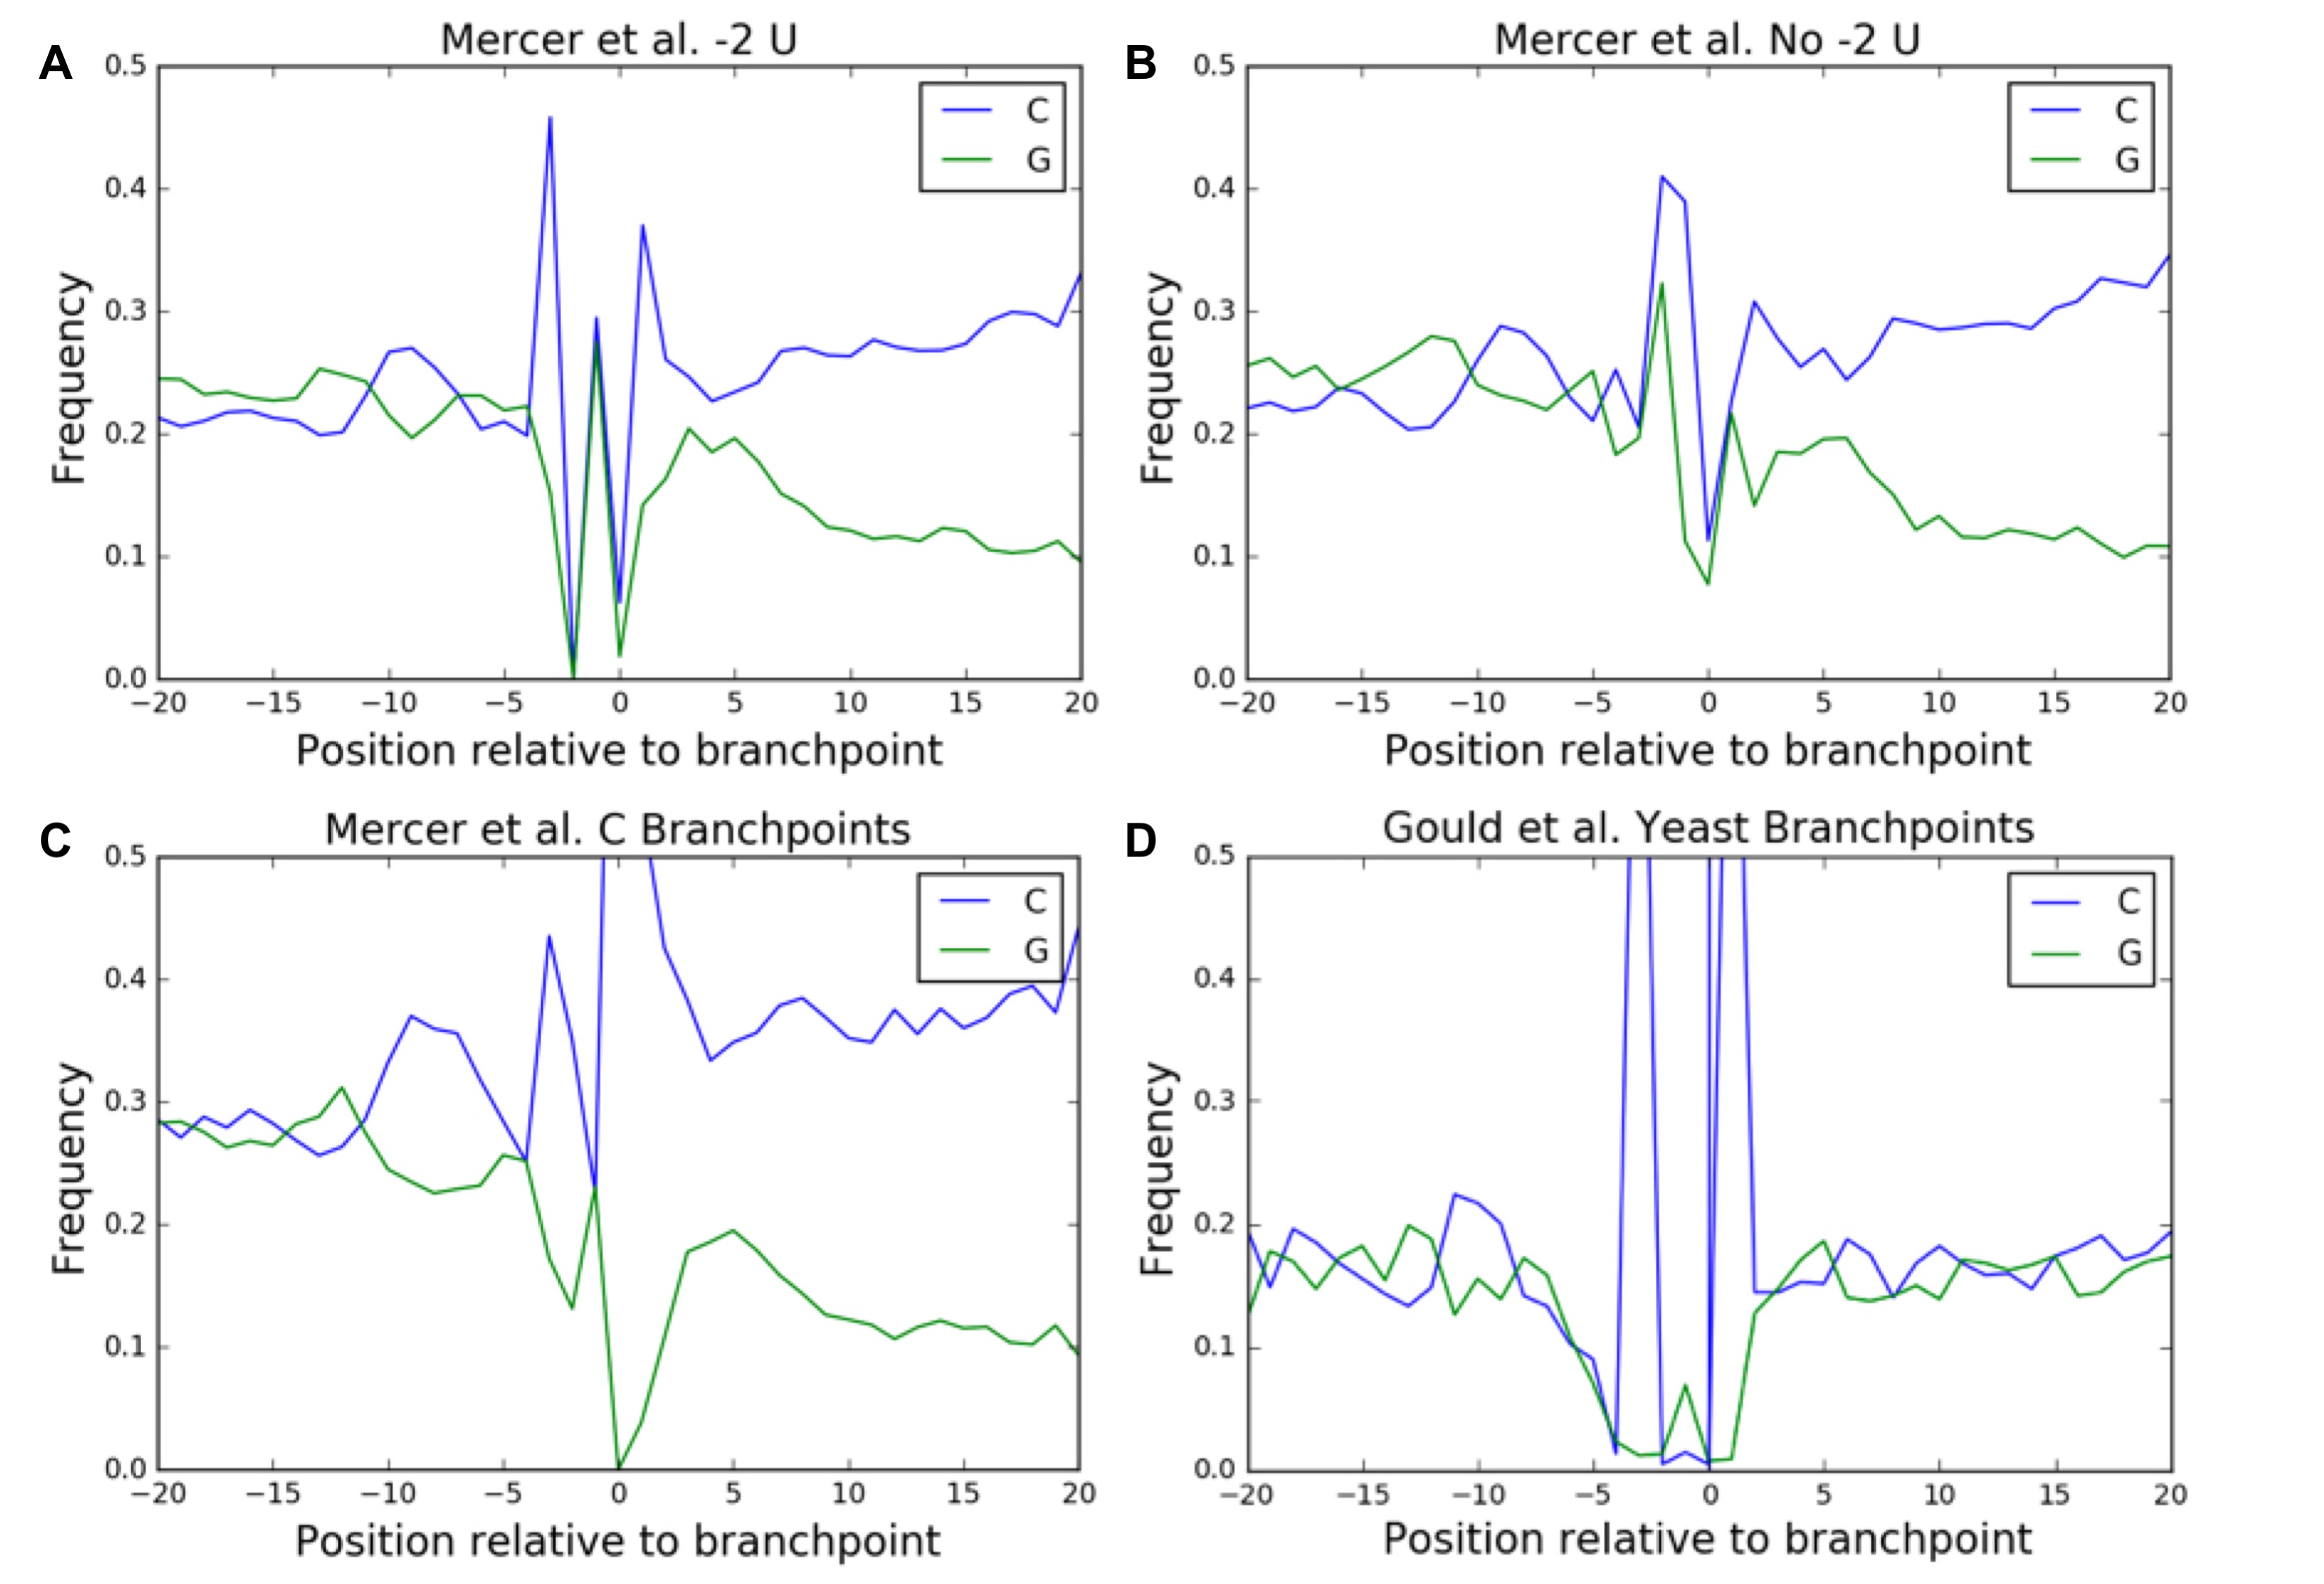
Both sets present sequence and conservation signatures diverging from the bulk trends. Branchpoints lacking a −2 U show an increased rate of U at the −3 position and C at the −1 and −4 positions (Fig. 3A). Meanwhile, C branchpoints have an increased rate of C nucleotides at the −3 and +1 position, consistent with the Taggart C branchpoints (Fig. 3A). For C branchpoints, average conservation scores increase at the positions of these increased nucleotide biases (Fig. 3B). For branchpoints lacking a −2 U, the previous increase in average conservation scores at the −2 position is entirely lost, which is consistent with the lack of a nucleotide preference at the −2 position in these branchpoints (Fig. 3B).
FIGURE 3.

Cytosine branchpoints and branchpoints lacking a −2 uracil display distinct properties. (A) Sequence motifs for C branchpoints (top) and branchpoints lacking a −2 U (bottom). (B) Conservation signatures for C and no −2 U branchpoints. (C) 3′SS nucleotide content for A and C branchpoints. C branchpoints have 1.43 times more C nucleotides in the −20 to −5 range than A branchpoints. (D) Both C and no −2 U branchpoints are found in shorter introns than expected. (E) Both groups have stronger than expected average 3′SS MaxEntScan scores and weaker than expected average 5′SS MaxEntScan scores (two-sided Wilcoxon rank sum test). (F) Both groups are enriched upstream of cassette exons and depleted in introns downstream from cassette exons (two-sided Fisher exact test).
We went on to examine if these sets of branchpoints were enriched for particular types of splicing events. We found that both sets were associated with short introns with median intron lengths shifting from 1654 to 1314 nt for branchpoints with and without a −2 U and from 1603 to 807 nt for A and C branchpoints (Wilcoxon rank sum test P = 1.1 × 10−102 and P = 2.1 × 10−121) (Fig. 3D). This trend is analogous to the association of short introns with weak splice sites (Farlow et al. 2012). Additionally, we found that both sets were enriched in retained introns and upstream of skipped exons and depleted from introns downstream from skipped exons (Fig. 3F; Supplemental Table S2). The enrichment of weak branchpoints upstream of skipped exons was previously observed in the Mercer branchpoints, albeit at a lower confidence (Mercer et al. 2015). This same study found that there was no enrichment of weak branchpoints in retained introns, likely due to a lack of statistical power due to the small number of retained introns in the genome.
Both subsets of branchpoints are associated with strong 3′SS sequences, as determined by MaxEntScan (Fig. 3E; Yeo and Burge 2004). This trend was previously observed for C branchpoints (Taggart et al. 2017); however, we add the observation that C branchpoints are associated with strikingly C-rich poly-pyrimidine tracks with a 1.42-fold enrichment of C's in positions −20 to −5 from the 3′SS (P ≅ 0 by a two-sided Fisher exact test) (Fig. 3C). C-rich PPTs can be bound by hnRNPEs (Ji et al. 2016), and it could be that such interactions stabilize otherwise unfavorable C branchpoints.
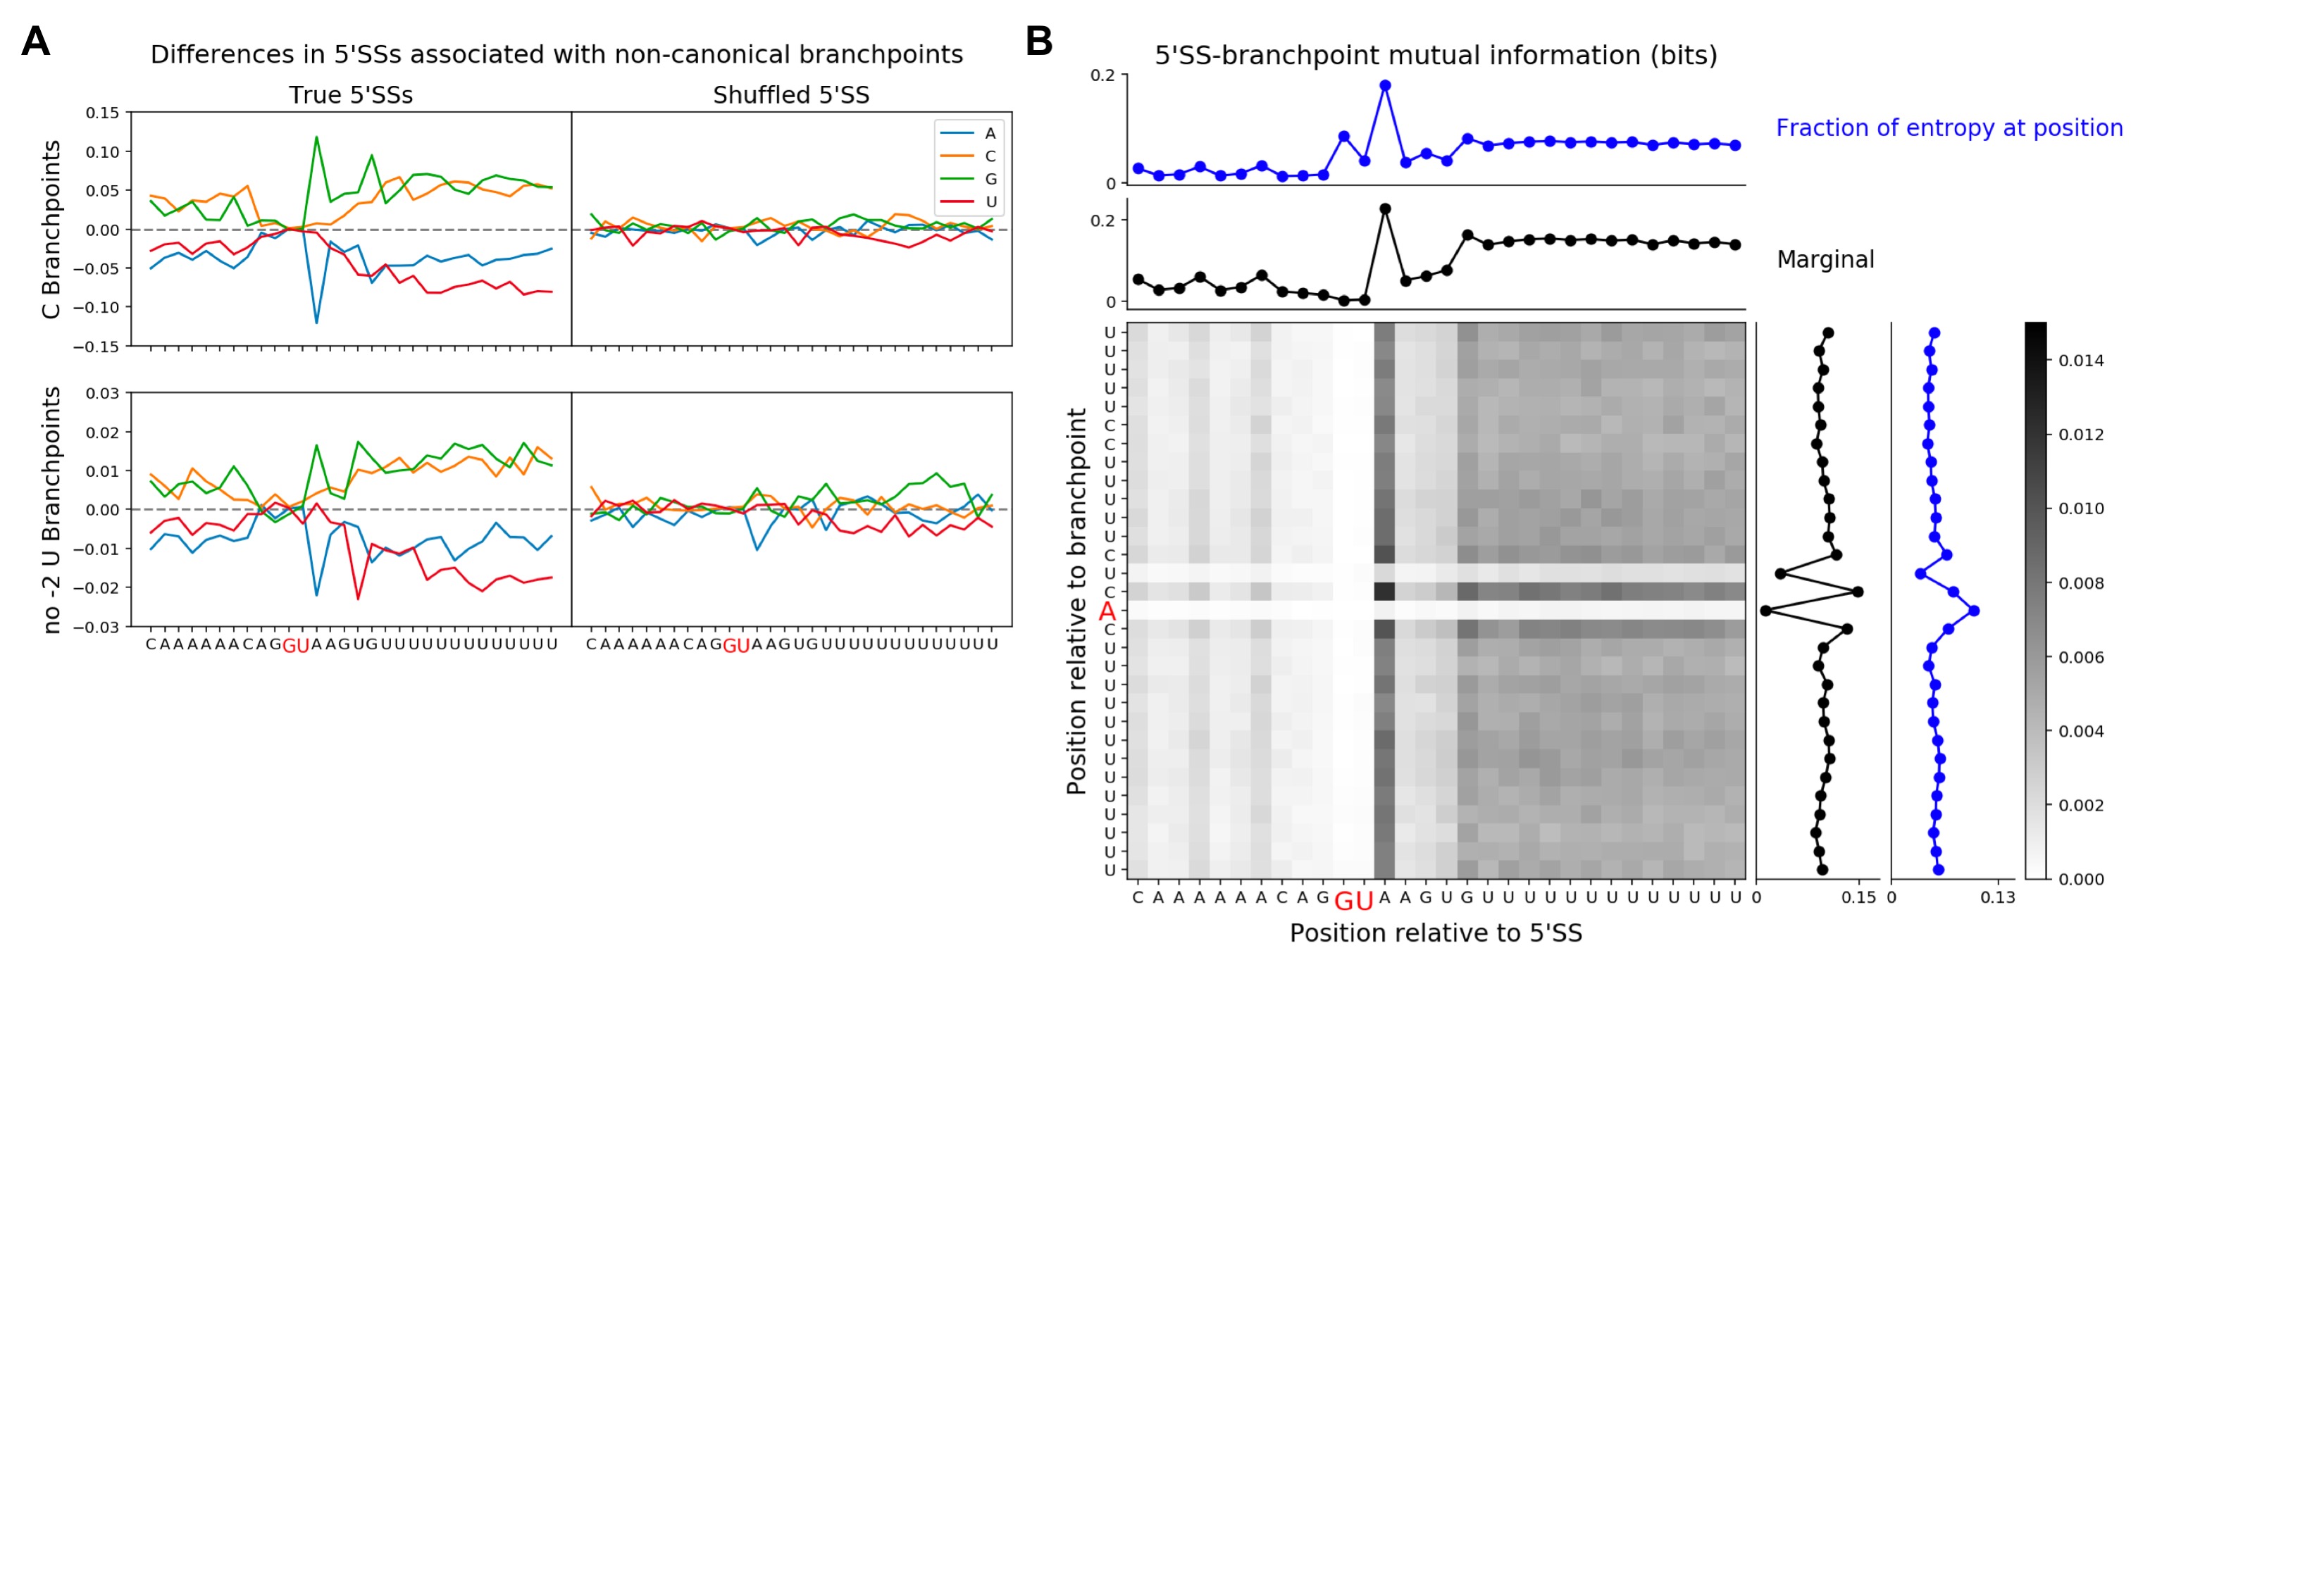
Opposing the trend for 3′SSs, both sets of branchpoints are associated with weak 5′SS sequences, as determined by MaxEntScan (Fig. 3E). The regions flanking 5′SSs associated with both subsets are generally GC-rich, and, additionally, there are position-specific differences in nucleotide content unique to each subset (Supplemental Fig. S5A). To more generally explore correlations between branchpoints and their corresponding 5′SS, we computed the mutual information between all pairs of positions near the branchpoint and 5′SS (Supplemental Fig. S5B). The mutual information, for example, between the branchpoint −1 position and the 5′SS +3 position, which are in fact the positions with the highest mutual information, quantifies the reduction in uncertainty of the identity of the nucleotide at the branchpoint −1 position given the identity of the nucleotide at the 5′SS +3 position, and vice versa. For the branchpoint, the marginal mutual information is highest at positions near the branchpoint (−3, −1, +1). For the 5′SS, the marginal mutual information is highest at the +3 position and was generally higher for positions in the intron than in the exon. These correlations largely appear to be due to similarities in GC-content between branchpoint sequences and their associated 5′SS sequences, i.e., GC-rich branchpoint sequences tend to be paired with GC-rich 5′SS sequences. All trends presented in this paragraph are stronger than can be explained by only intron length (see Materials and Methods). Taken together, these results show that there is a modest but significant correlation between branchpoint and 5′SS sequences, suggesting that the joint sequence information directing the spliceosome to these sites is greater than the simple sum of the information at each site.
A nucleotide content signature consistent with extended base-pairing to U2 snRNA is present upstream of branchpoints
Analysis of the sequence upstream of our predicted and experimental branchpoints revealed peaks in G content centered at positions −6 to −7 and −12 and a peak in C content at position −9 (Fig. 4A–C; Supplemental Fig. S4A–C). To the best of our knowledge, this sequence motif has not been previously observed in association with branchpoints and perhaps represents a novel sequence feature aiding in branchpoint recognition. Recent cryo-EM spliceosome structures show these bases in duplex with U2 snRNA (Fig. 4E; Galej et al. 2016; Bertram et al. 2017). There is a cytosine at positions −12 and −7 and guanine at −9 of U2 snRNA in position for Watson–Crick base-pairing to these peaks (Fig. 4D). Interestingly, the cryo-EM structure shows a distorted helix between the canonical branchpoint recognition sequence and this region of extended base-pairing. This distortion could allow for shifts in the alignment of the intronic RNA and U2 snRNA resulting in the smooth observed peaks.
FIGURE 4.

Branchpoints display a nucleotide content signature, consistent with extended base-pairing with U2 snRNA. This signature is stronger in branchpoints lacking a −2 U (B) than in branchpoints with a −2 U (A). (C) C branchpoints display a strong increase in C nucleotide content in this same position. (D) The human and yeast U2 snRNA sequence positioned for interacting with this upstream recognition element (top). P represents psuedouridines and (*) corresponds to the branchpoint position. The canonical branchpoint motif (upper case) and positions of G, C content signature (lower case). (E) An image from a cryo-EM structure of the spliceosome (PDB ID: 5O9Z) shows an extended intron-U2 snRNA duplex. The intronic sequence is shown in gray, except for the branchpoint which is shown in red. The U2 snRNA sequence is colored by base (red, blue, green, and magenta for A, C, G, and T, respectively).
This signature is significantly stronger for branchpoints lacking a −2 U than for branchpoints with a −2 U present with a 1.190-, 1.145-, 1.193-fold increase in the strength of peaks at −6, −9, and −12, respectively (Fisher exact two-tailed P = 1.1 × 10−56, 5.0 × 10−41, 2.3 × 10−60). This trend is stronger still in C branchpoints as opposed to A branchpoints, although in this case the increase in C content seems to dominate the G content signature, and the upstream sequence is overall more C-rich, making enrichment analysis challenging (Fig. 4C).
Branchpoints are enriched for pathogenic variants and depleted of likely benign variants
We assembled a set of pathogenic variants by taking the union of variants labeled “Pathogenic” in ClinVar and “DM” in HGMD and filtering out any variant with a nonsynonymous effect on a protein-coding sequence (Stenson et al. 2014; Landrum et al. 2016). We found that LaBranchoR predictions display a strong overlap with these sites with 52 variants directly overlapping the branchpoint, 15 at the −2 position, and 25 in positions −1, −3, and +1 for a total of 92 pathogenic variants (Fig. 5C). In comparison, despite predicting 69,617 (133%) more branchpoints (as they allowed for multiple branchpoints per 3′SS), branchpointer predictions have only 46 variants directly overlapping the branchpoint, 10 at the −2 position, and 27 in positions −1, −3, and +1 for a total of 88 pathogenic variants. Tuning LaBranchoR to predict the same number of branchpoints resulted in the prediction of 106 total pathogenic variants in the −3 to +1 interval. (Despite this observation, we stuck with predicting one branchpoint per 3′SS as our primary task because the rate of overlap with pathogenic variants is much lower in the additional branchpoints [one in 4273] than the initial predictions [one in 2174].) Additionally, when considering regions upstream of 3′SSs where Mercer and Taggart branchpoints exist, our predictions overlap a larger number of pathogenic variants than the experimental data (Fig. 5A,B).
FIGURE 5.

LaBranchoR predicted branchpoints overlap pathogenic variants and exclude common variants. (A) Overlaps with pathogenic variants for Mercer et al. (2015) high confidence branchpoints and LaBranchoR predictions for 3′SS with a Mercer et al. (2015) high confidence site. (B) Similar for Taggart et al. (2017) branchpoints. (C) Genome-wide pathogenic variant overlaps for the current state-of-the art branchpoint predictor, branchpointer (Signal et al. 2018), LaBranchoR, and LaBranchoR tuned to predict the same number of branchpoints as branchpointer (LaBranchoR +). (D) Comparison of the common variant frequency in ExAC for distance from 3′SS matched UNA trinucleotides, where the A is implicated as a branchpoint (BP) and not a branchpoint (not BP). (E) Enrichments in variation frequency of branchpoint UNAs, as compared to non-branchpoint UNAs for common and rare variants. (F) Similar comparison of branchpoints in high probability loss of function intolerant (pLI) genes to low pLI genes. (G) In silico mutagenesis (ISM) scores are defined as the change in score of our predicted branchpoint induced by the variant. (H) LaBranchoR ISM scores effectively classify pathogenic variants. A receiver–operator curve for HGMD and ClinVar variants sorted by LaBranchoR ISM scores and SPIDEX scores.
Conversely, we reaffirm that variants present in the general population, as reported by the ExAC consortium (Lek et al. 2016), are excluded from branchpoints (Mercer et al. 2015; Signal et al. 2018). To circumvent sequence and distance biases in variation rate, we compared the variation rate at predicted branchpoints with an A at the branchpoint and U at the −2 position to UNA tri-nucleotides not implicated as branchpoints from a matched distance distribution. We found that branchpoints show a 0.776- and 0.815-fold enrichment of common variants (occurring in at least one in 10,000 people) at the −2 and branchpoint positions (P = 8.0 × 10−41, 7.3 × 10⁻³³ by a two-sided Fisher exact test) (Fig. 5D). Furthermore, these trends are stronger for common variants than for rare variants and for branchpoints in genes with a probability of loss of function intolerance (pLI) > 0.9 than genes with pLI < 0.9 (P < 10 × 10−5, 10 × 10−6 by a two-sided Fisher exact test) (Fig. 5E,F; Lek et al. 2016). Interestingly, we found that for all sets there is a marked enrichment in variation in the +1 to +4 positions, which is mirrored by a lull in pathogenic variants, perhaps indicating that this region generally plays little functional role apart from serving as a linker between the PPT and branchpoint sequence (Fig. 5A–F).
We quantified the effect of variants on branchpoint strength by comparing predictions for the reference and alternative sequences: a technique often referred to as ISM (Signal et al. 2018). Specifically, we calculated the change induced by the variant on the score of the branchpoint predicted for the reference sequence (Fig. 5G). We found that pathogenic variants located 18–45 nt upstream of a 3′SS have significantly stronger mutagenesis scores than likely benign, ExAC variants (Fig. 5H). In fact, our ISM scores outperform a state-of-the-art model for predicting changes in splicing induced by variants, SPIDEX (Xiong et al. 2015), in separating pathogenic variants from ExAC variants in the −18 to −45 nt range, achieving an area under the receiver–operator curve statistic of 0.718, as compared to 0.585 for SPIDEX (Fig. 5H).
DISCUSSION
While it is hard to precisely evaluate our model's performance due to inherent noise in the experimental data introduced by nucleotide skipping as reverse transcriptase traverses the unusual 2′OH linkage at the 5′SS–branchpoint junction, we find that LaBranchoR is able to correctly predict a branchpoint for at least 75% of 3′SSs, and our analysis suggests that LaBranchoR is able to correctly predict a branchpoint for over 90% of 3′SSs. We arrive at this conclusion based on explicit agreement with experimental annotations (75% high confidence, 84% low confidence), analysis of conservation signatures in cases where we deviate from experimental annotations by <5 nt (91%), and slightly less compelling conservation signatures in the remaining case.
The fact that our predicted branchpoints are more accurate than the raw experimental data shows that having a reliable way to remove noise introduced by nucleotide skipping and transcript switching will continue to be valuable even as more experimental data becomes available. Furthermore, there are currently 206,292 annotated 3′SSs in human protein-coding genes, only 37,110 (18%) of which have an annotated branchpoint. Many of these 3′SS are expressed in only a handful of cell types (GTEx Consortium 2015), so experimental annotation of the remaining branchpoints would require deep sequencing, likely targeted at branchpoints (Mercer et al. 2015), for most cell types. Meanwhile, since our method can make accurate predictions for sequences it did not see in training, it can annotate branchpoints for all 3′SSs, as well as any alternative 3′SS sequence observed in a particular individual (Lek et al. 2016).
It has been previously shown that 3′SS strength correlates with alternative splicing outcomes (Shepard et al. 2011) and our analysis shows that the same trends hold for branchpoint strength. Our genome-wide branchpoint predictions allowed us to assess the properties of two groups of weak branchpoints: those lacking a −2 U and those with a C at the branchpoint. We found that these weak branchpoints are enriched for two types of conditionally used splice sites: those involved in intron retention and those upstream of skipped exons. Additionally, we found that weak branchpoints are excluded from introns downstream from skipped exons, supporting that branchpoint strength helps enable competition between the two relevant 3′SSs. This complements a report that branchpoints abnormally far upstream of 3′SSs enable exon skipping by slowing the upstream splicing reaction between the first and second catalytic steps (Taggart et al. 2017). These groups of weak branchpoints are generally associated with stronger than average 3′SSs, supporting that 3′SS selection is a holistic process where the strength of the branchpoint, PPT, and core signal interact to result in the overall strength of the 3′SS.
We found a distinct signature in G and C nucleotide content upstream of branchpoints, consistent with an extended region of base-pairing with U2 snRNA. This extended base-pairing is observed in recent cryo-EM spliceosome structures (Galej et al. 2016; Bertram et al. 2017) and is consistent with an early biochemical study showing that “SAP 145, together with four other SF3a/SF3b subunits, UV cross-links to pre-mRNA in a 20-nt region upstream of the BPS” (Gozani et al. 1996). This region of U2 snRNA shares 100% sequence identity with U2 snRNA in budding yeast, albeit in humans four of these bases are modified to form psuedouridines, while in yeast only two have this modification (Fig. 4D; Yu et al. 2011). Indeed, we observed a similar pattern in G, C content in a data set of 718 budding yeast branchpoints (Supplemental Fig. S4D; Gould et al. 2016). The extensive pseudouridylation, a modification resulting in stronger base-pairing to all bases (Kierzek et al. 2014), of this stretch of U2 snRNA could provide a mechanism by which this region is able to interact favorably with a diverse set of RNA sequences and explain why human branchpoints are more degenerate than yeast branchpoints.
Mirroring trends in 3′SS strength, we found that the signature in G and C nucleotide content upstream of branchpoints was on average stronger for weak branchpoints, supporting that it plays a positive role in branchpoint selection and enables usage of otherwise weak branchpoints. Together with the biochemical data showing that SF3b contacts this region, disruption of this extended interaction in SF3b mutants presents a potential mechanism of the erroneous splicing in SF3b-associated cancer. Disruption of the extended interaction could require a stronger core branchpoint for stable U2 binding, resulting in the observed usage of novel 3′SSs, characterized by stronger than average branchpoints (Alsafadi et al. 2016).
The initial motivating factor for developing LaBranchoR was to aid in the identification of pathogenic genetic variants, and we found that LaBranchoR has state-of-the-art performance in this area. While the strong overlap between our predicted branchpoints and variants associated with Mendelian disease is not surprising based on past work (Taggart et al. 2012; Mercer et al. 2015; Signal et al. 2018), our predictions overlap pathogenic variants at a higher rate than both previous computational predictions and the raw experimental data. Furthermore, we found that LaBranchoR ISM scores are better able to distinguish pathogenic variants from variants in the general population than SPIDEX scores, showing that explicit branchpoint prediction provides information not captured by generic splicing models. Recently, we integrated LaBranchoR predictions into a model for distinguishing benign from Mendelian disease causing variants affecting splicing, S-CAP, and found that these scores increased model performance (Jagadeesh et al. 2018).
The state-of-the-art branchpoint predictions presented in this study promise to further our understanding of RNA splicing and its role in disease. Moving forward, studies will be able to explore the associations of splicing quantitative trait loci and splicing regulators with branchpoints in addition to splice sites. The strong predictive performance of LaBranchoR, the apparent noise in the experimental data (leading to a diluted sequence motif), and the existence of a sequence signature of extended U2 snRNA base-pairing suggests that branchpoints are less degenerate and thereby more important than previously believed.
MATERIALS AND METHODS
Preparation of annotations
High confidence branchpoints implicated by Mercer et al. (2015) (their Supplementary data table 2) were downloaded from Genome Research, as were the Taggart et al. (2017) branchpoint predictions. We did not consider Taggart predictions whose “binding model” was “none,” “transcript_skipping,” or “circle.” A set of 718 budding yeast branchpoints were obtained from Gould et al. (2016).
Introns were extracted from the Gencode v19 annotations for all protein-coding genes. Bedtools were used to link branchpoints to 3′SSs using the intersect -loj command. Branchpoints were considered to be associated with a 3′SS, if they lie between 5 and 60 bp upstream of it. The Mercer high confidence set of branchpoints was used to produce a training, validation, and test set split by chromosome. Chromosome 1 was used as a test set. Chromosomes 2, 3, and 4 were used as a validation set and all others were used for training.
PhyloP and Phastcons 100-way scores were downloaded from the UCSC website. They were used to produce average conservation plots using in-house scripts with the help of bedtools.
Model training
For each 3′SS, a target vector was composed to have a 1 in each position with a high confidence Mercer et al. (2015) branchpoint and zeros elsewhere. An input vector was composed by “one-hot encoding” the 70 bp of genomic sequence immediately upstream of the 3′SS, i.e., encoded by a 70 by four vector where the ith position has a 1 in the 0th position if the ith nucleotide is an A, a 1 in the first position if the ith nucleotide is a C, a 1 in the second position if the ith nucleotide is a G, and a 1 in the third position if the ith nucleotide is a T.
The model used was a two-layer bidirectional LSTM (Hochreiter and Schmidhuber 1997). The model was implemented using keras version 2.0.4 (https://github.com/fchollet/keras). The final model has 32 hidden nodes in each direction for both layers. The output of both LSTM layers are stacked to form a 70 × 64 tensor that is passed to the next layer. Per base predictions were computed by taking a linear combination of the hidden states of the second layer and applying a sigmoid function to map the outputs to a single number between zero and one. A binary cross entropy loss function was employed in training. Both recurrent (0.05) and standard dropout (0.15) were employed. Dropout randomly removes units from the network during training, preventing the model from memorizing the precise input–output pairs present in the training data, leading to better extrapolation (Srivastava et al. 2014). The model was trained with the Adam optimizer with default keras parameters. The model was trained until the number of validation set branchpoints that overlap with Mercer et al. (2015) branchpoints did not increase for 15 epochs. We experimented with many hyperparameter settings, but found that as long as the hidden space was sufficiently large and the network contained at least two layers, performance did not significantly change.
Model testing
Model performance was tested using the 4306 3′SSs on chromosome 1 that were held out from the training and validation set. The fraction of the top scoring branchpoints for a given 3′SS overlapping an experimental branchpoint was calculated using an in-house script. Sklearn functions were used to compute receiver–operator curve and precision–recall curve statistics. For each of these statistics, we calculated them separately for considering all bases in the −70 to −1 positions that were assigned branchpoint scores as well as for the −45 to −18 positions in which the vast majority of branchpoints fall. As was done in Signal et al. (2018), we masked positions corresponding to low confidence branchpoints from the negative set, when computing area under the curve and recall and false discovery rate statistics.
Comparison to branchpointer and SVM-BPFinder
We compared our model to predictions from the branchpointer R package created by Signal and coworkers (https://bioconductor.org/packages/release/bioc/html/branchpointer.html) (Signal et al. 2018). Predictions were prepared for our test set by using their pretrained model and closely following the example given in the reference manual. We additionally downloaded a precomputed file of genome-wide predictions in Gencode v19 introns for analysis of overlap with pathogenic variants. We obtained the training and test set used by Signal and coworkers (https://osf.io/hrqvq/). We also compared to SVM-BPFinder (Corvelo et al. 2010), which we obtained predictions for by following the instructions given at (https://bitbucket.org/regulatorygenomicsupf/svm-bpfinder). To select the best branchpoint for each 3′SS, we used the script, “calculate_best_BP_per_intron.pl” available at (http://regulatorygenomics.upf.edu/Software/SVM_BP/). This model, too, was pretrained by the original authors.
Genetic variants
A set of pathogenic variants was composed by taking the union of ClinVar “Pathogenic” and HGMD PRO 2017 “DM” variants. We removed all variants that affected a protein-coding sequence. ANNOVAR v527 was used to annotate variants with a predicted effect on protein-coding genes using gene isoforms from Ensembl gene set version 75 for the hg19/GRCh37 assembly of the human genome (Wang et al. 2010). All coding isoforms were used where the transcript start and end sites were marked as complete and the coding span was a multiple of three.
Likely benign variants were obtained through the ExAC browser. For simplicity, in this set we considered only single nucleotide polymorphisms. Variants were split into “common” and “rare” based on the maximum allele frequency present in any population with an allele frequency of greater than 1 in 10,000 being defined as common and all others as rare. The March 16, 2017 release 3 of probability of loss of function intolerant predictions were also obtained from the ExAC browser.
When computing enrichments of ExAC variants, we wished to control for nucleotide content and distance from the 3′SS. This was particularly important as we noticed that T's and A's are generally less prone to variation (due to the high mutation rates of CG dinucleotides), leading to an artificially strong signal at the −2 position and branchpoint. To accomplish this, we compared variant frequency at branchpoints with a U at the −2 position and an A at the branchpoint to variant frequency at UNA tri-nucleotides not implicated as branchpoints. We then defined a variant enrichment as the rate of variants for branchpoint UNAs divided by rate of variants for non-branchpoint UNAs. We computed the statistical significance at each position relative to the branchpoint using the two-sided Fisher exact test available through Scipy. We computed these statistics for both allele frequency > 0.0001 and allele frequency <= 0.0001, branchpoints in pLI >= 0.9 genes and branchpoints in pLI < 0.0001 genes. We again used a Fisher exact test to assess statistical significance between these cases at each nucleotide.
Exon type annotations
The 2013 version 2 build of MISO exon skipping and intron retention event annotations were downloaded from the MISO wiki (https://miso.readthedocs.io/en/fastmiso/) (Katz et al. 2010). We made no attempt to filter these annotations based on additional functional data.
Splice site strength quantification
We used the MaxEntScan package, as available at http://genes.mit.edu/burgelab/maxent/download/, to quantify the strength of splice sites. An in-house wrapper script was developed to invoke the program cleanly in Python, but no functional changes were made.
Controlling for intron length in analysis of associated 5′SSs
We found that C branchpoints and branchpoints lacking a −2 U occur in shorter than average introns. In order to assure that the correlations between branchpoints and their associated 5′SSs are not merely products of this trend, we generated a shuffled set of branchpoint–5′SS pairs for which all pairs come from distinct introns whose lengths differ by <5% of the length of the smaller intron. In this way, any correlation due to only intron length should be present in this shuffled set. In this shuffled set, we found a much weaker correlation between 5′SS strength and whether the branchpoint nucleotide is an A or C nor whether there is a U at the −2 position than in the real data. Furthermore, we found no branchpoint–5′SS position pairs with a mutual information greater than 5 × 10⁻⁴, much less than many mutual informations observed in the real data.
DATA DEPOSITION
Codes to recreate all components of our study and final trained model weights are available at https://github.com/jpaggi/labranchor. A bed file of predicted branchpoints for Gencode v19 protein-coding genes is available in Supplemental Additional File 1. A file of LaBranchoR scores for all positions 70 bp upstream of a 3′SS is in Supplemental Additional File 2. ISM scores for the 70 bp upstream of all exons in Gencode v19 protein-coding genes are in Supplemental Additional File 3.
SUPPLEMENTAL MATERIAL
Supplemental material is available for this article.
Supplementary Material
ACKNOWLEDGMENTS
We thank Karthik Jagadeesh for advice on obtaining and processing variant data, Peter Stenson and David Cooper for access to HGMD, Ron Dror for supporting our work, Tim Mercer for suggesting the analysis of correlations between properties of branchpoints and their associated 5′SSs, and Eduardo Eyras for advice on running SVM-BPFinder optimally. This work was funded in part by a Stanford School of Engineering Fellowship and Stanford Graduate Fellowship (J.M.P.), National Institutes of Health grant U01MH105949, a Packard Foundation Fellowship, and a Microsoft Faculty Fellowship (G.B.).
Author contributions: J.M.P. conceptualized the study, performed the analyses, and wrote the manuscript with G.B.
Footnotes
Article is online at http://www.rnajournal.org/cgi/doi/10.1261/rna.066290.118.
REFERENCES
- Alsafadi S, Houy A, Battistella A, Popova T, Wassef M, Henry E, Tirode F, Constantinou A, Piperno-Neumann S, Roman-Roman S, et al. 2016. Cancer-associated SF3B1 mutations affect alternative splicing by promoting alternative branchpoint usage. Nat Commun 7: 10615. [DOI] [PMC free article] [PubMed] [Google Scholar]
- Berglund JA, Abovich N, Rosbash M. 1998. A cooperative interaction between U2AF65 and mBBP/SF1 facilitates branchpoint region recognition. Genes Dev 12: 858–867. [DOI] [PMC free article] [PubMed] [Google Scholar]
- Bertram K, Agafonov DE, Liu W-T, Dybkov O, Will CL, Hartmuth K, Urlaub H, Kastner B, Stark H, Lührmann R. 2017. Cryo-EM structure of a human spliceosome activated for step 2 of splicing. Nature 542: 318–323. [DOI] [PubMed] [Google Scholar]
- Corvelo A, Hallegger M, Smith CWJ, Eyras E. 2010. Genome-wide association between branch point properties and alternative splicing. PLoS Comput Biol 6: 1001016. [DOI] [PMC free article] [PubMed] [Google Scholar]
- Farlow A, Dolezal M, Hua L, Schlötterer C. 2012. The genomic signature of splicing-coupled selection differs between long and short introns. Mol Biol Evol 29: 21–24. [DOI] [PMC free article] [PubMed] [Google Scholar]
- Galej WP, Wilkinson ME, Fica SM, Oubridge C, Newman AJ, Nagai K. 2016. Cryo-EM structure of the spliceosome immediately after branching. Nature 537: 197–201. [DOI] [PMC free article] [PubMed] [Google Scholar]
- Gould GM, Paggi JM, Guo Y, Phizicky DV, Zinshteyn B, Wang ET, Gilbert WV, Gifford DK, Burge CB. 2016. Identification of new branch points and unconventional introns in Saccharomyces cerevisiae. RNA 22: 1522–1534. [DOI] [PMC free article] [PubMed] [Google Scholar]
- Gozani O, Feld R, Reed R. 1996. Evidence that sequence-independent binding of highly conserved U2 snRNP proteins upstream of the branch site is required for assembly of spliceosomal complex A. Genes Dev 10: 233–243. [DOI] [PubMed] [Google Scholar]
- GTEx Consortium. 2015. Human genomics. The Genotype-Tissue Expression (GTEx) pilot analysis: multitissue gene regulation in humans. Science 348: 648–660. [DOI] [PMC free article] [PubMed] [Google Scholar]
- Heintz C, Doktor TK, Lanjuin A, Escoubas CC, Zhang Y, Weir HJ, Dutta S, Silva-García CG, Bruun GH, Morantte I, et al. 2017. Splicing factor 1 modulates dietary restriction and TORC1 pathway longevity in C. elegans. Nature 547: 476. [DOI] [PubMed] [Google Scholar]
- Hochreiter S, Schmidhuber J. 1997. Long short-term memory. Neural Comput 9: 1735–1780. [DOI] [PubMed] [Google Scholar]
- Hoskins AA, Moore MJ. 2012. The spliceosome: a flexible, reversible macromolecular machine. Trends Biochem Sci 37: 179–188. [DOI] [PMC free article] [PubMed] [Google Scholar]
- Jagadeesh KA, Paggi JM, Ye JS, Stenson PD, Cooper DN, Bernstein JA, Bejerano G. 2018. S-CAP extends clinical-grade pathogenicity prediction to genetic variants that affect RNA splicing. bioRxiv 10.1101/343749. [DOI] [PubMed] [Google Scholar]
- Ji X, Park JW, Bahrami-Samani E, Lin L, Duncan-Lewis C, Pherribo G, Xing Y, Liebhaber SA. 2016. αCP binding to a cytosine-rich subset of polypyrimidine tracts drives a novel pathway of cassette exon splicing in the mammalian transcriptome. Nucleic Acids Res 44: 2283–2297. [DOI] [PMC free article] [PubMed] [Google Scholar]
- Katz Y, Wang ET, Airoldi EM, Burge CB. 2010. Analysis and design of RNA sequencing experiments for identifying isoform regulation. Nat Methods 7: 1009–1015. [DOI] [PMC free article] [PubMed] [Google Scholar]
- Kierzek E, Malgowska M, Lisowiec J, Turner DH, Gdaniec Z, Kierzek R. 2014. The contribution of pseudouridine to stabilities and structure of RNAs. Nucleic Acids Res 42: 3492–3501. [DOI] [PMC free article] [PubMed] [Google Scholar]
- Landrum MJ, Lee JM, Benson M, Brown G, Chao C, Chitipiralla S, Gu B, Hart J, Hoffman D, Hoover J, et al. 2016. ClinVar: public archive of interpretations of clinically relevant variants. Nucleic Acids Res 44: 862–868. [DOI] [PMC free article] [PubMed] [Google Scholar]
- Lek M, Karczewski KJ, Minikel EV, Samocha KE, Banks E, Fennell T, O'Donnell-Luria AH, Ware JS, Hill AJ, Cummings BB, et al. 2016. Analysis of protein-coding genetic variation in 60,706 humans. Nature 536: 285–291. [DOI] [PMC free article] [PubMed] [Google Scholar]
- Lim KH, Ferraris L, Filloux ME, Raphael BJ, Fairbrother WG. 2011. Using positional distribution to identify splicing elements and predict pre-mRNA processing defects in human genes. Proc Natl Acad Sci 108: 11093–11098. [DOI] [PMC free article] [PubMed] [Google Scholar]
- Lipton ZC, Berkowitz J, Elkan C. 2015. A critical review of recurrent neural networks for sequence learning. arXiv 1506.00019v4. [Google Scholar]
- Mercer TR, Clark MB, Andersen SB, Brunck ME, Haerty W, Crawford J, Taft RJ, Nielsen LK, Dinger ME, Mattick JS. 2015. Genome-wide discovery of human splicing branchpoints. Genome Res 2: 290–303. [DOI] [PMC free article] [PubMed] [Google Scholar]
- Pascolo E, Séraphin B. 1997. The branchpoint residue is recognized during commitment complex formation before being bulged out of the U2 snRNA-pre-mRNA duplex. Mol Cell Biol 17: 3469–3476. [DOI] [PMC free article] [PubMed] [Google Scholar]
- Peled-Zehavi H, Berglund JA, Rosbash M, Frankel AD. 2001. Recognition of RNA branch point sequences by the KH domain of splicing factor 1 (mammalian branch point binding protein) in a splicing factor complex. Mol Cell Biol 21: 5232–5241. [DOI] [PMC free article] [PubMed] [Google Scholar]
- Pollard KS, Hubisz MJ, Rosenbloom KR, Siepel A. 2010. Detection of nonneutral substitution rates on mammalian phylogenies. Genome Res 20: 110–121. [DOI] [PMC free article] [PubMed] [Google Scholar]
- Shepard PJ, Choi E-A, Busch A, Hertel KJ. 2011. Efficient internal exon recognition depends on near equal contributions from the 3′ and 5′ splice sites. Nucleic Acids Res 39: 8928–8937. [DOI] [PMC free article] [PubMed] [Google Scholar]
- Siepel A, Bejerano G, Pedersen JS, Hinrichs AS, Hou M, Rosenbloom K, Clawson H, Spieth J, Hillier LW, Richards S, et al. 2005. Evolutionarily conserved elements in vertebrate, insect, worm, and yeast genomes. Genome Res 15: 1034–1050. [DOI] [PMC free article] [PubMed] [Google Scholar]
- Signal B, Gloss BS, Dinger ME, Mercer TR. 2018. Machine learning annotation of human branchpoints. Bioinformatics 34: 920–927. [DOI] [PubMed] [Google Scholar]
- Srivastava N, Hinton G, Krizhevsky A, Sutskever I, Salakhutdinov R. 2014. Dropout: a simple way to prevent neural networks from overfitting. J Mach Learn Res 15: 1929–1958. [Google Scholar]
- Stenson PD, Mort M, Ball EV, Shaw K, Phillips AD, Cooper DN. 2014. The Human Gene Mutation Database: building a comprehensive mutation repository for clinical and molecular genetics, diagnostic testing and personalized genomic medicine. Hum Genet 133: 1–9. [DOI] [PMC free article] [PubMed] [Google Scholar]
- Taggart AJ, DeSimone AM, Shih JS, Filloux ME, Fairbrother WG. 2012. Large-scale mapping of branchpoints in human pre-mRNA transcripts in vivo. Nat Struct Mol Biol 19: 719–721. [DOI] [PMC free article] [PubMed] [Google Scholar]
- Taggart AJ, Lin C-L, Shrestha B, Heintzelman C, Kim S, Fairbrother WG. 2017. Large-scale analysis of branchpoint usage across species and cell lines. Genome Res 4: 639–649. [DOI] [PMC free article] [PubMed] [Google Scholar]
- Wang K, Li M, Hakonarson H. 2010. ANNOVAR: functional annotation of genetic variants from high-throughput sequencing data. Nucleic Acids Res 38: e164. [DOI] [PMC free article] [PubMed] [Google Scholar]
- Wu JA, Manley JL. 1991. Base pairing between U2 and U6 snRNAs is necessary for splicing of a mammalian pre-mRNA. Nature 352: 818–821. [DOI] [PubMed] [Google Scholar]
- Xiong HY, Alipanahi B, Lee LJ, Bretschneider H, Merico D, Yuen RKC, Hua Y, Gueroussov S, Najafabadi HS, Hughes TR, et al. 2015. RNA splicing. The human splicing code reveals new insights into the genetic determinants of disease. Science 347: 1254806. [DOI] [PMC free article] [PubMed] [Google Scholar]
- Yeo G, Burge CB. 2004. Maximum entropy modeling of short sequence motifs with applications to RNA splicing signals. J Comput Biol 11: 377–394. [DOI] [PubMed] [Google Scholar]
- Yu AT, Ge J, Yu YT. 2011. Pseudouridines in spliceosomal snRNAs. Protein Cell 2: 712–725. [DOI] [PMC free article] [PubMed] [Google Scholar]
Associated Data
This section collects any data citations, data availability statements, or supplementary materials included in this article.