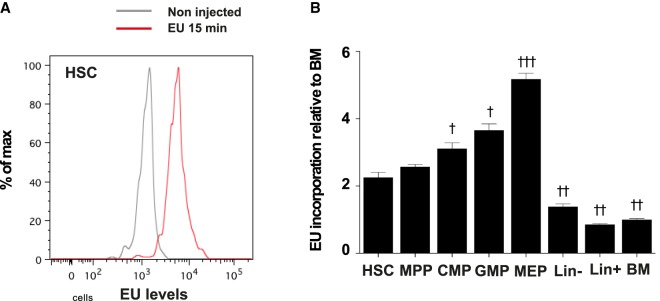
FIGURE 5.
RNA transcription in BM cells. BM cells were incubated or not in the presence of 1 mM EU for 15 min. (A) FACS profile of EU levels in HSC population of samples incubated without EU (gray) or with EU for 15 min (red). (B) Quantification of EU levels in the indicated populations, relative to EU levels in the BM population (HSC: Lin– Sca1+ cKit+ CD34–; MPP: Lin– Sca1+ cKit+ CD34+; CMP: Lin– Sca1+ cKit+ CD34hi FCγRII/IIIhi; GMP: Lin– Sca1+ cKit+ CD34low FCγRII/IIIlo; MEP: Lin– Sca1+ cKit+ CD34low FCγRII/IIIlo). Statistical significance of the difference in EU levels between HSCs and other populations was calculated using one-way ANOVA with Dunnett's correction for multiple comparisons: (†) P < 0.05, (††) P < 0.01, and (†††) P < 0.001. n = 4 mice; results representative of two independent experiments.

